

jaflippo/iStock via Getty Images
by Levi at StockWaves, produced with Avi Gilburt
A nearly -70% haircut in the stock price for Nvidia (NASDAQ:NVDA) from the peak in November of 2021. That’s a massive valuation reset, to put it mildly. It was in early November of that same time period that our analysts began to warn of an important high forming. Here’s a screenshot from one of our lead analysts in the StockWaves room, Garrett Patten:
MotiveWave/ElliottWaveTrader.net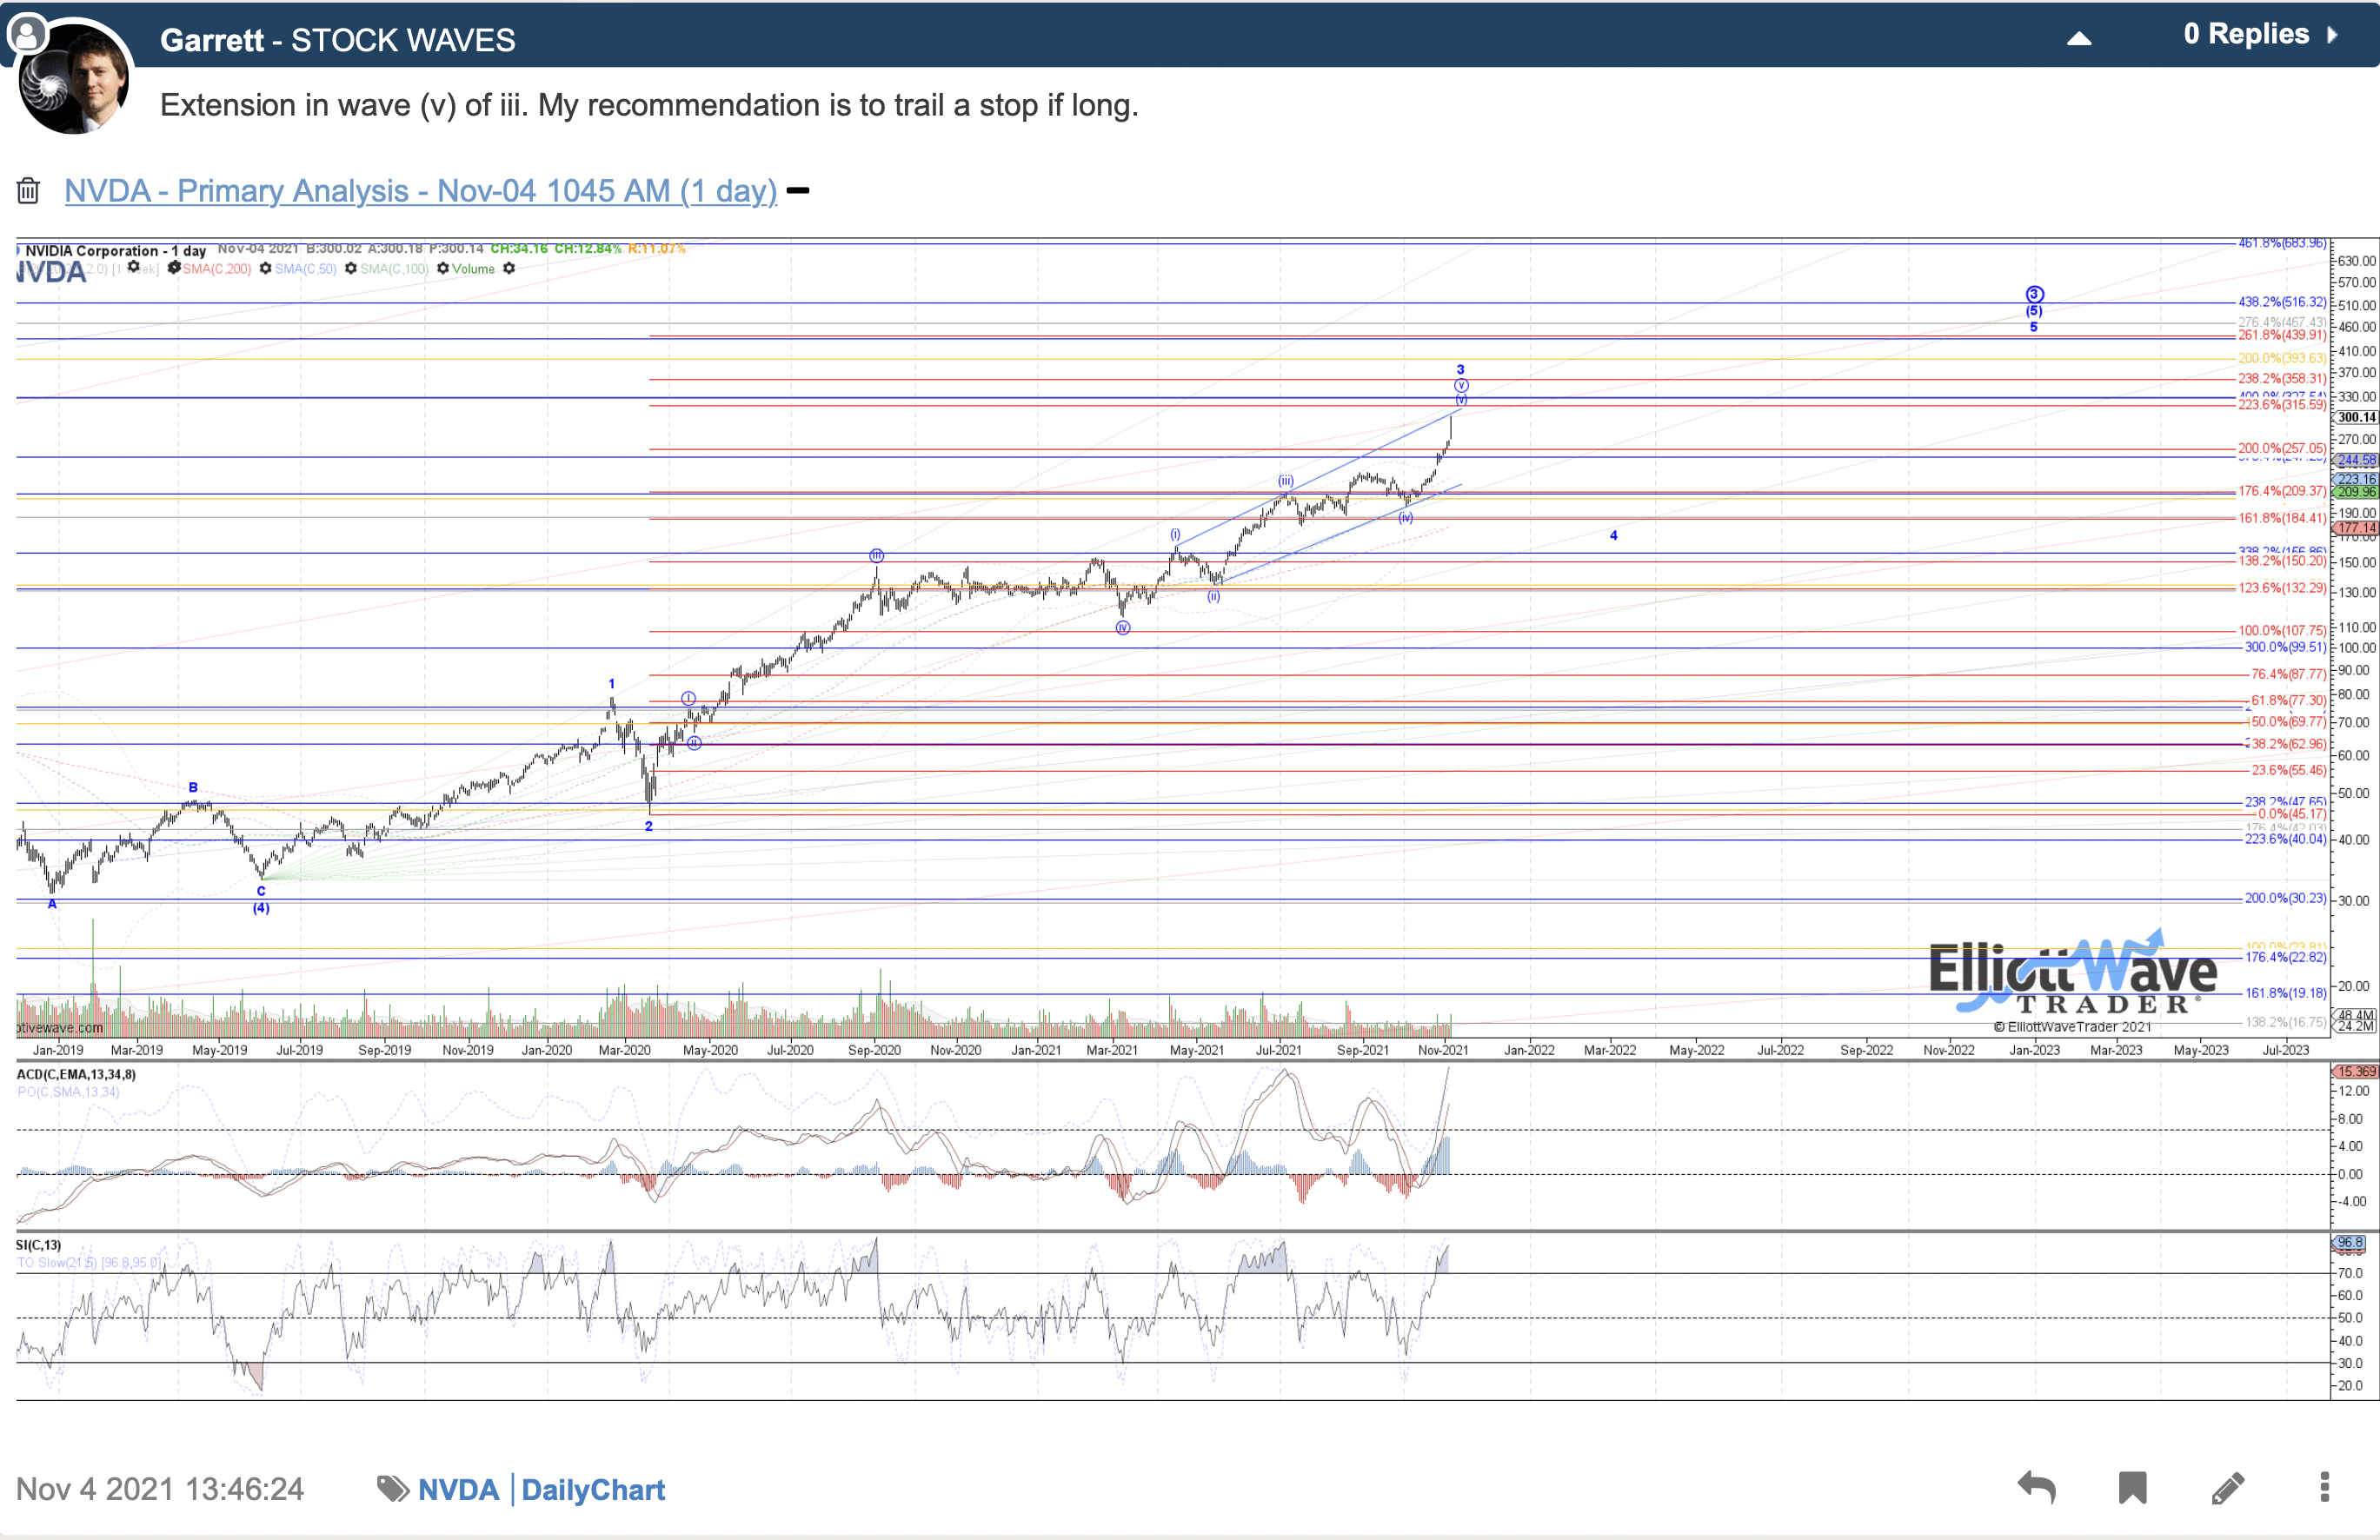
It was just a few weeks later that our other lead analyst, Zac Mannes, illustrated a likely path for NVDA over the next several months. Note this screenshot from Nov. 23, 2021:
MotiveWave/ElliottWaveTrader.net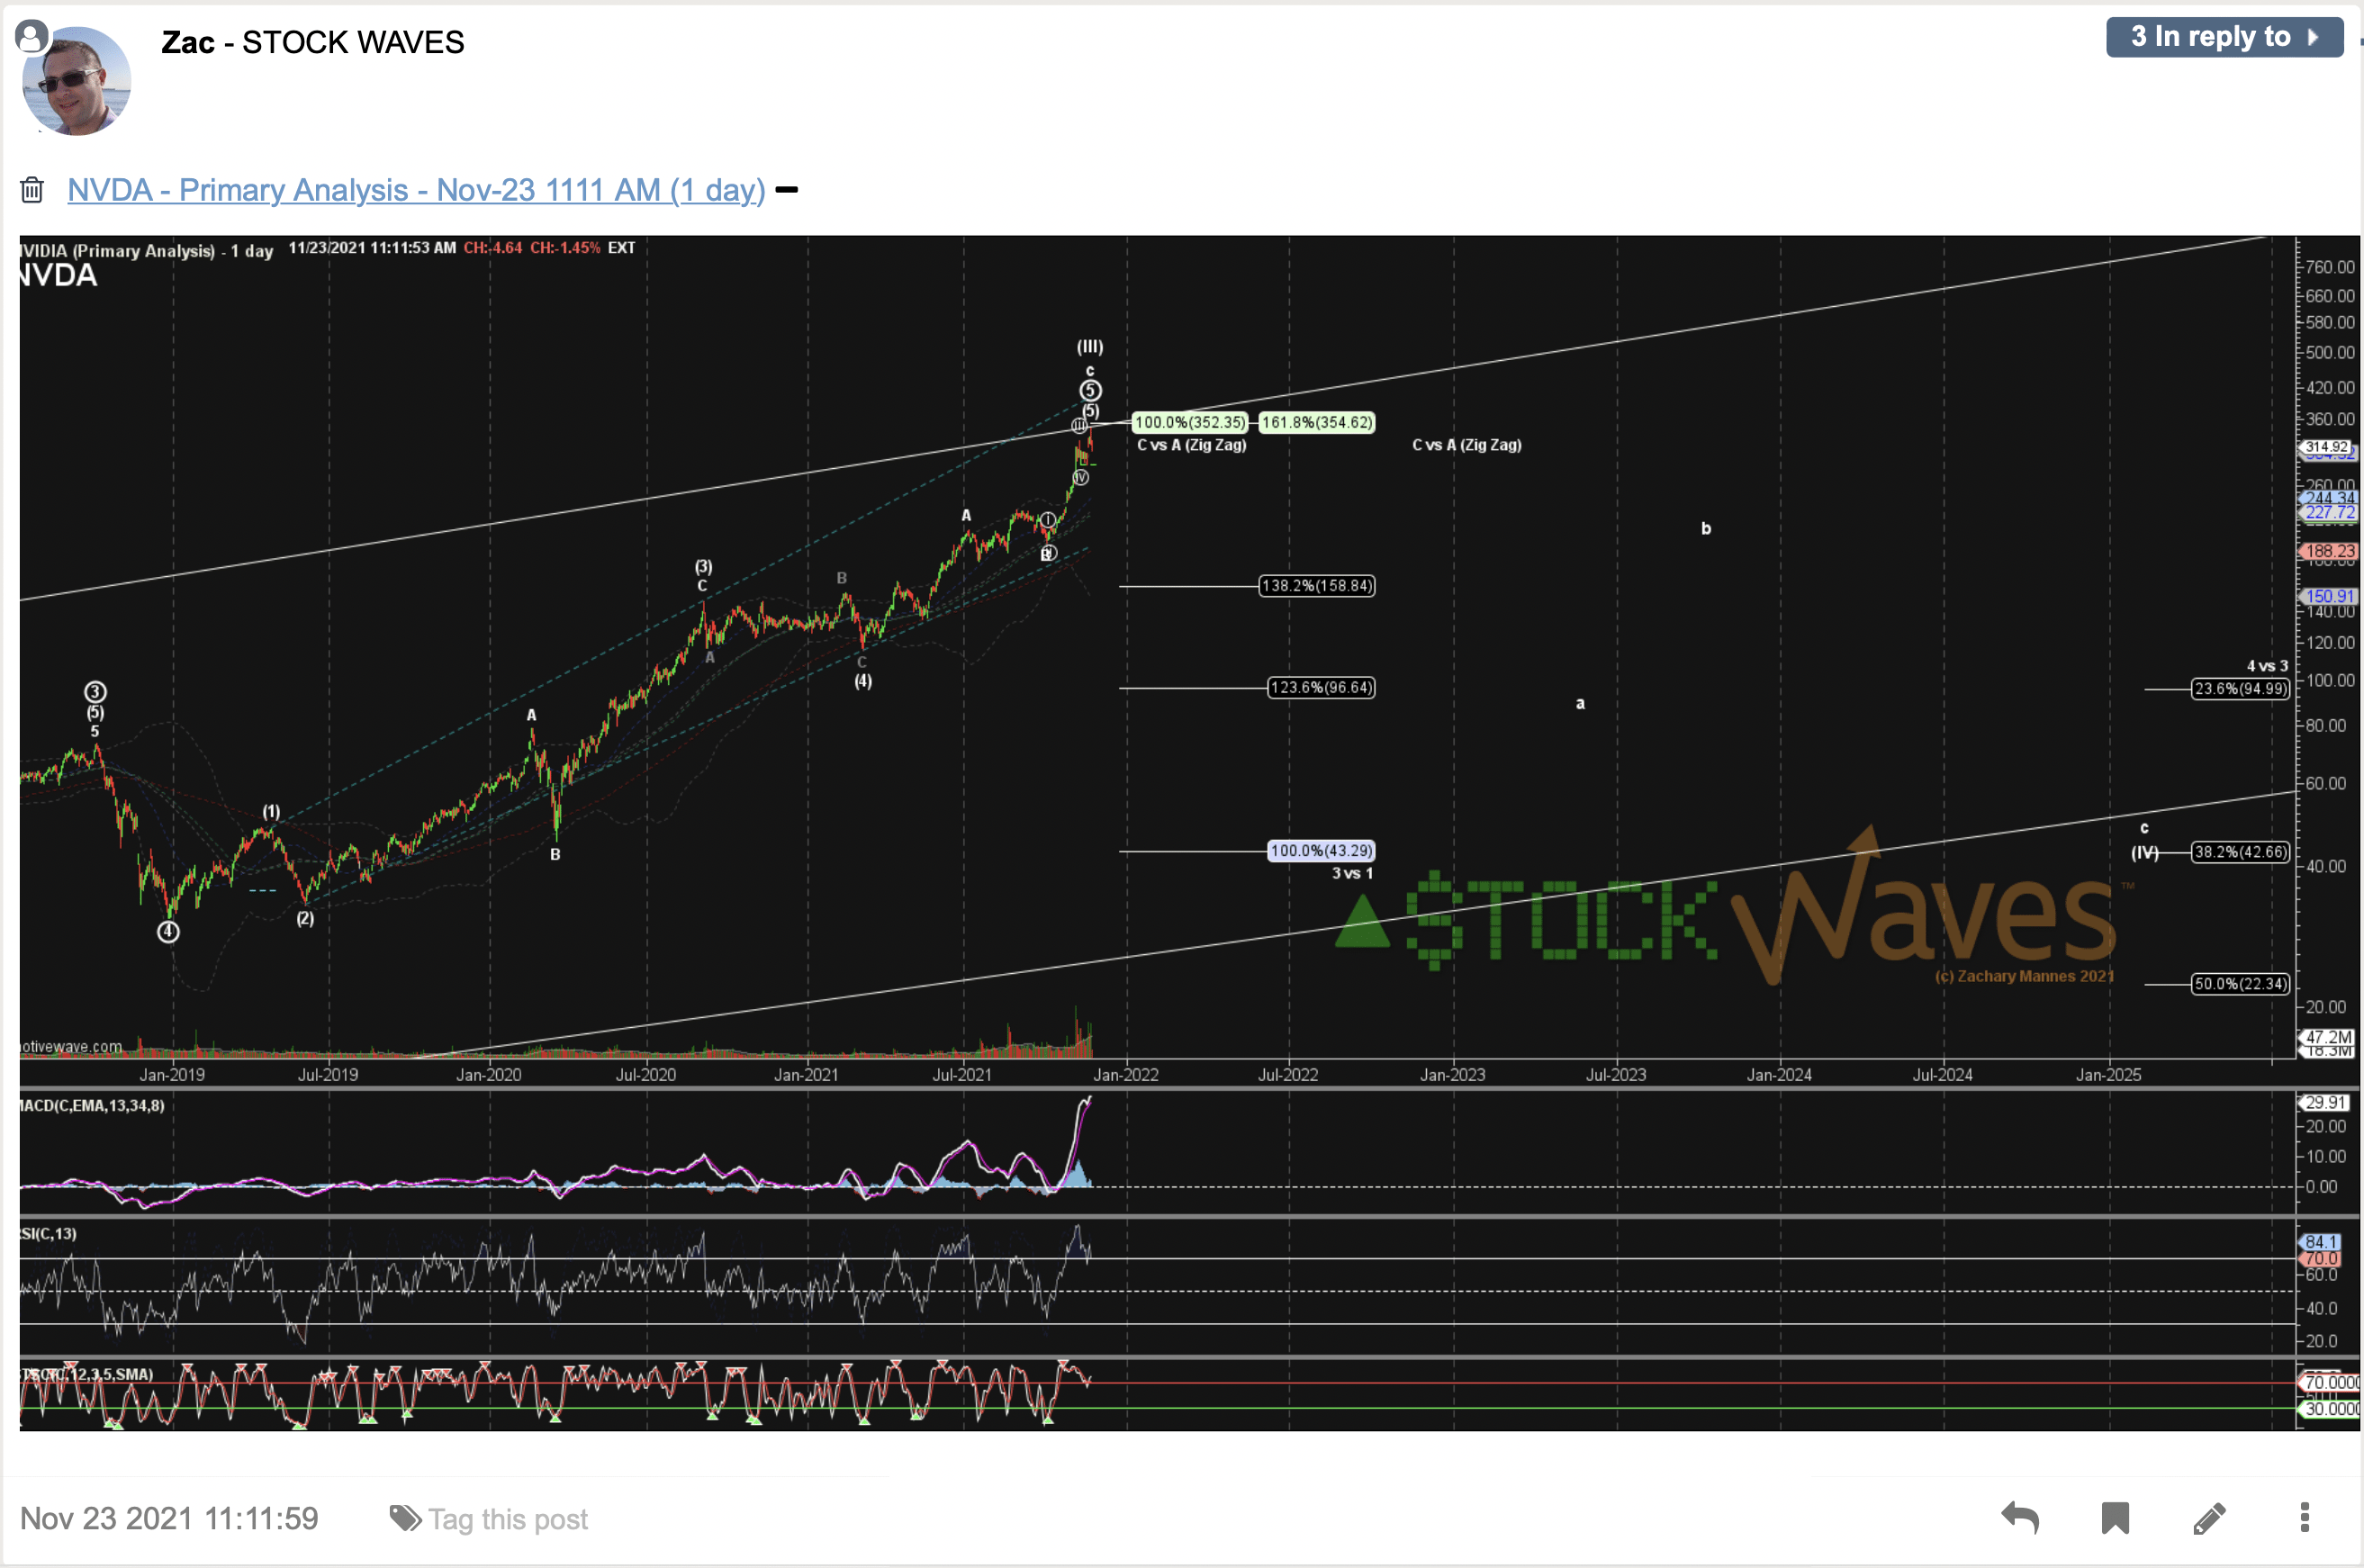
Now, notice where NVDA found its most recent low – very close to the $100 level that Zac was able to project many moons before it actually happened. What’s more is that for several weeks Lyn Alden had been posting about rich valuations in the tech sector and this found excellent synergy with our technical analysis also being presented to our members.
It was back on June 8 of this year that we saw the possibility for NVDA to have found an important low and therefore published the article “Nvidia Is Heating Up.” This was the key takeaway from that piece:
“So, in a standard impulsive structure up from the low marked as wave 4 that was struck at $155.67, Nvidia should form 5 waves up in what would be the wave circle ‘i’ you see. At this time, price has only formed 3 waves up. We are still cautious and awaiting confirmation of this initial 5 waves up from the recent low.”
The Current Fundamental Viewpoint for NVDA
As you can see from the chart and recent history, NVDA never made that higher high. The caution was well warranted and price did indeed make a new low thereby completing that near -70% chop in valuation. Well, where does that leave us now? Shares have moved up nicely since the low struck at $108 on Oct. 13. Is now the time to jump back in?
Let’s take a look at the current fundamental valuation and commentary provided by Lyn Alden:
“Nvidia continues to produce some of the most important technology for this decade. However, valuation remains a concern. The bubble aspects have worn off by this point, and the stock is back down to normal historical valuations. However, with the highest cost of capital at the current time, the appropriate valuation for the stock is likely somewhat lower. I would like to see more consolidation in the stock before I would consider establishing a long position.”
FastGraph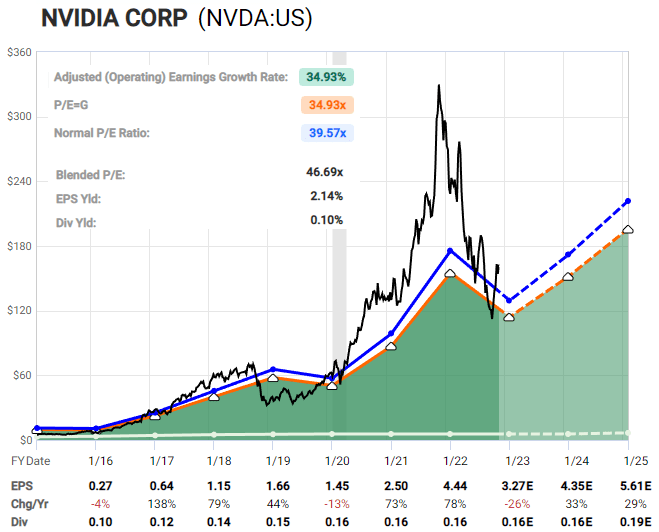
This dovetails so well with what we are seeing in the structure of price. We use this to measure crowd sentiment. For those familiar with our methodology, you will know that we look for the intersection of favorable fundamentals along with the structure of price via technicals that provides us with high-probability setups.
The Technical Viewpoint For NVDA
With making another low in October that was below the June low, the structure of price has created what looks to be 5 waves down from the November 2021 high. What does that mean for us now? Likely there will be a large corrective bounce over the next several weeks to even months before another decline unfolds, perhaps later in 2023.
But, let’s take this one step at a time. For now, we have what looks to be 5 waves down in what we are counting as an [A] wave of a larger primary fourth wave correction. Now, suppose the [B] of this corrective move retraces up to the 62% region of this entire decline down from $346. That points to the $222 level.
Inside that [B] wave bounce, we would anticipate an A-B-C structure and inside of that initial A wave there would even be a lesser degree a-b-c. Most all ‘C’ waves are 5 waves in structure. In fact, we are yet to observe one that is not. And, that is our setup.
Our primary path has this current A wave of the larger [B] wave bounce nearing completion. We say this because there are nearly 5 waves up for the smaller circle ‘c’ of the A wave, as you can see on the attached chart.
TradingView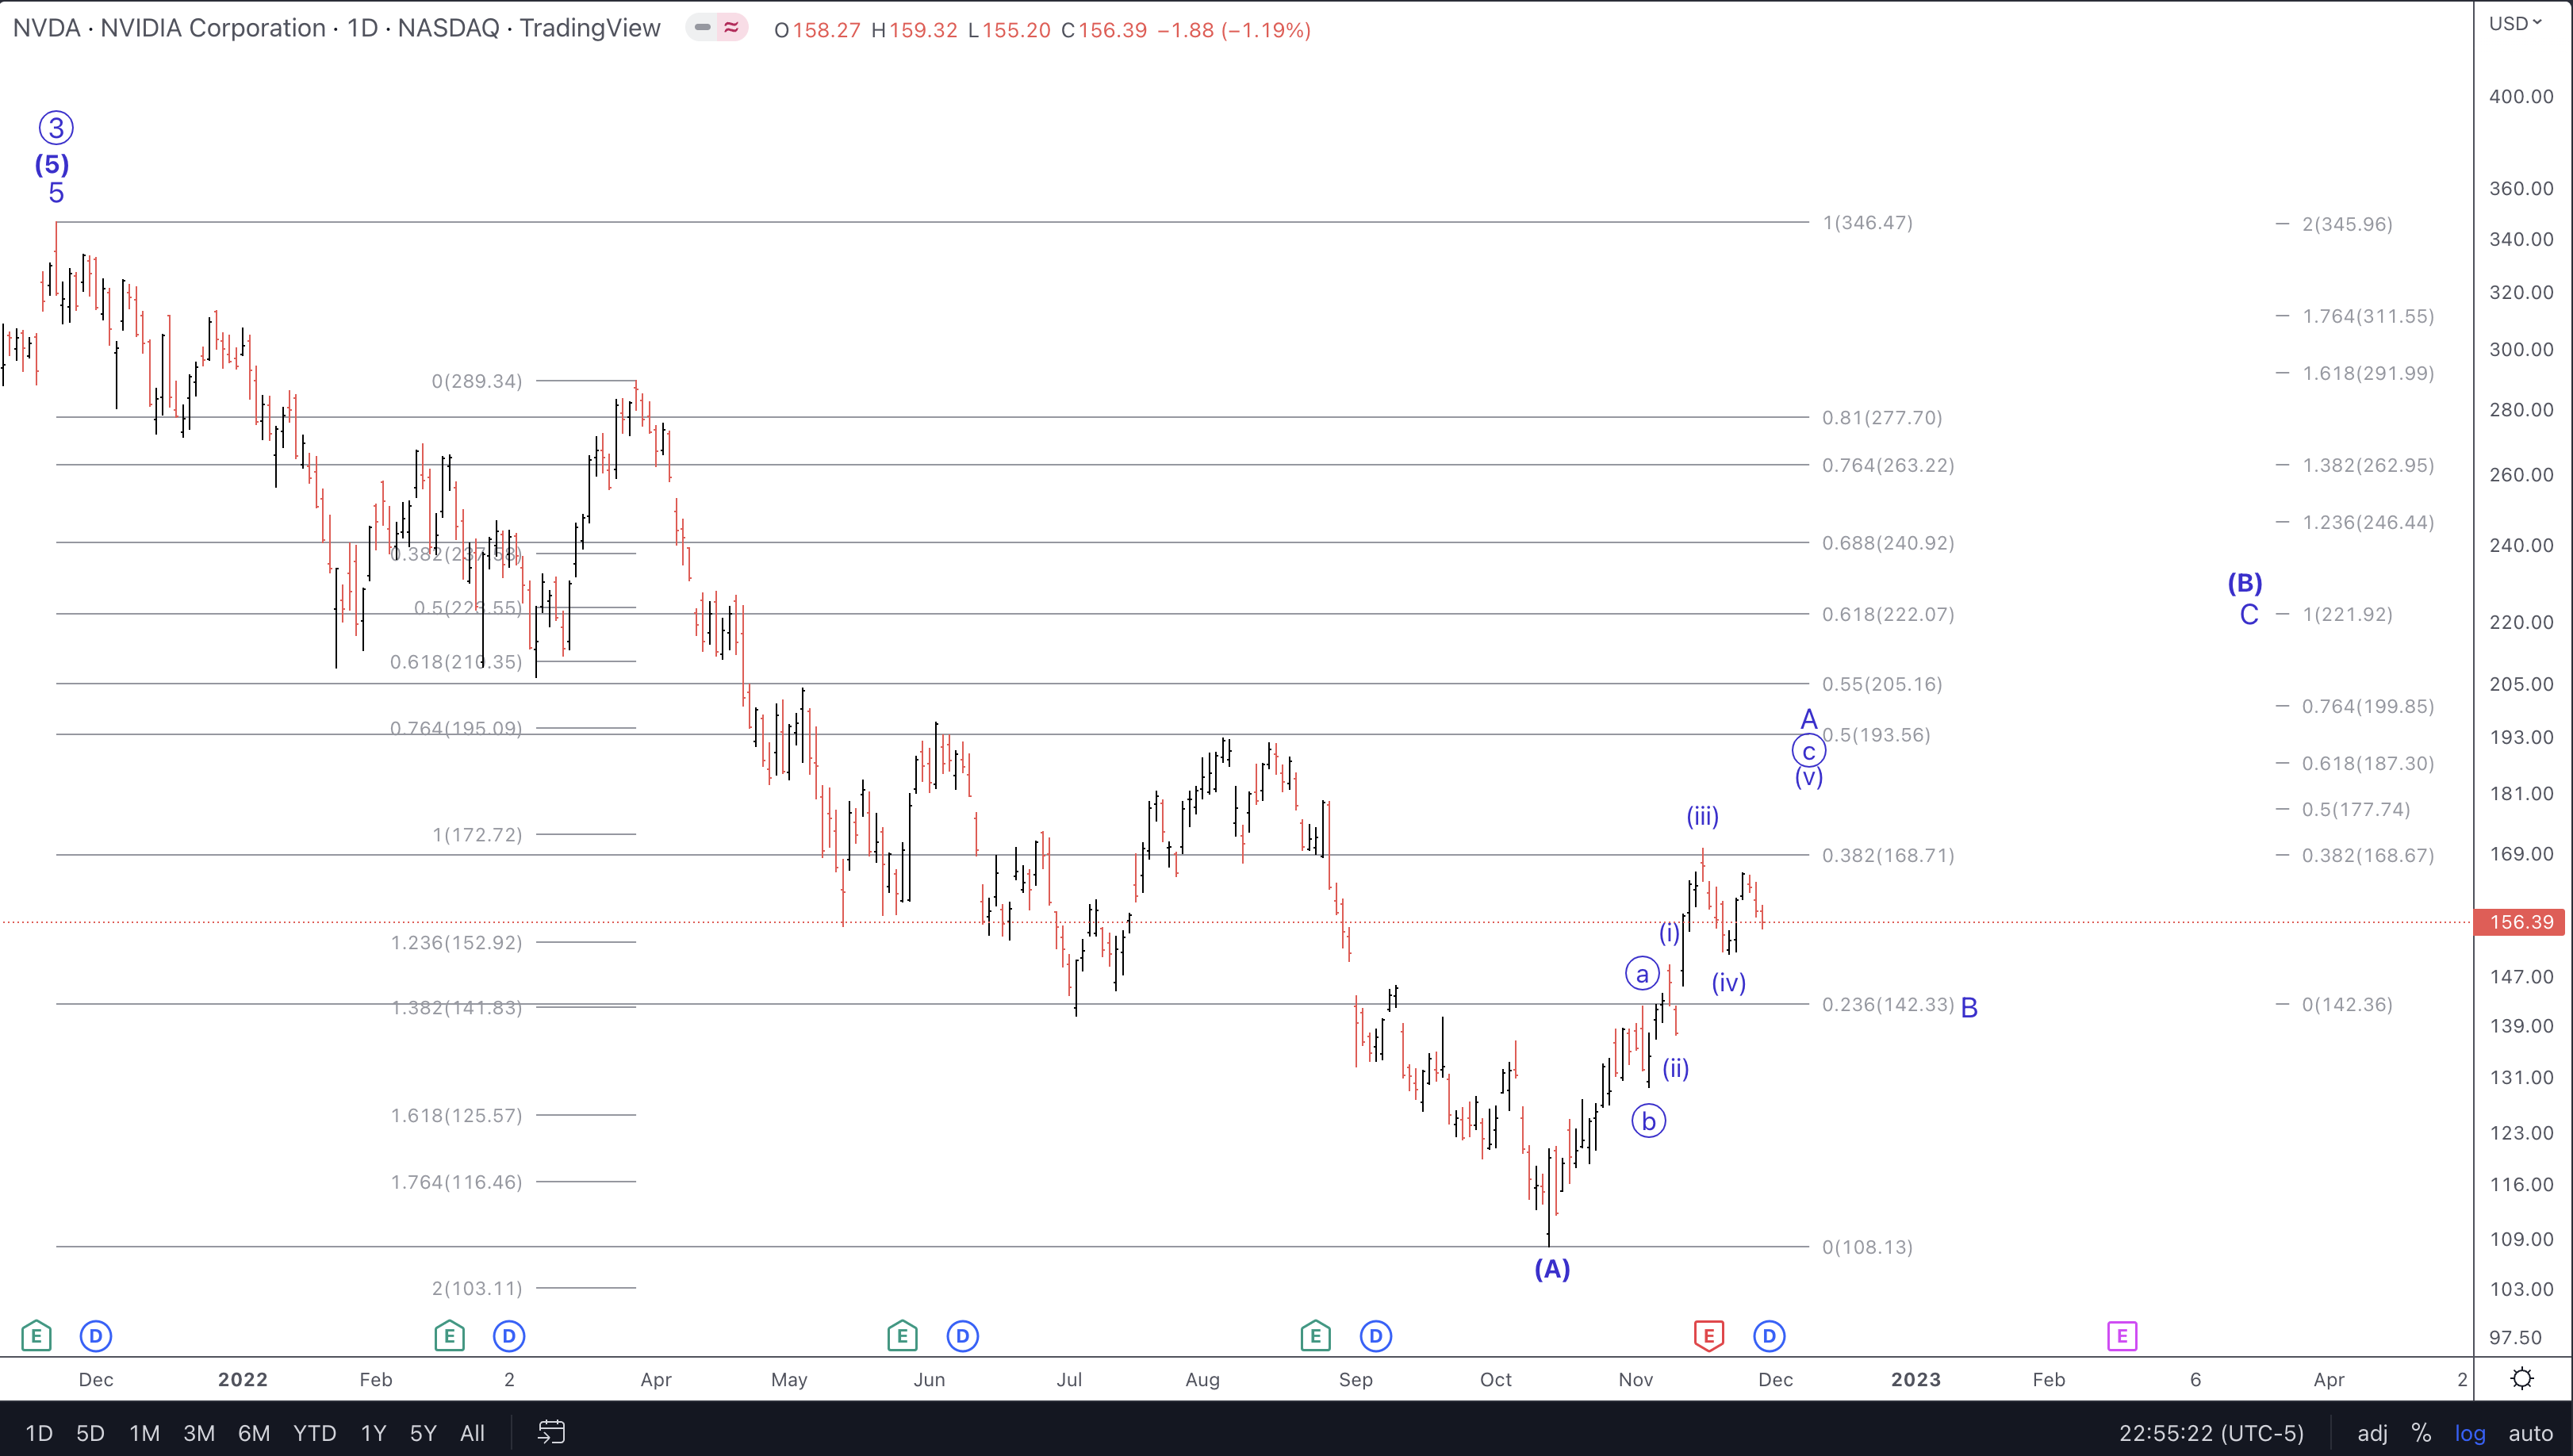
For as long as price remains above $145 – $150, then we anticipate one more swing higher to complete wave [v] of ‘c’ of A of [B] of Primary 4. Why all of the alphabet soup? More on that at the end of this piece.
Conclusion and Risks
While we do not find this as the most probable path, it is plausible that the $170 area struck on the 15th of this month is all the bounce NVDA will see. However, from there, price would likely form an initial micro 5 waves down and then bounce in a 3 wave corrective move.
As well, it’s possible to see the $170 area as all the corrective bounce that NVDA will see and it will head to new lows under the $108 low struck in October. Again, not our primary path.
We see the highest probability setup forming once the A wave tops and we see the B wave low shape up. From that B wave low there should be an initial micro 5 waves up and then 3 waves down that will signify the C wave of the larger [B] is underway.
So, some patience is still warranted. Some may choose to trade what’s likely left of this A wave bounce. Others will wait for the B wave decline to complete and let the initial impulsive wave up begin. And yet others are looking to short this and other Tech names. Time frame and individual goals, plus risk tolerance, are important. That brings us to the alphabet soup question.
What Is Market Context And How Can It Help Me?
Elliott Wave theory, correctly applied, is the only methodology that we have found that can provide context as to where we likely find ourselves in the markets at any moment in time. It assists us in knowing where to trade/invest aggressively and where to expect a whipsaw environment, thereby signaling us to either trade smaller or even not at all.
The alphabet soup mentioned above is simply nomenclature that tells the reader where we are on the path at any given instant. And remember that the markets are fractal in nature. They exhibit self-similarity at all degrees. These patterns repeat from the lesser to the greater degrees. This is what gives Elliott Wave its power and predictability.
This is a small portion of the extensive information available in the Education section of our website:
“Elliott Wave theory understands that public sentiment and mass psychology moves in 5 waves within a primary trend, and 3 waves in a counter-trend. Once a 5 wave move in public sentiment is completed, then it is time for the subconscious sentiment of the public to shift in the opposite direction, which is simply a natural cause of events in the human psyche, and not the operative effect from some form of ‘news’.”
“In fact, the former Chairman of the Federal Reserve, Alan Greenspan, understood this fact well. During his tenure, in several hearings in front of the Joint Economic Committee, Mr. Greenspan noted that the idea that the Fed can prevent recessions is a “puzzling notion” . . . Rather, the stock market is “driven by human psychology” and “waves of optimism and pessimism.'”
“This concept is inherent in the aggregate actions of individuals. Based upon these concepts, it is clear that man’s progress and regression does not take the form of a straight line, nor does it occur randomly in nature. Rather, it progresses in 3 steps forward, with two steps back within the primary trend.”
“This is the basis of the Elliott Wave theory. This mass form of progress and regression seems to be hard wired deep within the psyche all living creatures, and that is what we have come to know today as the “herding principle,” which is what gives the Elliott Wave theory its ultimate power.”
“This theory has been proven time and time again throughout history. This is the basis behind the Elliott Wave, which is enhanced through the concept of Phi; the Golden Ratio. These concepts have been understood by Plato, Pythagoras, Bernoulli, DaVinci and Newton. Historic structures have been built by architects of famous Greek structures, such as the Parthenon, and even as far back as the architects of the Great Pyramid of Giza in Egypt, who recorded their knowledge of Phi as the building block for all man nearly 5,000 years ago.”
“For a more detailed understanding of this concept and application, I highly suggest reading Elliott Wave Principle, by Frost & Prechter.”
I would like to take this opportunity to remind you that we provide our perspective by ranking probabilistic market movements based upon the structure of the market price action. And if we maintain a certain primary perspective as to how the market will move next, and the market breaks that pattern, it clearly tells us that we were wrong in our initial assessment. But here’s the most important part of the analysis: We also provide you with an alternative perspective at the same time we provide you with our primary expectation, and let you know when to adopt that alternative perspective before it happens.
There are many ways to analyze and track stocks and the market they form. Some are more consistent than others. For us, this method has proved the most reliable and keeps us on the right side of the trade much more often than not. Nothing is perfect in this world, but for those looking to open their eyes to a new universe of trading and investing, why not consider studying this further? It may just be one of the most illuminating projects you undertake.
Be the first to comment