

Drew Angerer/Getty Images News
Thesis
My last article on Nvidia (NASDAQ:NVDA) was co-produced with Envision Research. That article focused on the impact of cryptocurrency mining on NVDA. In particular, we compared the current crypto situation against the 2018 winter to analyze NVDA’s exposure. In this article, I will switch the focus to providing an outlook on its incoming Q2 earnings report, which is scheduled for the incoming Wednesday (August 24) after the market close. Note that its fiscal year is different from the calendar year, and the report will be for the 2nd Quarter of its FY2023.
In particular, this earnings preview will concentrate on anticipating the impact of the CHIPS Act on NVDA. NVDA issued its preliminary results on August 8 and cautioned a 19% revenue decline from the prior quarter. Even with such gloomy preliminary results, the stock prices held up well though as you can see from the following chart. And in my view, a big reason is the CHIPS Act. As of July 27, 2022, the CHIPS Act has already passed both the House of Representatives and also the Senate. And after that, investors already assumed that it will be signed into law shortly given that President Biden has provided his support openly before. Indeed, on August 9, President Biden signed the 2022 CHIPS Act into law. And you can see its stock prices, and the stock prices for Advanced Micro Devices (NASDAQ:AMD) too, rallied sharply after the act passed the senate.
Seeking Alpha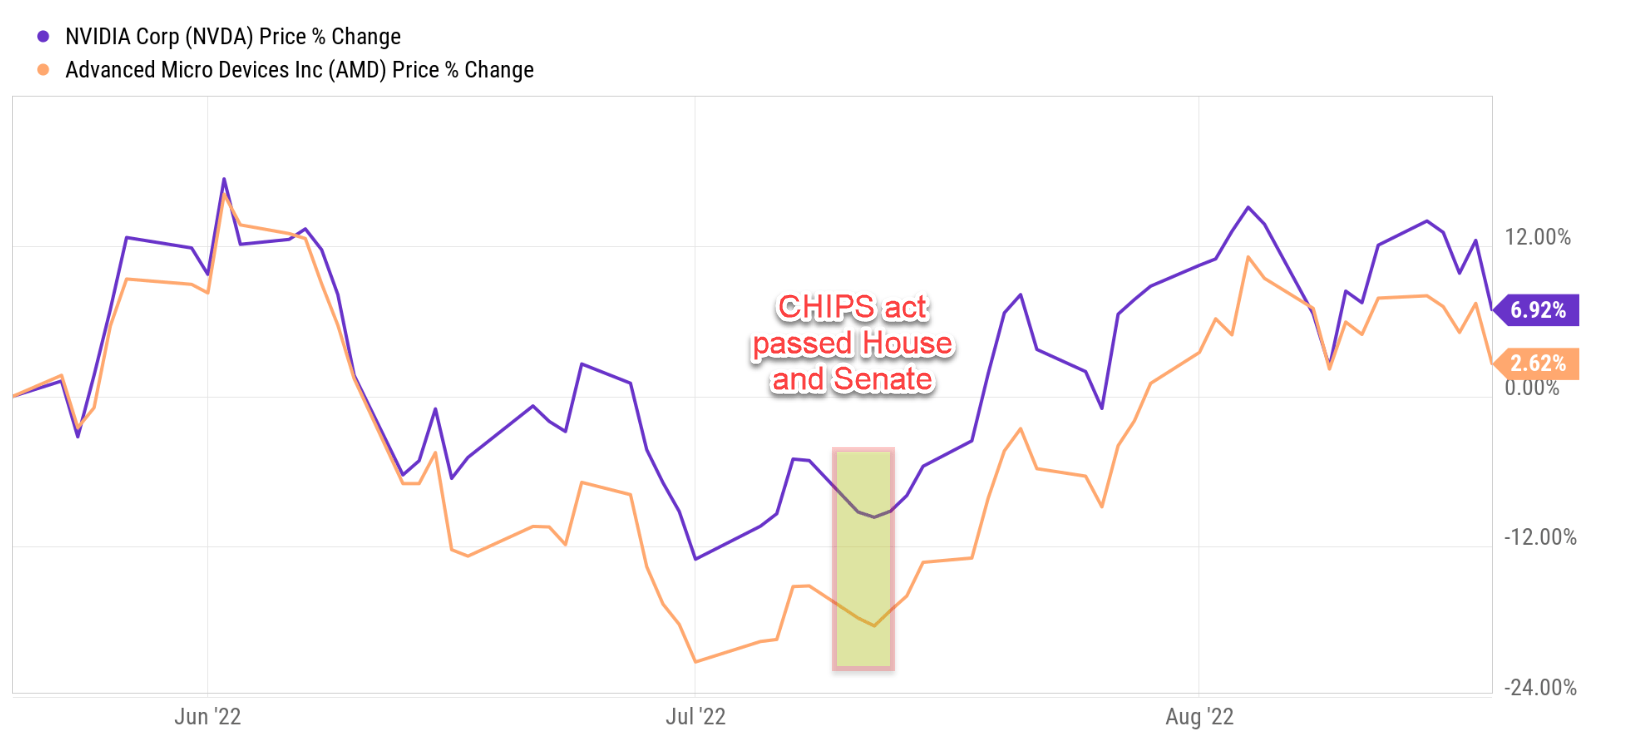
Now, the stock prices are almost unchanged from 3 months ago (with a 6.9% rally for NVDA and about 2.6% for AMD to be exact) since their Q1 results. The market is anxiously waiting for the Q2 ER to decide its next move.
And my view is that we will very likely see a sizable upward price movement during the incoming ER. The market has already priced in the bad news from the preliminary results. Such that now, any positive comments from the CHIPS Act during Q2 can trigger an upward movement. And indeed, there is plenty of potential for positive comments from the management. As an example, the following table summarizes the potential impact of the act on NVDA and AMD’s R&D expenses. As fabless chip stocks, I anticipate the CHIPS Act to at least effectively boost their R&D expenses by about 25% (or equivalently, increase their R&D yield, or their R&D investment rates) by about 5% due to tax considerations. To be more exact, my estimated benefits are about 4.6% for AMD and 4.8% for NVDA.
In the remainder of this article, you will see the implications of such benefits for their return potential. And furthermore, we will also explore other 2nd order benefits from the act besides tax benefits on the R&D expenses.
Author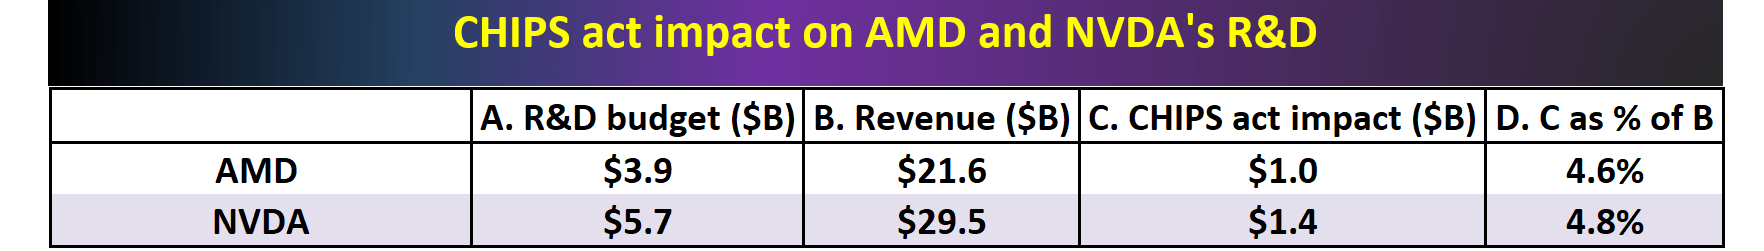
Recap of the 2022 CHIPS Act
The details of the CHIPS act are now summarized in this news release from the White House. The title summarizes its strategic goals nicely already: the act is aimed at lowering costs of chip manufacturing in the U.S., creating related jobs, strengthening the supply chains, and countering China. Overall, the act will provide a total of ~$280 billion in the form of grants and subsidies to the U.S. semiconductor industry. The more detailed specifics relevant to this article are highlighted below
The White House Briefing Room: The CHIPS and Science Act provides $52.7 billion for American semiconductor research, development, manufacturing, and workforce development. This includes $39 billion in manufacturing incentives, including $2 billion for the legacy chips used in automobiles and defense systems, $13.2 billion in R&D and workforce development, and $500 million to provide for international information communications technology security and semiconductor supply chain activities. It also provides a 25 percent investment tax credit for capital expenses for manufacturing of semiconductors and related equipment.
Given the large chunk of funding earmarked toward manufacturing, I anticipate chips stocks with a fab segment such as Intel (INTC) and Texas Instruments Incorporated (TXN) to benefit more as analyzed in our earlier articles. However, as to be elaborated on next, fabless stocks such as NVDA and AMD can benefit substantially too.
AMD and NVDA: R&D expenses and CHIPS Act impact
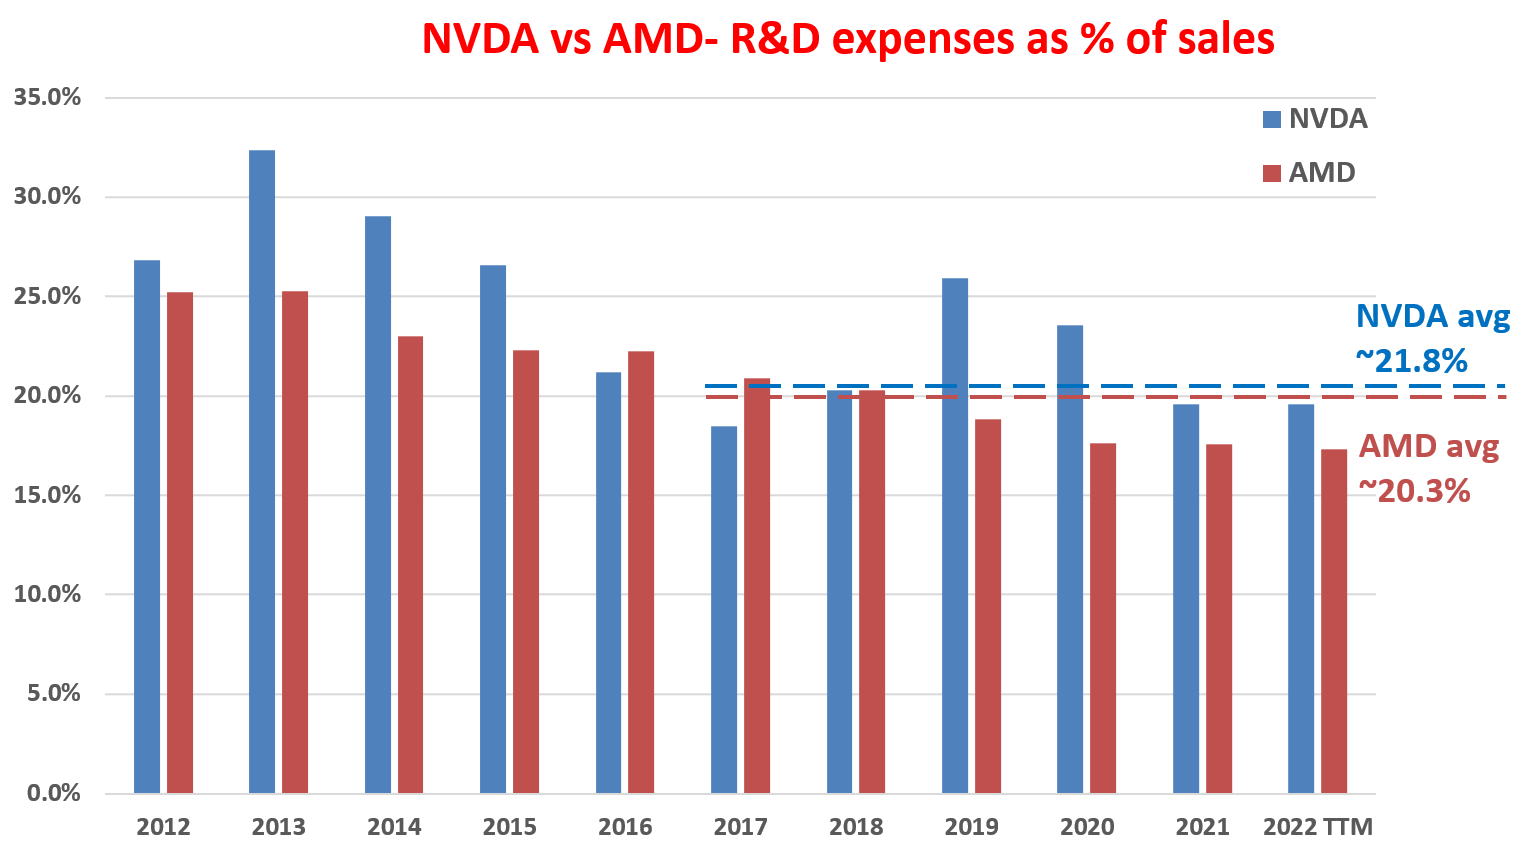
The first way fabless stocks can benefit is through their R&D expenses. Let’s first see the R&D expenditures of AMD and NVDA, so we can put the scale of the act into perspective. The next two charts show the R&D expenses of AMD and NVDA over the past decade and the R&D expenses as a fraction of their total revenues, respectively. As seen, both have been investing heavily in R&D and growing their R&D budgets rapidly and consistently over the years. AMD on average has been spending about 20.3% of its total revenue on R&D efforts. Similarly, NVDA has been spending on average about 21.8% of its sales in recent years on R&D.
In absolute terms, AMD’s R&D expenses are about $3.9B TTM and NVDA’s about $5.7B TTM. Out of the total act, the National Science Foundation (“NSF”) will be provided funding of $81 billion to support fundamental research and innovation in the industry. The $81 billion from NSF alone for fundamentals research is more than 14 years of NVDA’s R&D budget and more than 20 years of AMD’s.
Seeking Alpha Author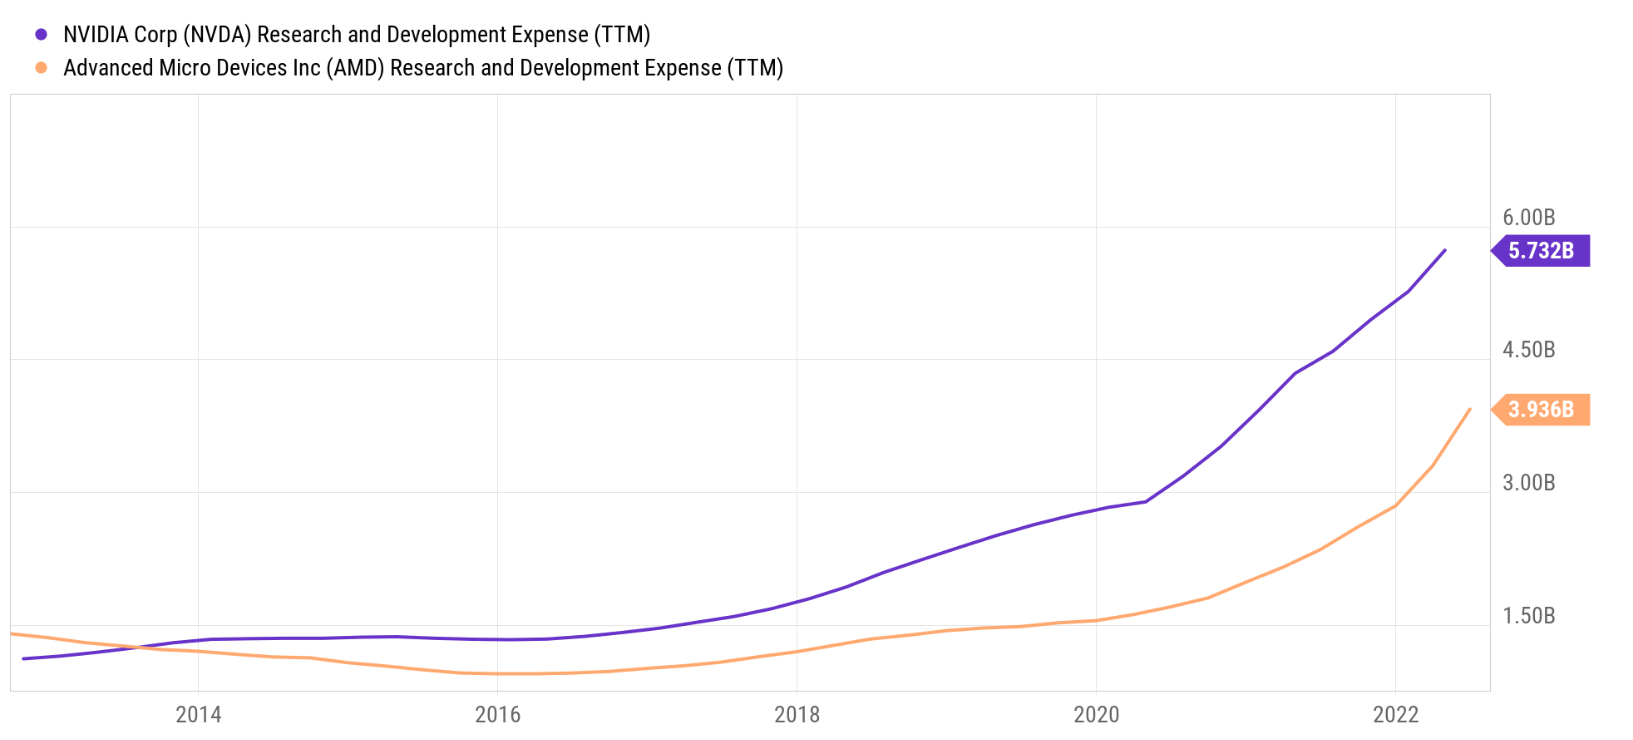
AMD and NVDA: impact on R&D yield
After contextualizing its scale, now let’s assess its impact. First, let me clarify that this is more of a scenario analysis/estimate. AMD released its Q2 earnings report (“ER”) on Aug 2 and the ER did not factor in or contain any comment regarding the impacts of the CHIPS Act because the act only passed the senate a few days ago. And as aforementioned, the main goal of this analysis is to provide an estimate of the impact of NVDA. The goal is not to be precisely right, but only roughly or even just directional right, so we are prepared if the scenario does materialize during the ER.
Under this disclaimer, I will present my scenario analysis below. Here we will use a variation of Buffett’s $1 test on R&D expenses to assess the impact. The method is detailed in our earlier articles and a brief recap is provided below:
The purpose of any corporate R&D is obviously to generate profit. Therefore, it is intuitive to quantify the yield by taking the ratio between profit and R&D expenditures. This way we can quantify how many dollars of profit has been generated per dollar of R&D expenses, as shown in the next chart. In this chart, I used the operating cash flow as the measure for profit. Also, most R&D investments do not produce any result in the same year. They typically have a lifetime of a few years. Therefore, this analysis assumes a 3-year average investment cycle for R&D. And as a result, we use the 3-year moving average of operating cash flow to represent this 3-year cycle.
As you can see, the R&D yield for both AMD and NVDA has been healthy. And the R&D yield has been expanding rapidly for AMD in recent years. They currently both generated more than $1 of profits for every dollar of R&D input. NVDA features an average of $1.3 of output since 2018 with overall consistency. AMD features a relatively lower average yield of $0.76 since 2018. But its yield has been rapidly expanding and currently stands at $1.1.
And with the tax credit and research grants provided in the CHIPS Act, I am projecting their R&D yield to go up by at least 25%. The benefits will come from two directions. Firstly, the tax credit will effectively reduce their real R&D expenses without changing the outputs. Secondly, the research grants will pay for a good portion of their R&D in the coming years (or even decades) as just analyzed above.
And we will make some specific projections on their R&D yield and profitability next.
Author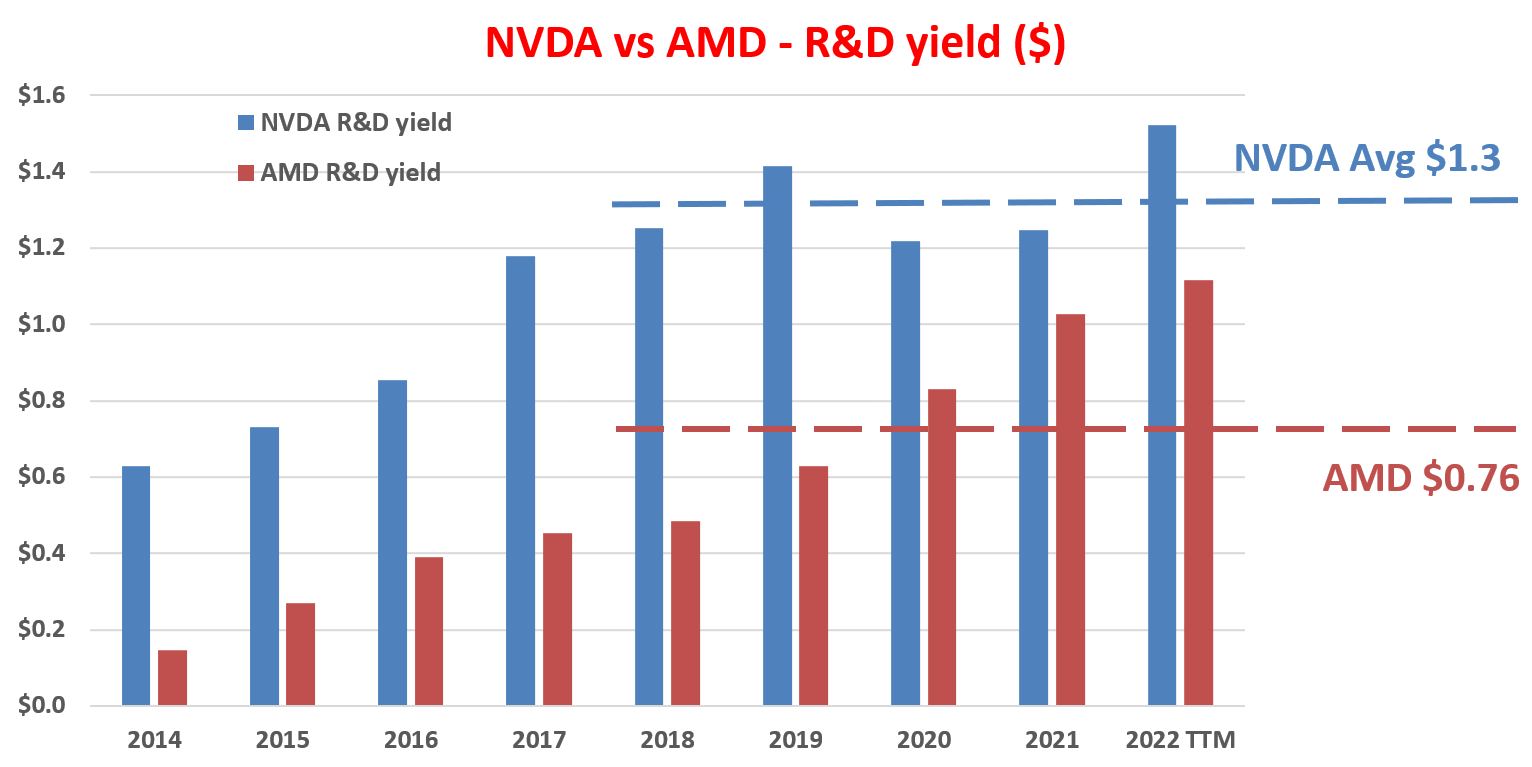
AMD and NVDA: impact on profitability
The above benefits on R&D expenses and yield will ultimately translate into enhanced profitability and growth. To assess the impact on profitability, I will use the metric of ROCE (return on capital employed). The metric is detailed in our earlier articles and a brief recap is provided below:
When we think of long-term growth (like in 10 years or more), the growth rate is “simply” the product of ROCE and reinvestment rate, i.e.,
Long-Term Growth Rate = ROCE * Reinvestment Rate
ROCE is the most important metric for measuring profitability because it considers the return of capital ACTUALLY employed. In this analysis, I consider the following items capital actually employed A) Working capital (including payables, receivables, inventory), B) Gross Property, Plant, and Equipment, and C) Research and development expenses are also capitalized.
Based on the above considerations, the ROCE of AMD and NVDA over the past few years is shown below. As seen, NVDA has been maintaining an overall consistent ROCE since about 2015. Its average ROCE has been about 60% in recent years, with narrow fluctuations between 50% and 65% most of the time. And AMD’s ROCE has been steadily improving over the recent few years as its new products began to compete effectively against INTC in 2013~2014. Its ROCE has climbed from about 10% in 2014 to the current level of ~50%. On average, its ROCE has been about 49% in recent years. And finally, despite the relative differences, both of their ROCE are very competitive even among overachievers like the FAANG whose average ROCE is somewhere between 45% to 55% in recent years.
With these ROCE results, we will quantify the impact of the CHIPS Act next.
Author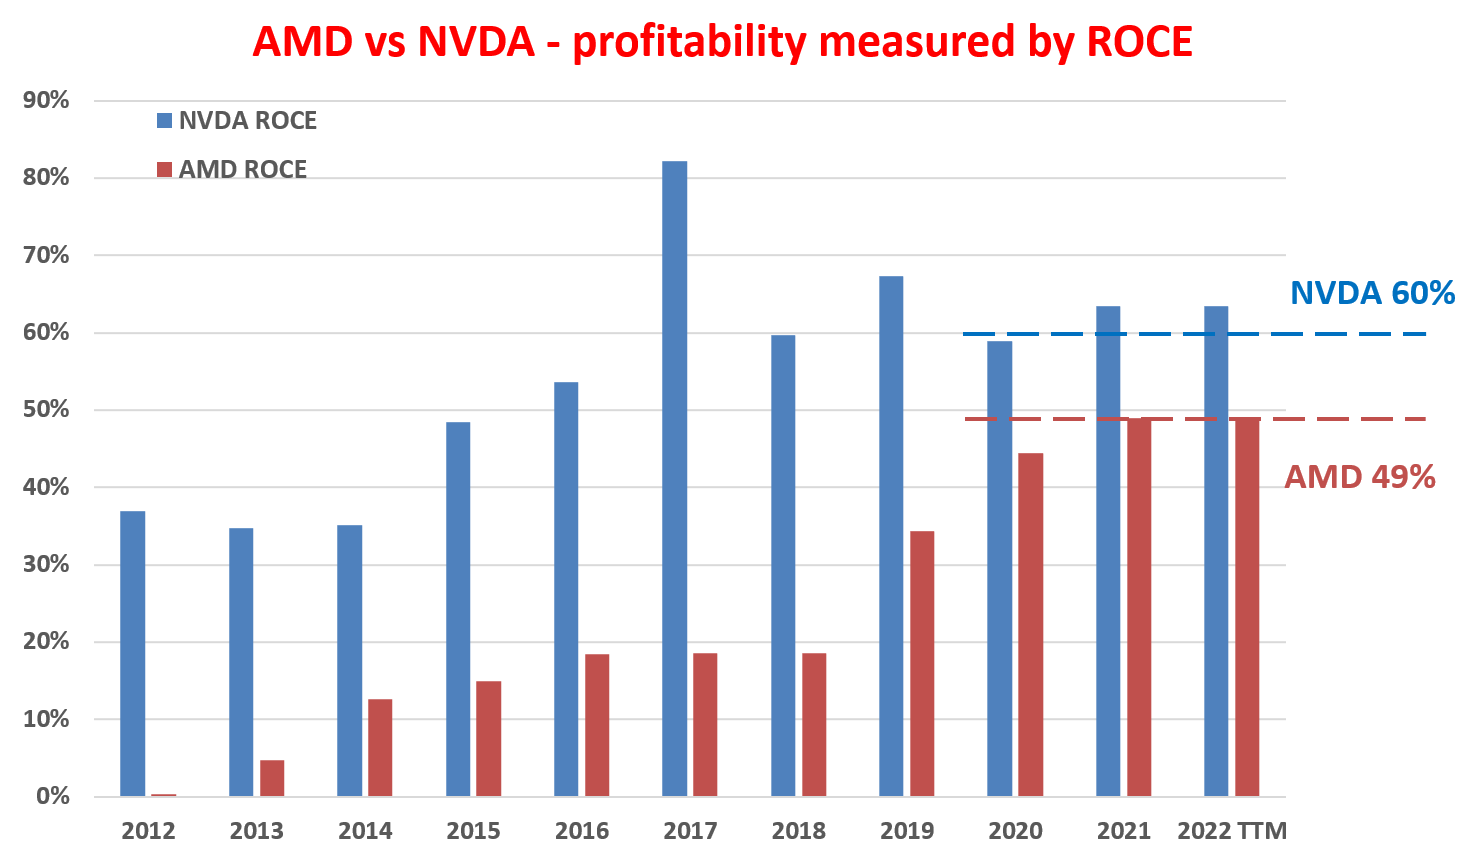
CHIPS Act – final results and summary
As mentioned above, the CHIPS Act could potentially boost their profitability and shareholder returns through several avenues: savings in R&D expenses, enhancement of R&D yields, expansion of free cash flow due to the R&D savings, subsidies in CAPEX expenditures, et al.
Here, to simplify the analysis and provide a higher-level understanding (and also to avoid the potential of double accounting), I will lump all of these possibilities into reinvestment rates. To me, the approach makes good intuitive sense and cut to the essence of the problem. No matter what the specific benefits (tax credits, reduced R&D expenses, higher R&D yields, et al), they all can be interpreted as a way to allow the business to reinvest more in themselves and better fuel their future growth.
AMD and NVDA have been both reinvesting at a rate of around 10% on average in the past (that is before the CHIPS Act). And as mentioned earlier, my estimate is that the subsidies from the act will effectively boost their reinvestment by about 5% (~4.6% for AMD and ~4.8% for NVDA). As a result, I expect their reinvestment rates to be effectively boosted to the 15% range.
Based on these projections, the table below summarizes their return drivers in the long term. As long-term business owners, our long-term return on investment (“ROI”) will come from both the owner’s earning yield (“OEY”) and the perpetual growth rates. And again, here I lumped all the potential benefits into the reinvestment rates and therefore the growth rates. Equivalently, a projection could be made to lump all the potential benefits into the expanded earnings and therefore reflected in a higher OEY. The end results will be the same.
Following the reinvestment rate approach, the key takeaways are:
- AMD offers a higher OEY at 4.5% given its currently more compressed valuation, compared to 2.1% from NVDA. Again, the CHIPS Act does not directly impact their OEY under this approach.
- Instead, the potential benefits are reflected in the boost of their perpetual growth rates as shown. Without the act, AMD’s perpetual growth rate is projected to be around 4.9% (49% ROCE * 10% reinvestment rate = 4.9%) and NVDA around 6%. With the act boosting their reinvestment rates to the ~15% level, the growth rates are estimated to be about ~9% for both AMD and NVDA.
- Note that here I also made an assumption that AMD’s ROCE would maintain its current trajectory of expansion and finally match that of NVDA (i.e.,60%). I think this is a reasonable assumption and the Xilinx adds immediate catalysts to this assumption as argued in our recent article.
- And finally, both are projected to provide a total return in the long term in the double-digits with the potential benefits for the act factored in: about 13% per annum for AMD and about 11% for NVDA.
Author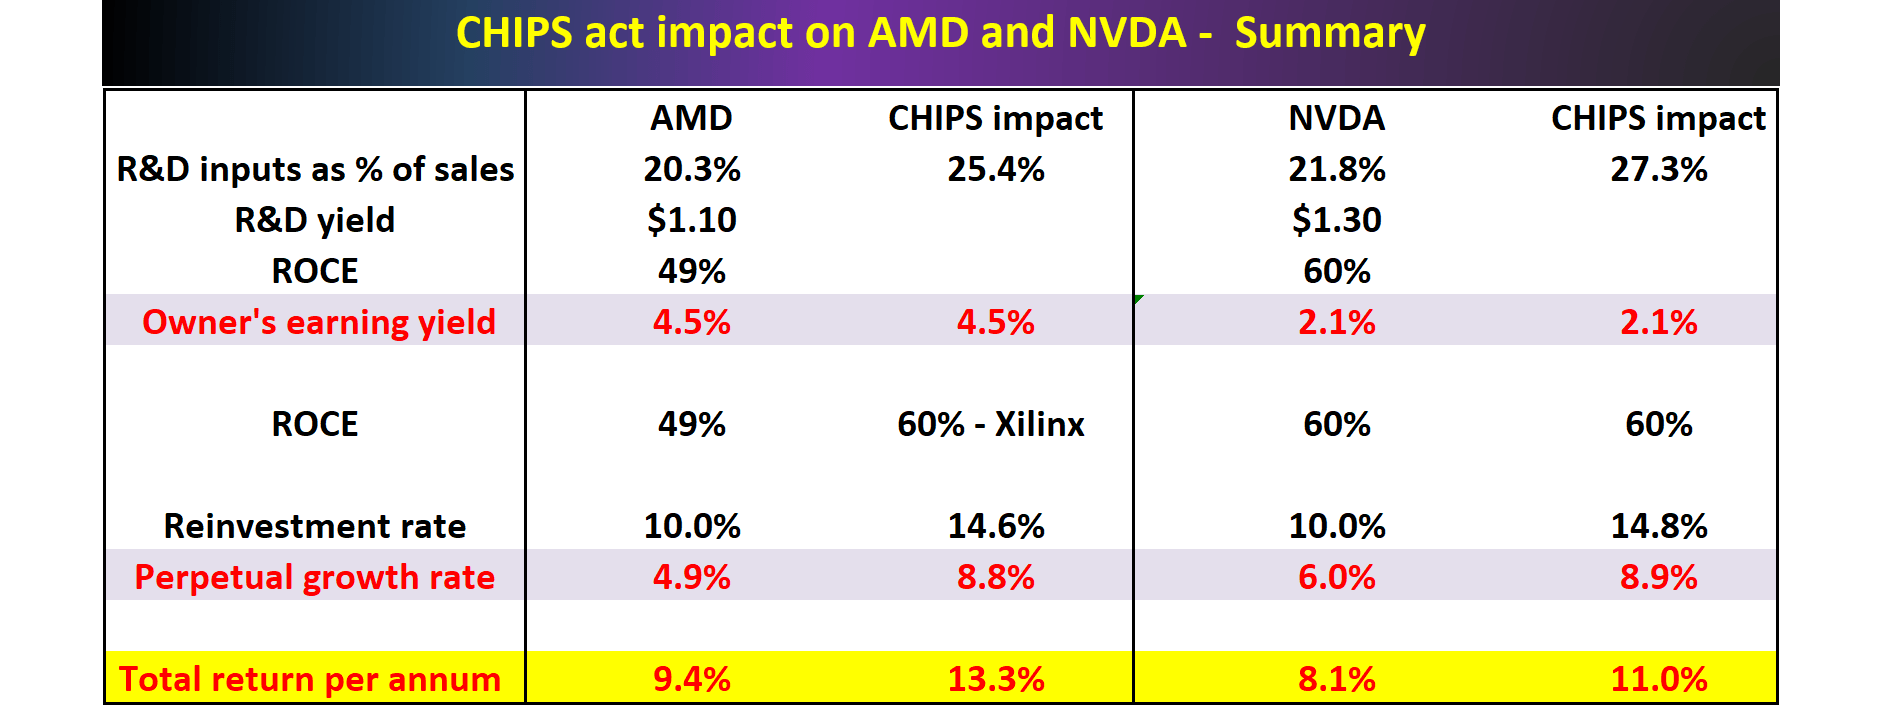
Final thoughts and risks
The Q2 ER from AMD has not had time to factor in the impact of the recently passed CHIPS Act. And I would pay special attention to comments in this area during the incoming earnings calls from NVDA.
My view is that any positive comments on the CHIPS Act could trigger a sizable upward movement as the negatives from its preliminary result announcement have been fully digested by the market already. And moreover, I see plenty of potential for positive comments due to the CHIPS Act. The act could boost the reinvestment rates by a significant amount and thusly leads to higher growth rates (or higher earnings, or both) in the years or even decades to come.
Finally, risks. Readers familiar with our recent writings on AMD and NVDA know that we prefer AMD better for two reasons. First and foremost, our view is that the valuation bubble in AMD is more thoroughly deflated than in NVDA. And secondly, we see NVDA’s exposure to crypto mining as a wild card, adding uncertainties that are completely random and difficult to anticipate. Although both face many of the same macroscopic risks, there is a non-negligible chance of a recession in the near future. Leading firms like Tesla, Ford, and Meta Platforms have all reported hiring freezes or even layoffs recently, which could soften the demand for chips for both of them in key areas such as EVs and servers. Both also have very likely overexpanded in recent years as you can see from the following chart, especially NVDA. Its total headcounts have almost doubled over the past five years from below 120K to the current level of 22.4K. Especially since 2020, it has hired and expanded very aggressively. Even with a recession, they probably both have some overcapacity that will take time to process.
Seeking Alpha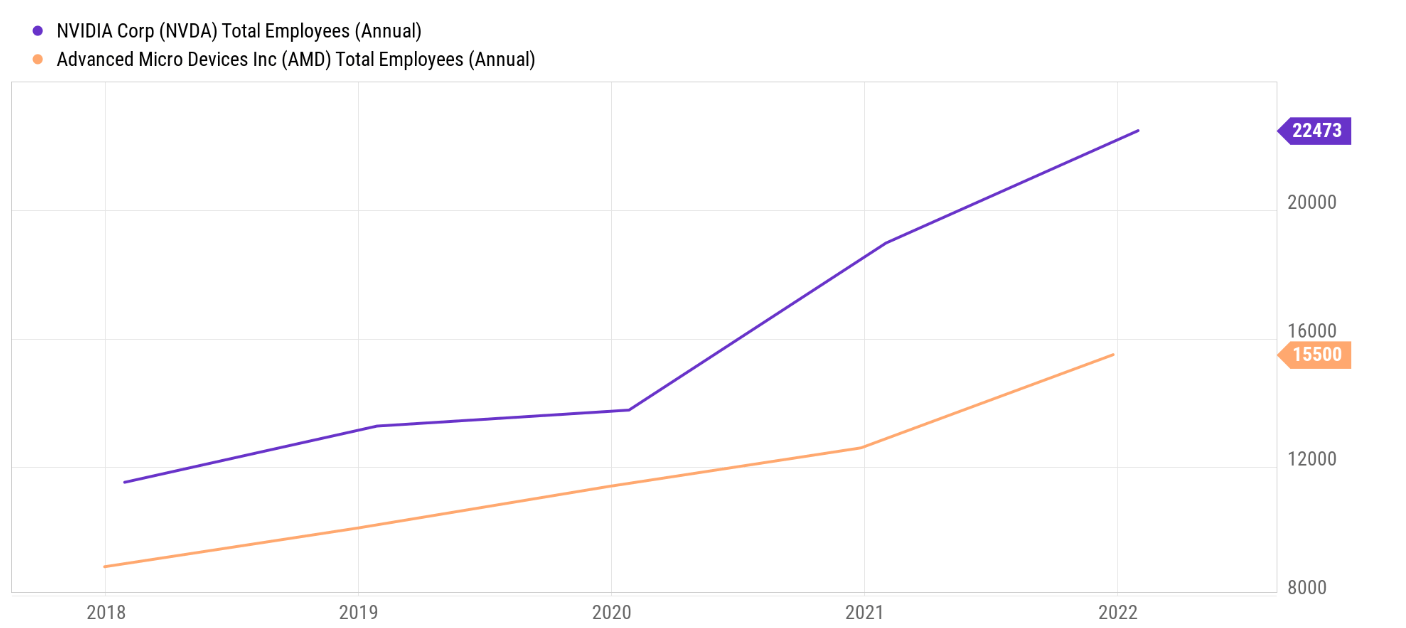
Be the first to comment