

bjdlzx
A guest post by Ovi.
All of the oil (C + C) production data for the US state charts comes from the EIAʼs Petroleum Supply monthly PSM.
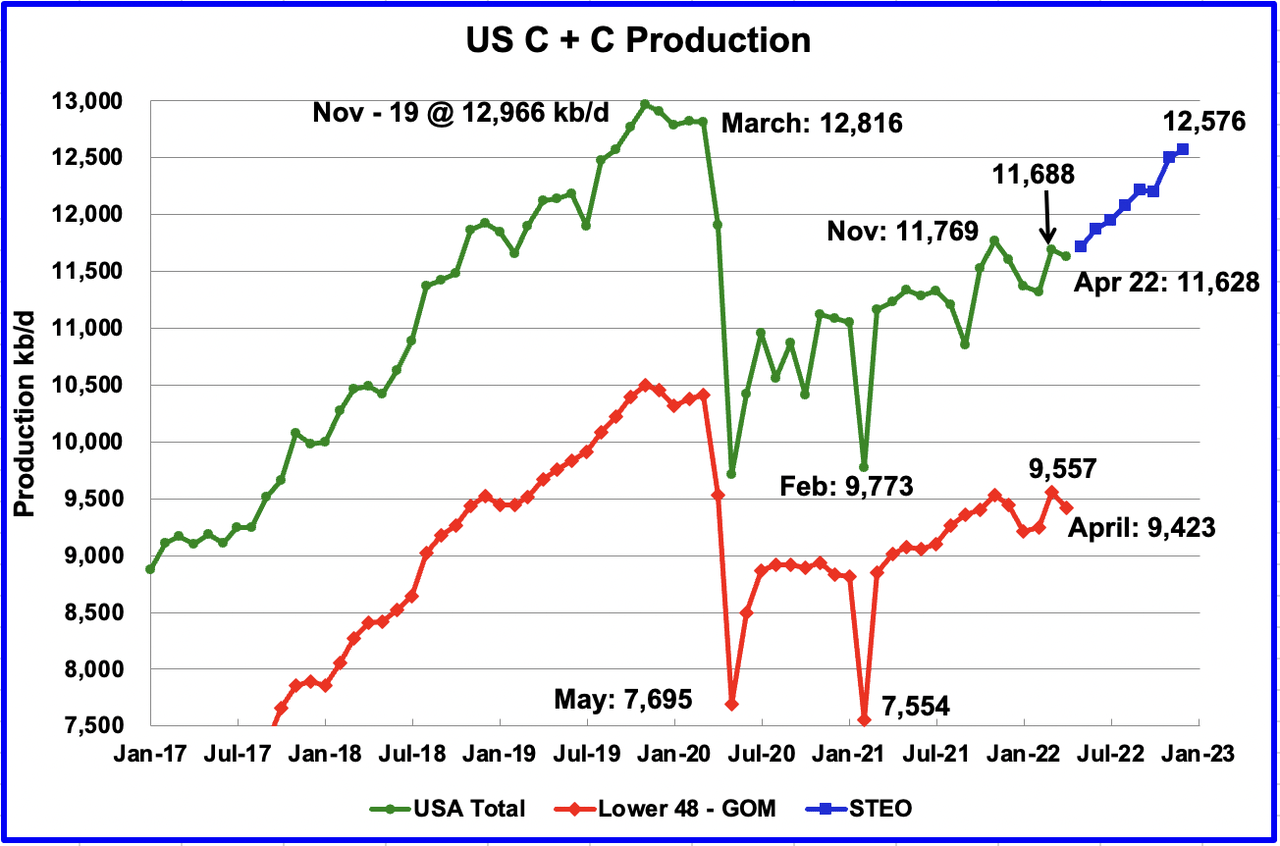
U.S. April production decreased by 60 kb/d to 11,628 kb/d, after March was revised up from 11,655 kb/d to 11,688 kb/d. The largest production increase came from the GOM while North Dakota dropped by 214 kb/d.
While overall US production was down, a clearer indication of the health of US onshore oil production can be gleaned by looking more closely at the On-shore L48 states. In the On-shore lower 48, April production decreased by 134 kb/d to 9,423 kb/d.
The blue graph, taken from the June 2022 STEO, is the production forecast for the US from May 2022 to December 2022. Output for December 2022 is expected to be 12,576 kb/d, a revision of 108 kb/d higher than was forecast in the May STEO report. From May 2022 to December 2022, production is expected to increase by 863 kb/d or at an average rate of 123.3 kb/d/mth.
It should be noted that the STEO did forecast a decline of 137 kb/d for April.
Oil Production Ranked by State
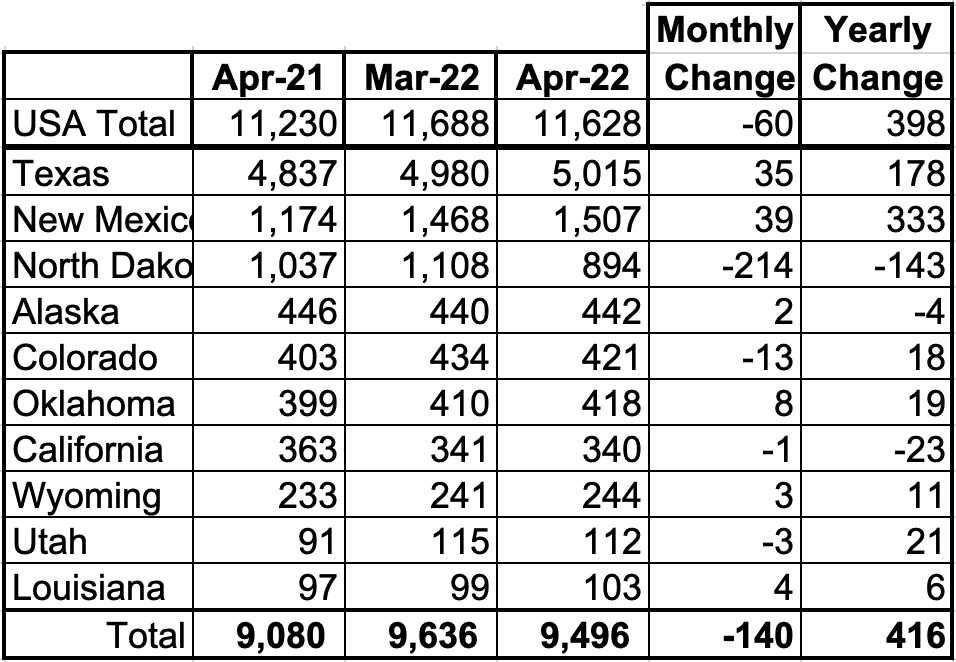
Listed above are the 10 states with the largest US production. These 10 accounted for 81.7% of all US oil production out of a total production of 11,628 kb/d in April 2022.
On a YoY basis, US production increased by 416 kb/d with the majority having come from New Mexico.
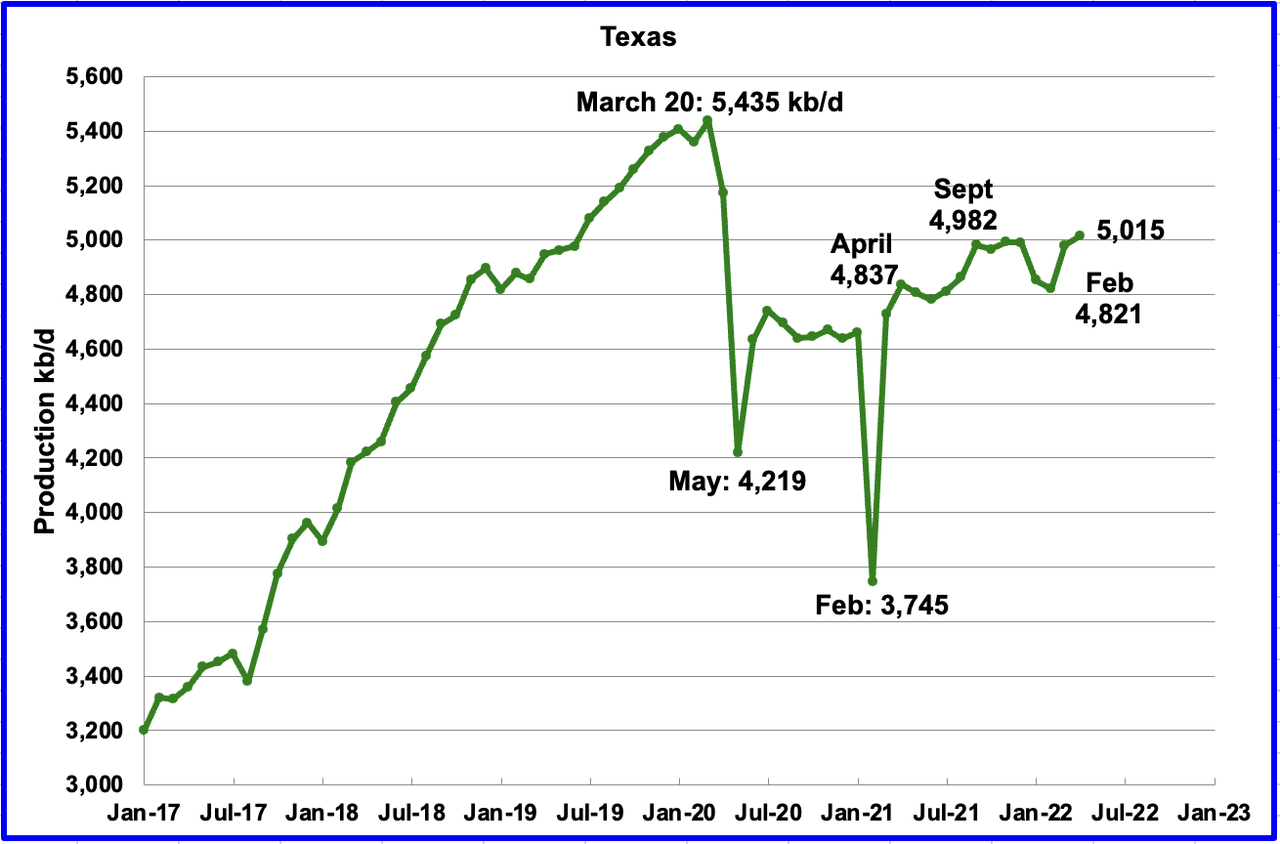
Texas production increased by 35 kb/d in April to 5,015 kb/d from 4,980 kb/d in March.
In September 2021 there were 204 Hz oil rigs operating in Texas. By the last week of April 2022, 293 oil rigs were operating, an increase of 89 rigs and production just increased by 33 kb/d.
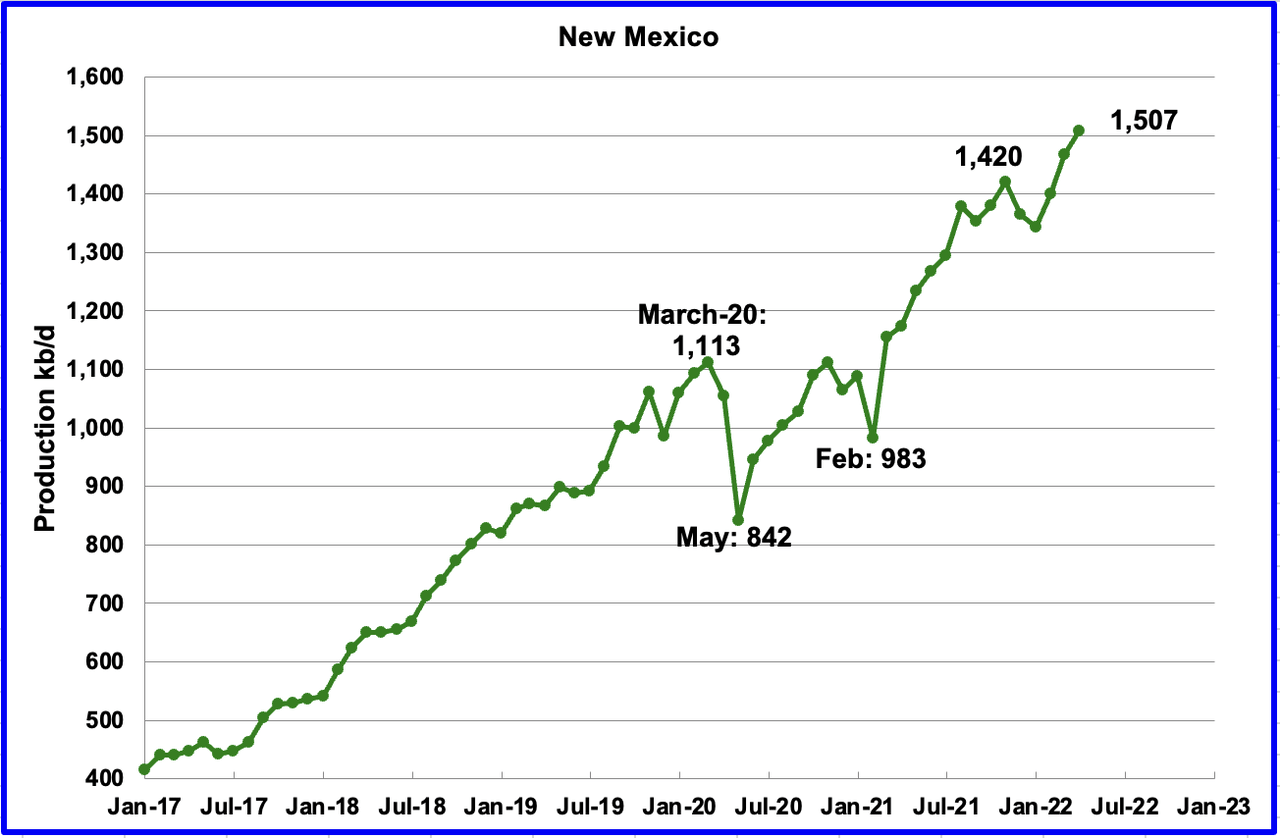
April’s New Mexico production increased by 39 kb/d to another record 1,507 kb/d. Through December 2021 to the end of April, close to 90 rigs have been in operation in the New Mexico Permian. However, in June, operational rigs exceeded 100. The recent production increase is due to more wells being completed than drilled.
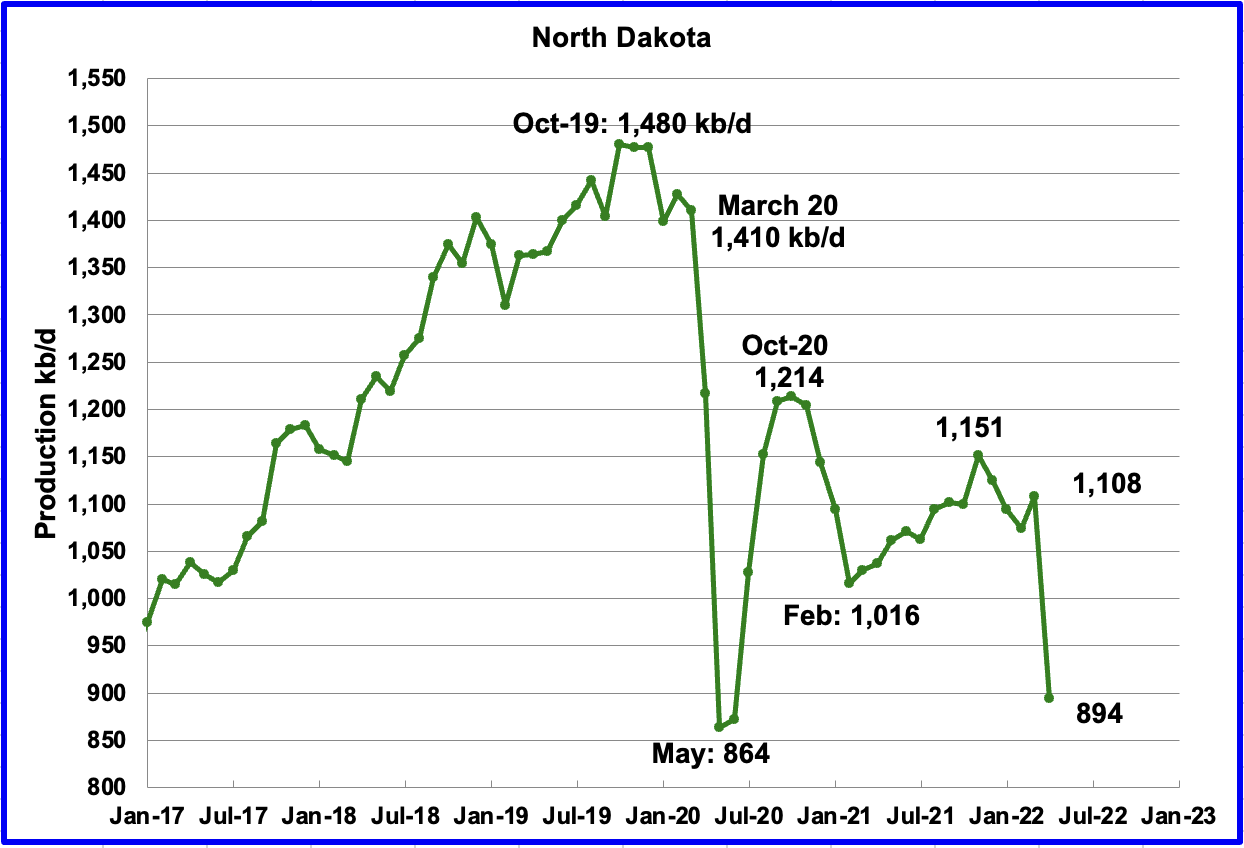
North Dakota’s April output was 894 kb/d, a decrease of 214 kb/d from March. According to this source, the drop was due to a severe cold winter storm.
“Back-to-back blizzards in April led to significant drops in energy production. Helms says the industry is only now just starting to recover from the blizzards, meaning production numbers in May won’t see much change.”
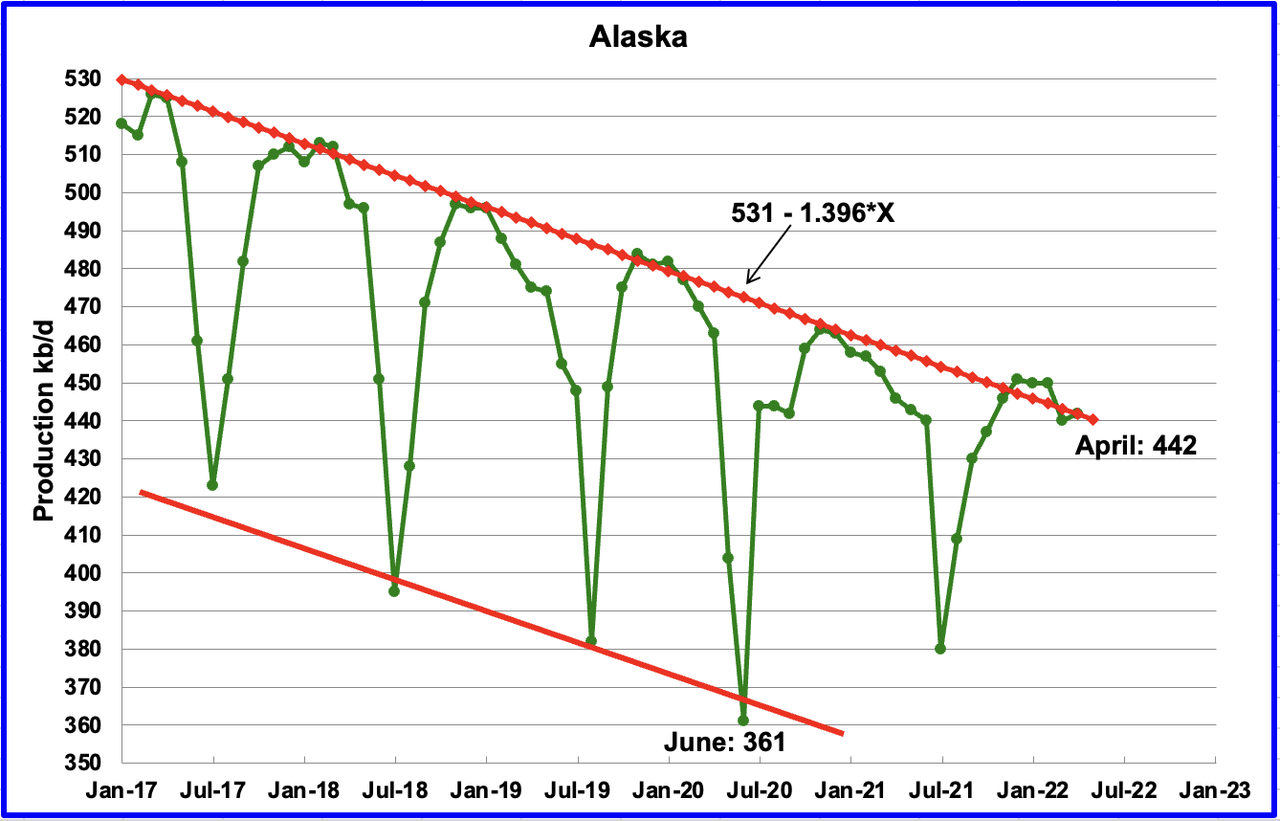
Alaskaʼs April output increased by 2 kb/d to 442 kb/d.
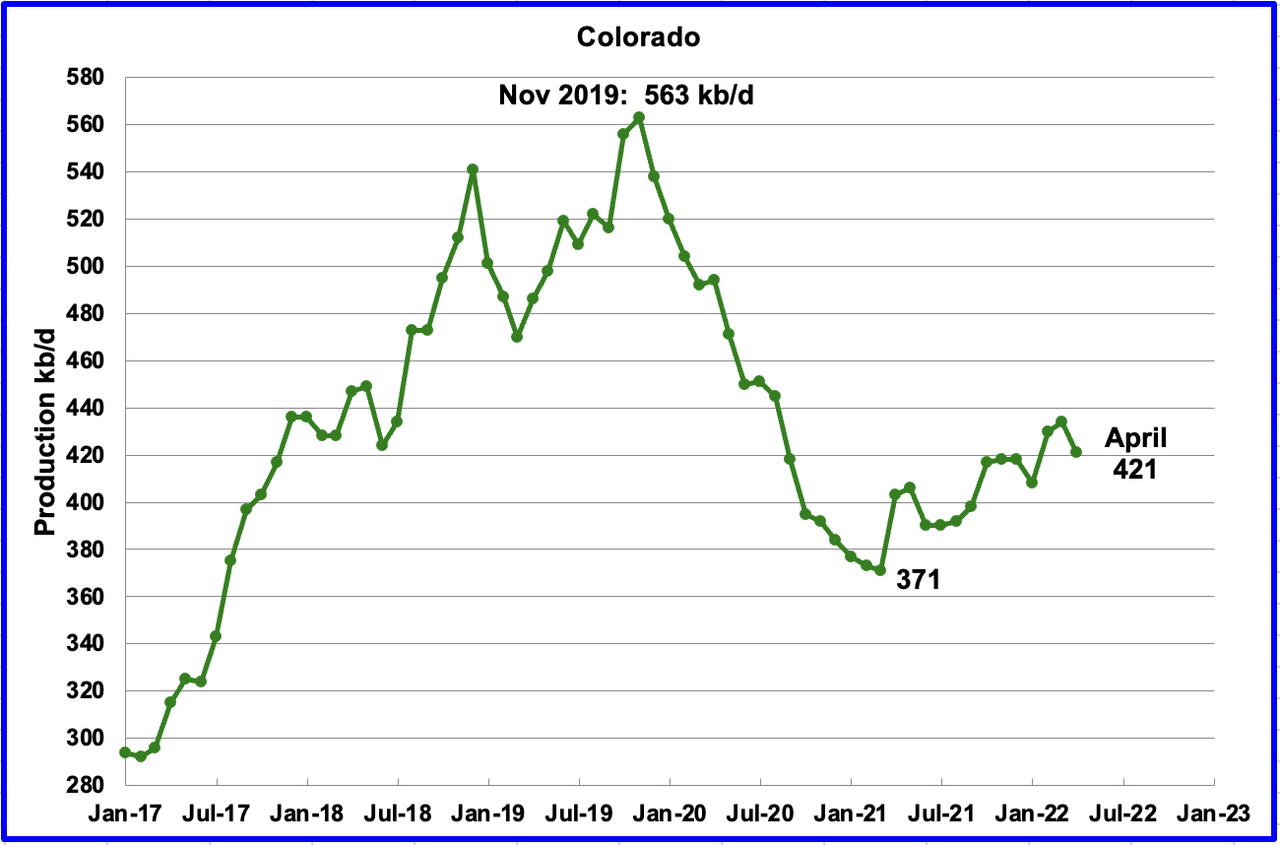
Coloradoʼs April production decreased by 13 kb/d to 421 kb/d. A recent Colorado report estimates little growth likely in Colorado for 2022.
“Oil and gas drilling activity has inched upwards in Colorado since the Russian invasion of Ukraine sent prices soaring earlier this year, but investor demands and supply constraints – not state or federal policy – will likely limit production growth through at least the end of the year,” a new Colorado School of Mines analysis concludes.
The quarterly report on oil and gas markets from the school’s Payne Institute for Public Policy found that little has changed since the weeks following Russia’s invasion, when multiple large producers operating in Colorado assured Wall Street investors they would use high oil prices to increase dividends and stock buybacks, not expand production.
“The top priority for the U.S. public oil and gas companies remains to deliver higher financial returns to shareholders,” read the report released last week.
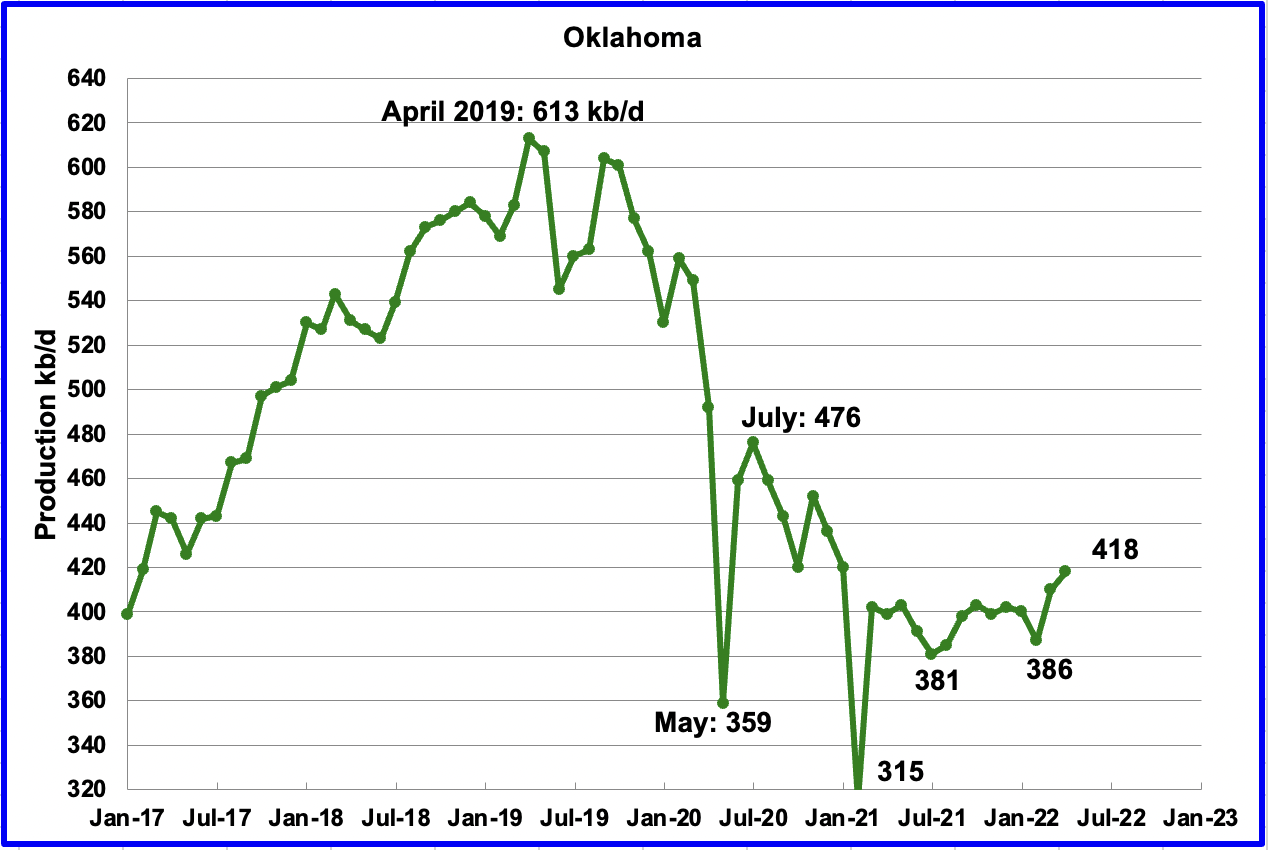
Oklahoma’s output in April increased by 8 kb/d to 418 kb/d. April’s output broke out above the 400 kb/d level it has been struggling with since September 2021. From January to April, close to fifty rigs have been operating in Oklahoma.
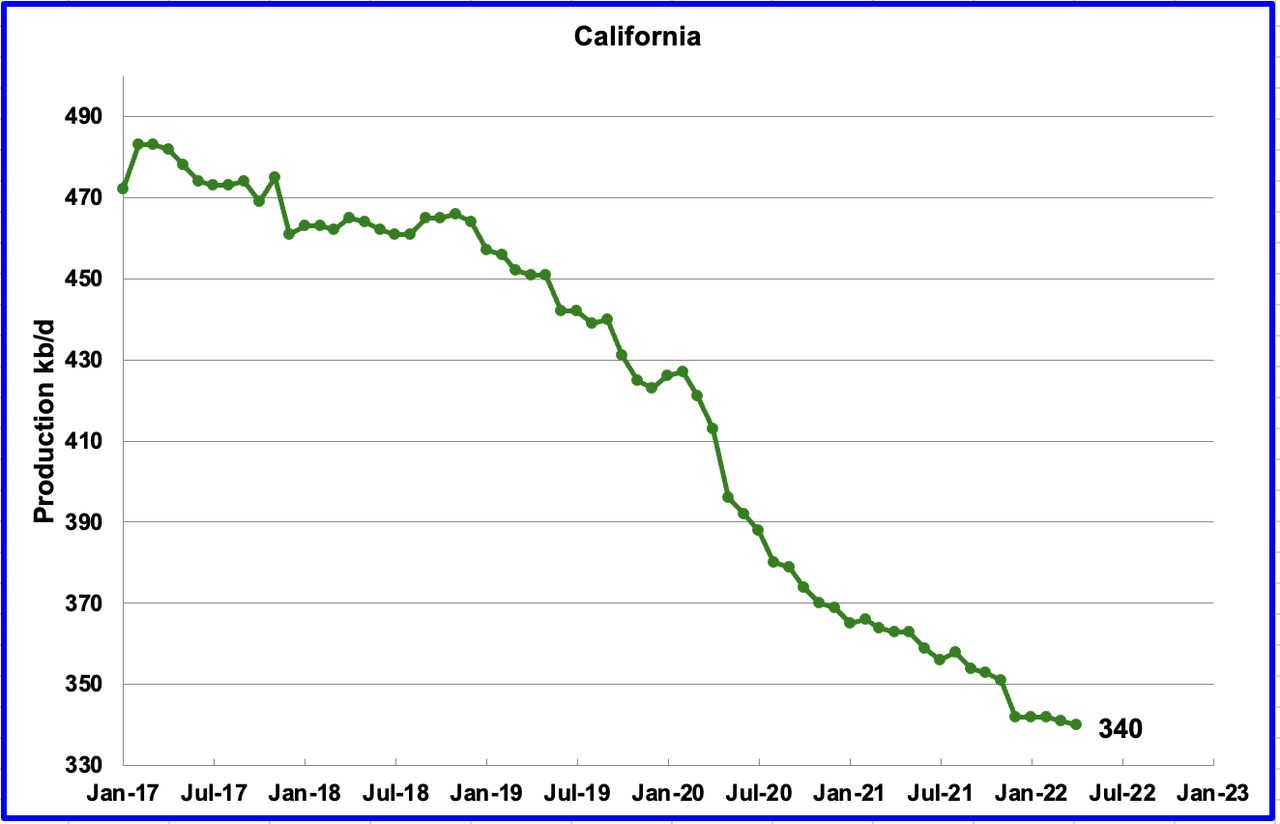
Californiaʼs slow output decline continued in April. Output decreased by 1 kb/d to 340 kb/d.
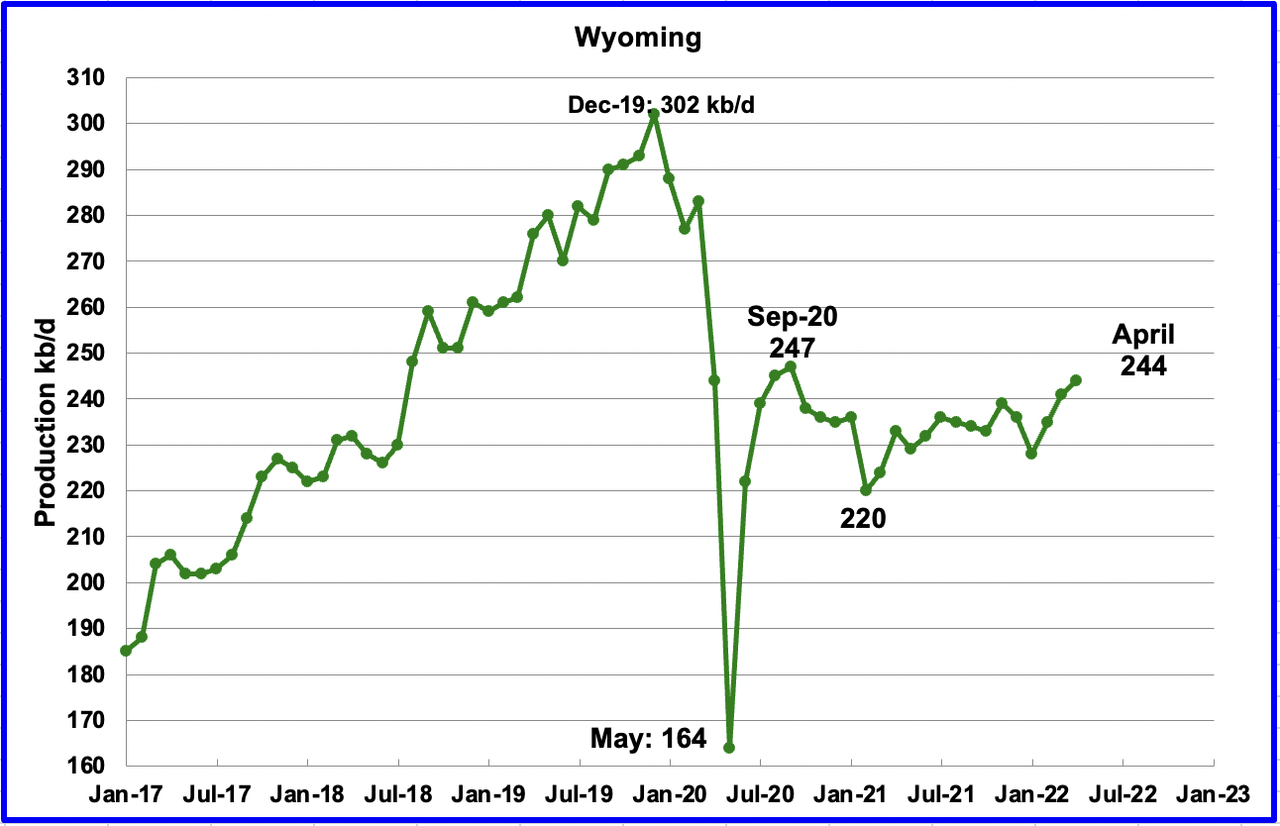
Recent revisions to Wyoming’s oil production by the EIA show that it has been on an uptrend from the low of 220 kb/d in February 2021. According to this source, the increase is related to increased drilling.
“Pete Obermueller, president of the Petroleum Association of Wyoming, told the Joint Minerals, Business and Economic Development Committee on Monday that the state’s drilling rig count is slowly increasing and reached 21 this week. (Baker Hughes, which tracks rigs differently, reported Friday that Wyoming had 18.)
The current rig count “obviously is better,” Obermueller said. “Still not where we’d like to be, but we’re moving in the right direction.”
In April, Wyoming’s output increased by 3 kb/d to 244 kb/d, up 24 kb/d from February’s 2021 output of 220 kb/d.
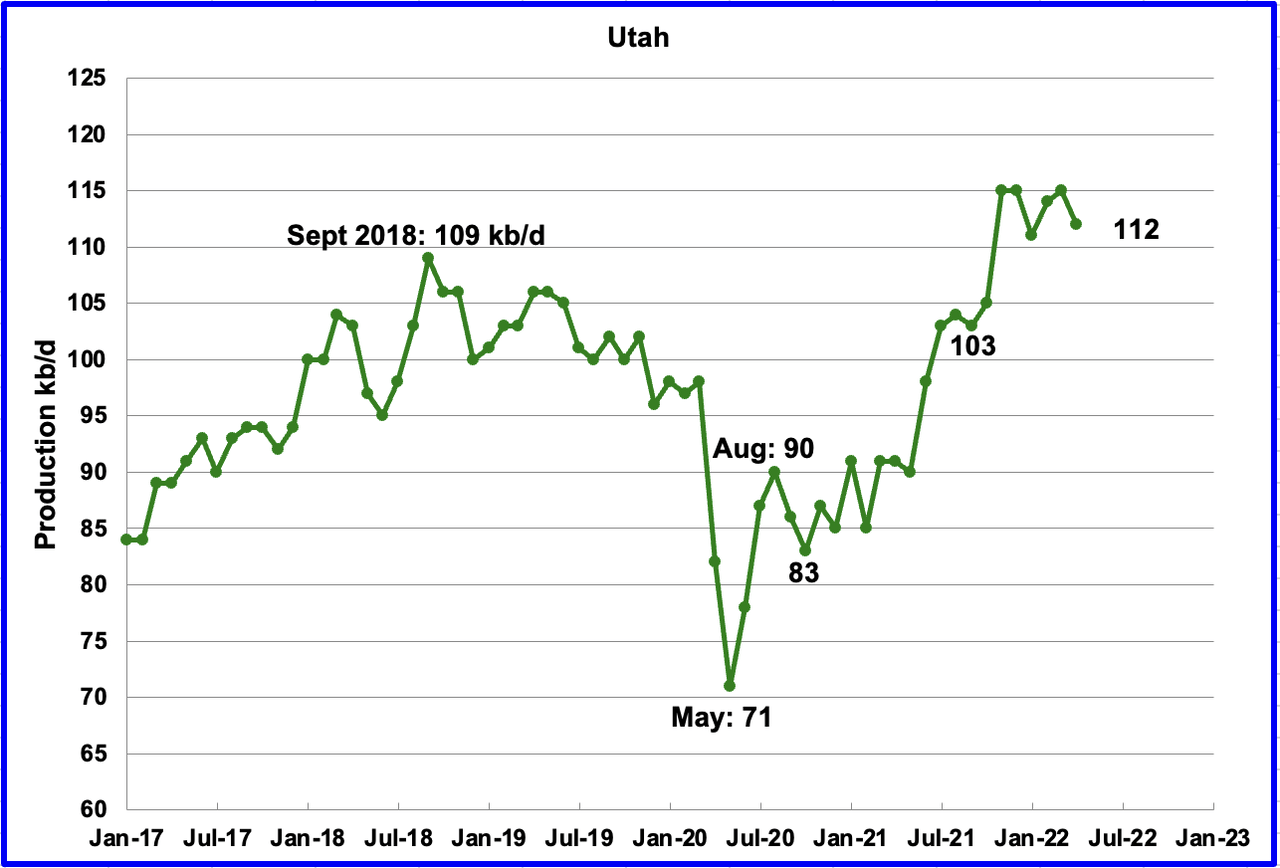
Utah’s production increase from the low of 71 kb/d in May 2020 appears to have stopped in December 2021. April’s production decreased by 3 kb/d to 112 kb/d.
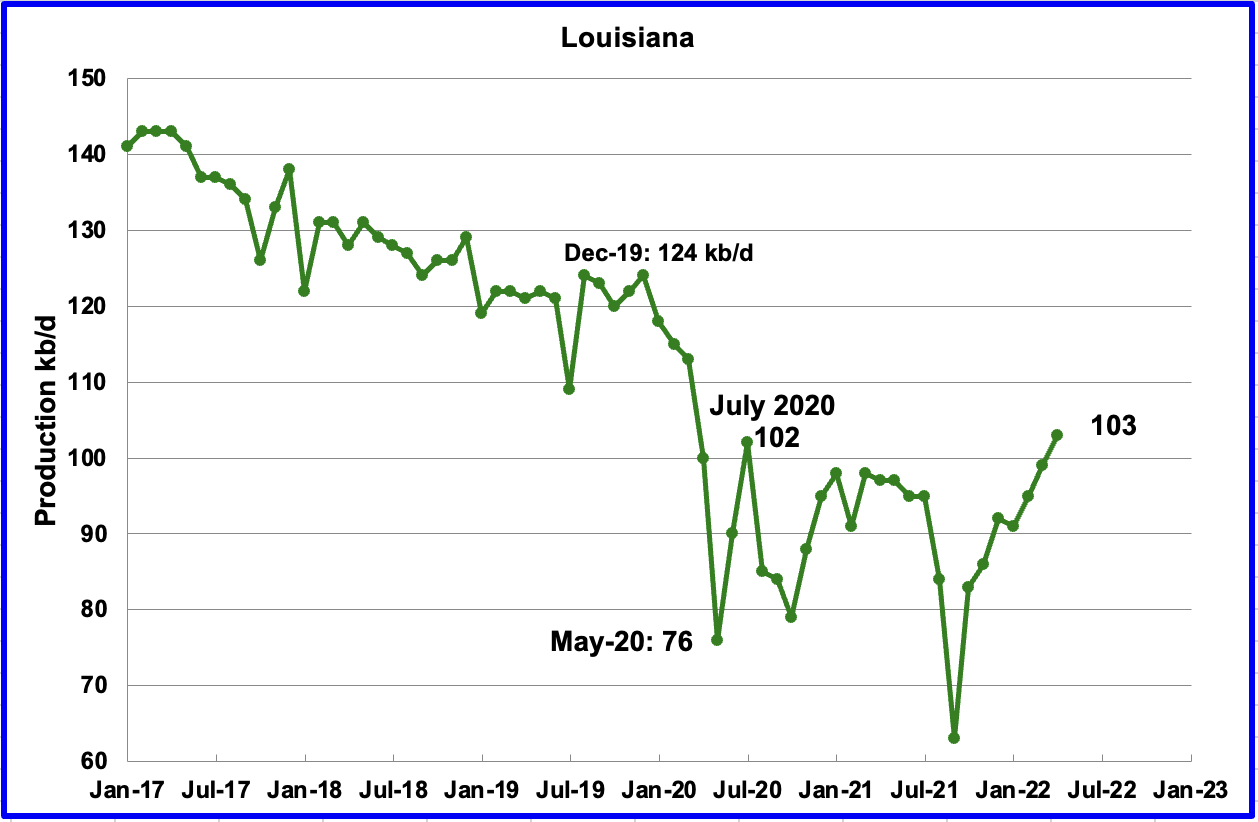
Louisiana’s output increased by 4 kb/d to 103 kb/d in April. Louisiana, one of the hardest hit states by Hurricane Ida in late August 2021, seems to have fully recovered from the inflicted damage since production has increased every month since then.
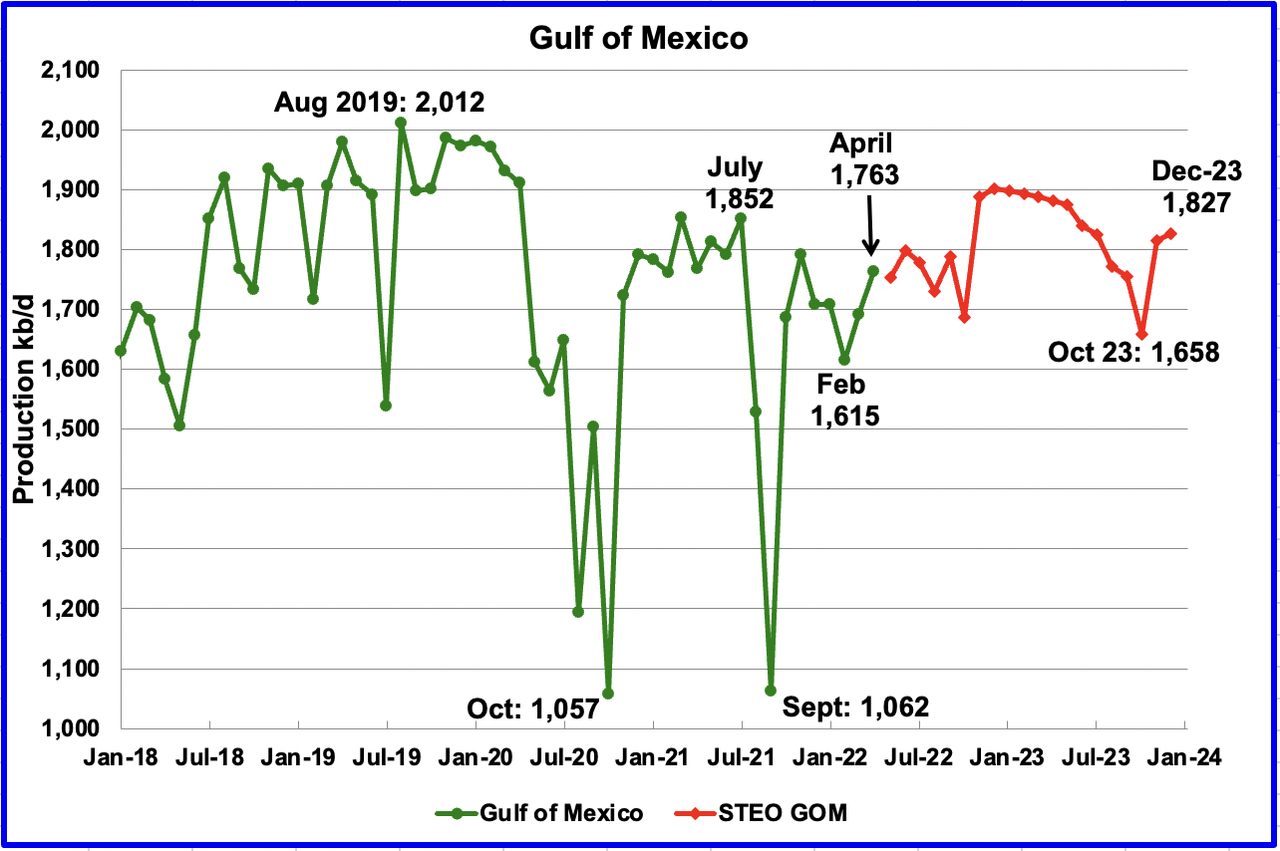
GOM production increased by 72 kb/d to 1,763 kb/d in April. If the GOM was a state, its production would normally rank second behind Texas.
The June 2022 STEO projection for the GOM output has been added to this chart and projects output will be 1,827 kb/d in December 2023. This is 29 kb/d higher than projected in the May report. For May 2022, the STEO is projecting little change in output.
The increase in the GOM output near year-end is due to Shell’s Vito platform coming online.
Vito is expected to come online prior to year-end. The project as sanctioned calls for delivery of a peak 100,000 BOPD via eight subsea production wells tied into a single manifold. However, a second chapter to the Vito story is already well underway.
In order to capture all it can of the expected 300 million bbl of reserves at the field, Shell is planning a waterflood project for Vito that should take final investment decision (FID) roughly a year after the field comes on stream. The water flood not only calls for additional topsides equipment to be squeezed onboard the smaller host, but three additional wells are also planned. The current plan has these wells being initially used as producers before being converted to water injectors, according to Stacy Fresquez, Shell’s Vito waterflood project manager.
A Different Perspective On US Oil Production
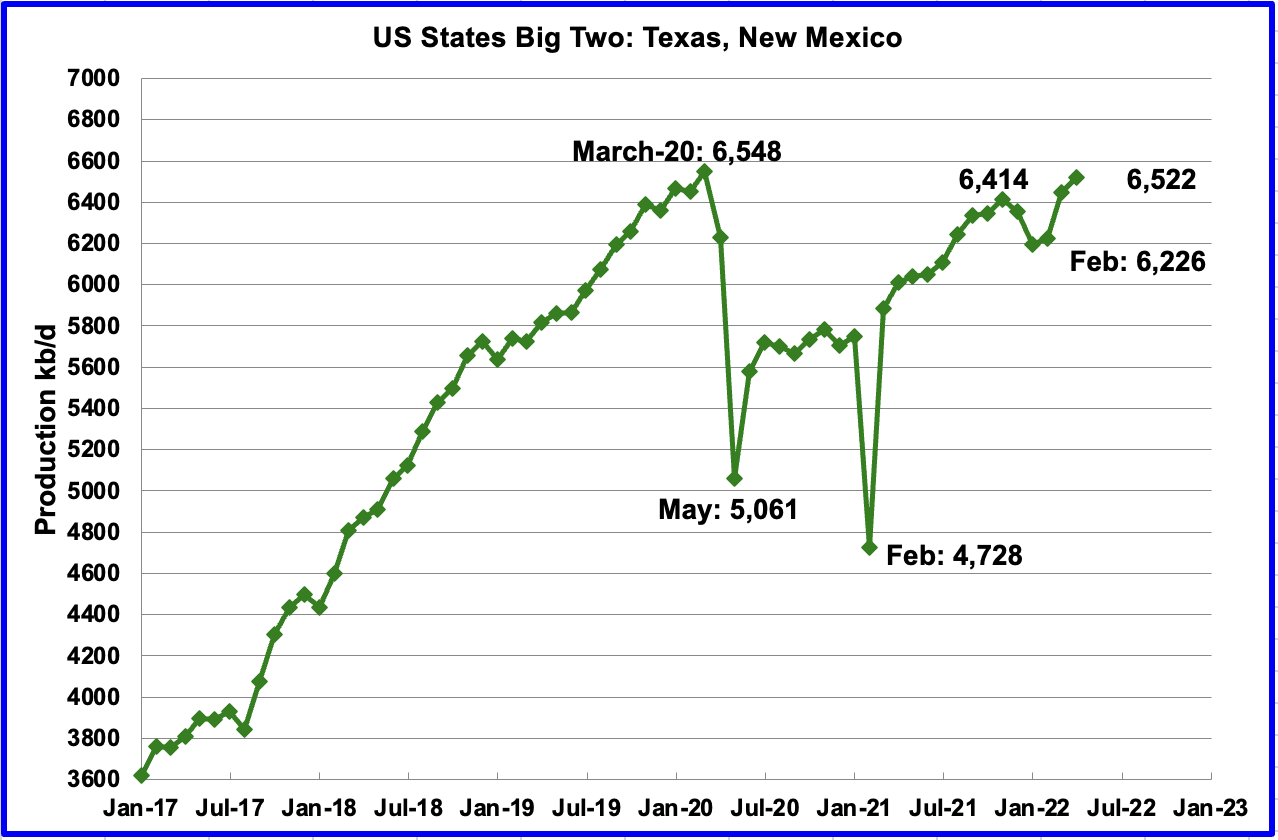
The Big Two states, combined oil output for Texas and New Mexico.
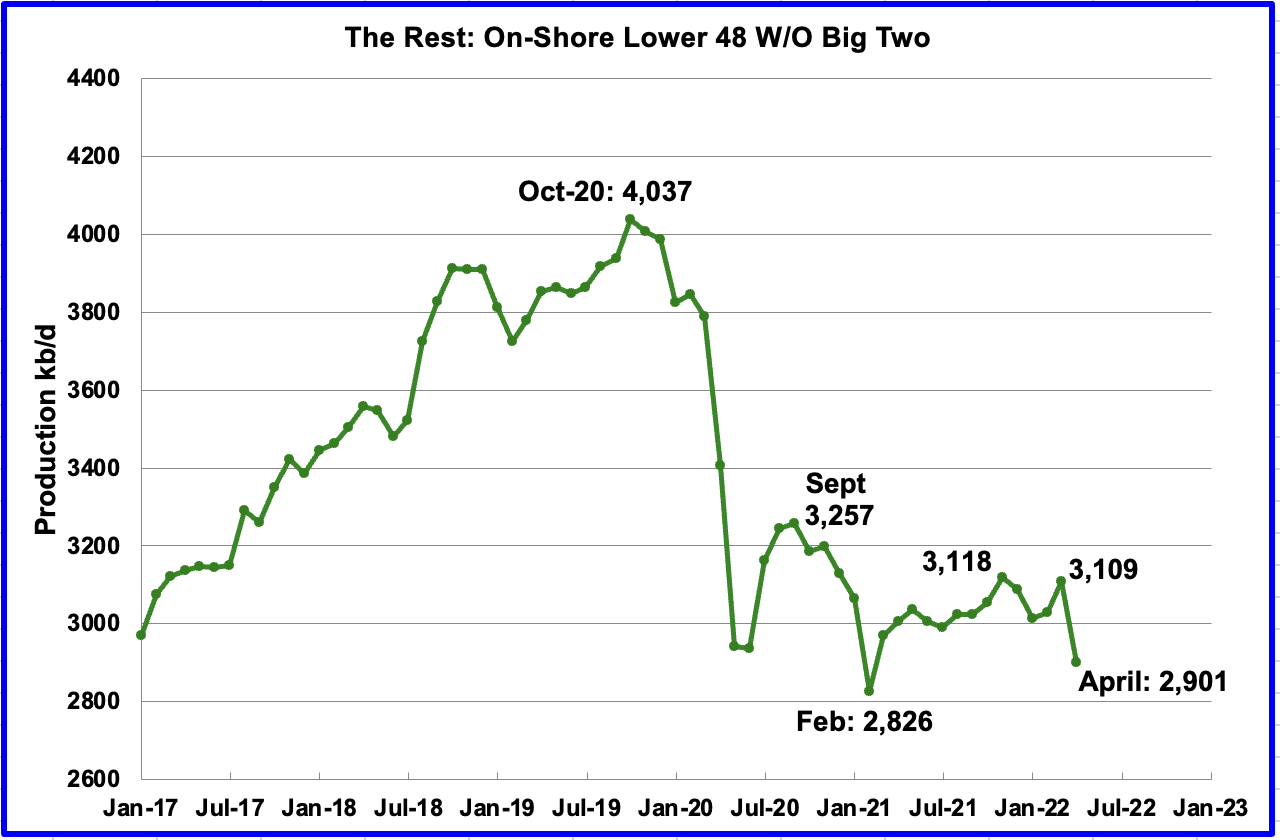
Oil production for The Rest
To get a different perspective on US oil production, the above two charts have segregated US state production into two groups, “The Big Two” and the “On-Shore L48 W/O Big Two” or The Rest.
April production increased in the Big Two states by a combined 74 kb/d, with Texas adding 35 kb/d and New Mexico adding 39 kb/d.
Over the past year, production in the Rest appears to be holding steady at close to 3,000 kb/d. However, in April production decreased by 208 kb/d to 2,901 kb/d primarily due to the 214 kb/d decrease in North Dakota.
Frac Spreads
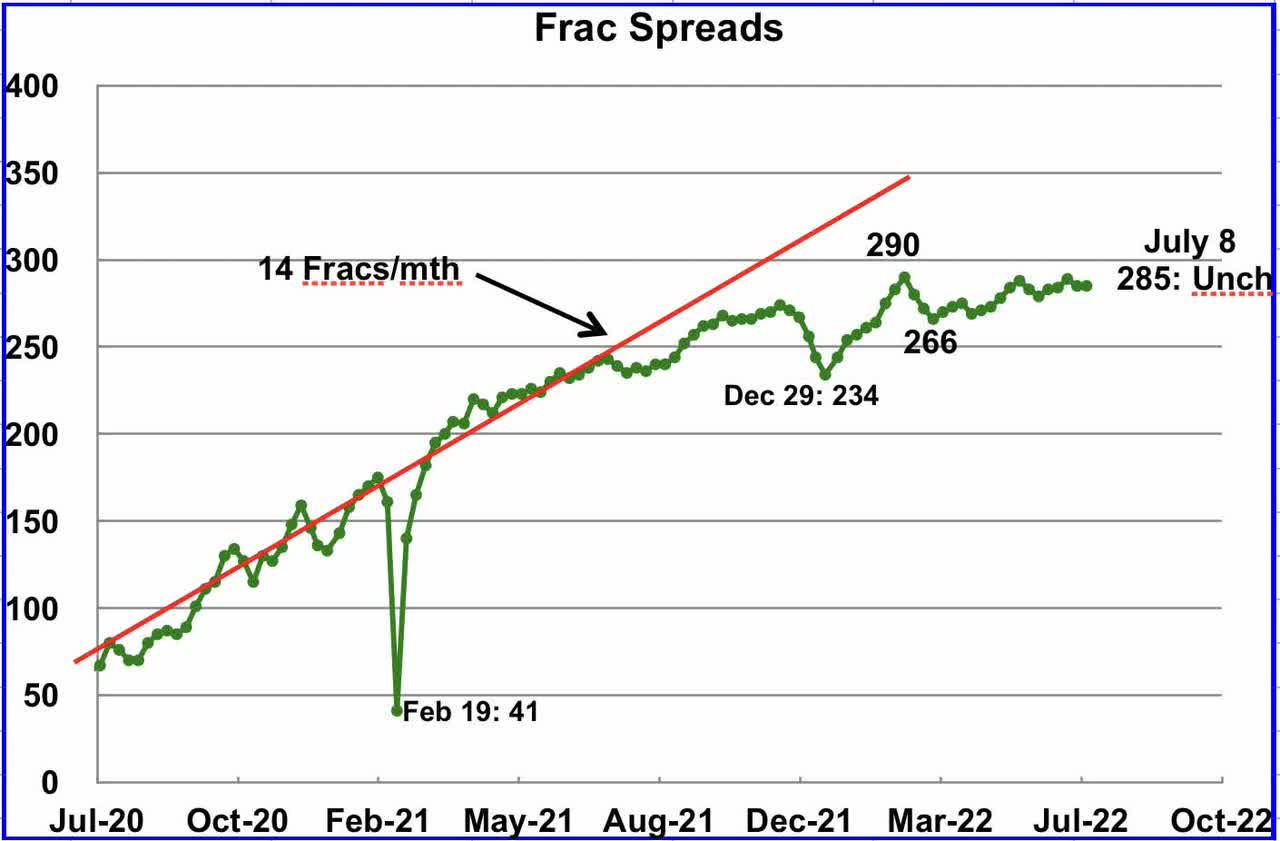
Frac spreads were unchanged at 285 for the week ending July 285. Frac spreads typically do not change much on the week following a long weekend.
Note that these 285 frac spreads include both gas and oil spreads.
The oil rig count for the week ending July 4 increased by 2.
LTO May Update
The EIA’s LTO database provides information on LTO production from seven tight oil basins and a few smaller ones. The June 2022 report updates tight oil production to May 2022.
Due to technical difficulties, the EIA just released the June LTO report on July 8, 2022.
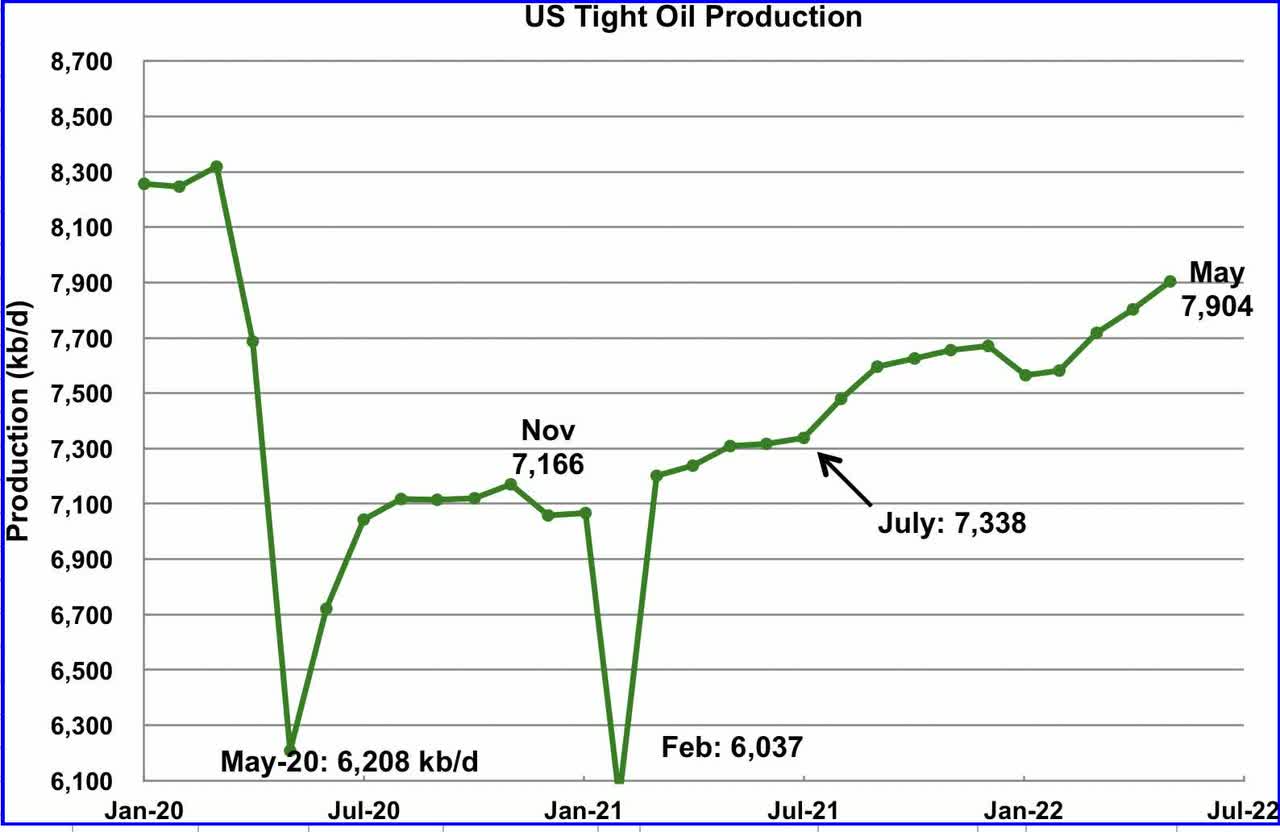
The EIA’s June LTO report made upward revisions to the May production forecasts reported in the previous post. The biggest revision in output occurred in the Permian from January to April 2022 in the order of 100 kb/d.
May’s LTO output increased by 101 kb/d to 7,904 kb/d. April’s output was revised up by 98 kb/d.
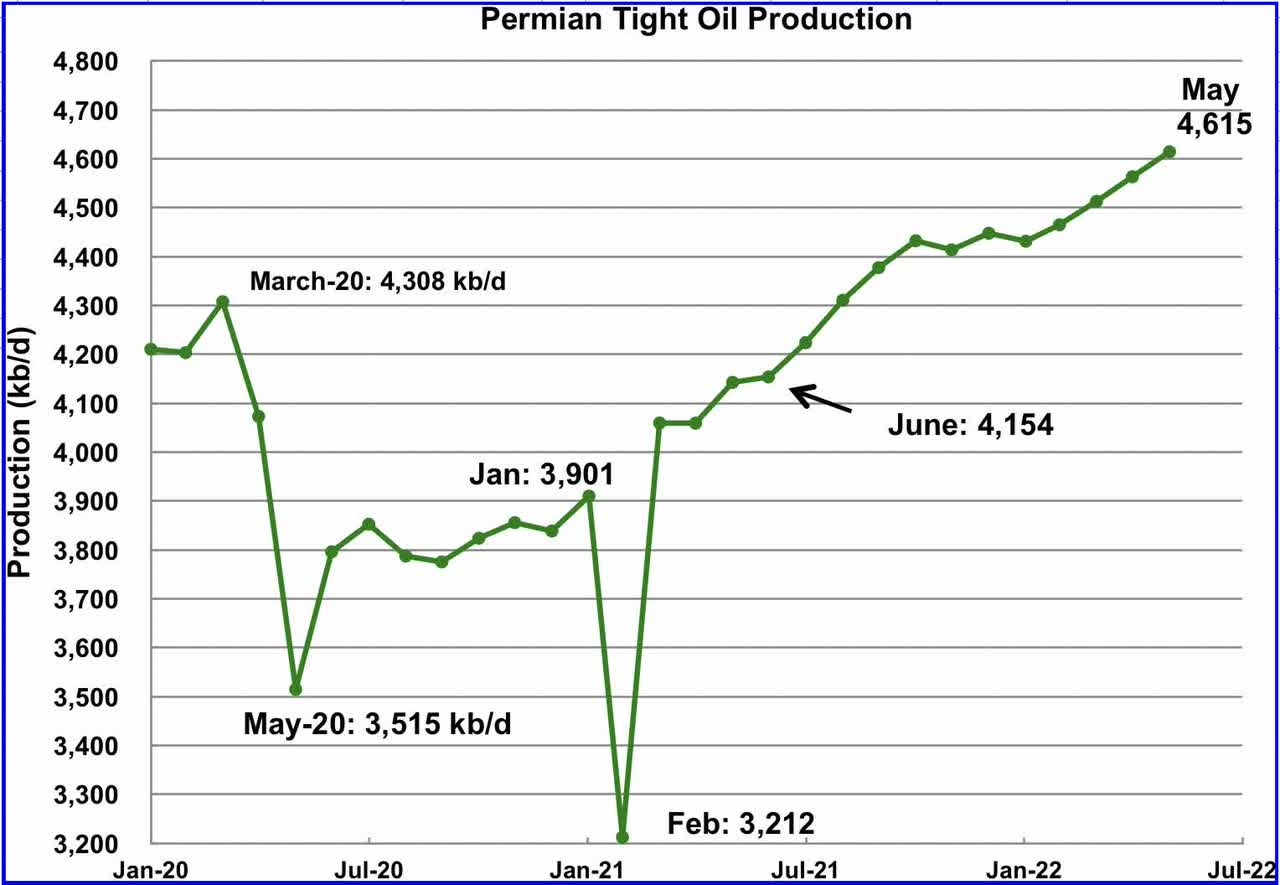
May’s output increased by 52 kb/d to 4,615 kb/d and is 307 kb/d higher than the high of 4,308 kb/d recorded in March 2020. April’s output was revised up by 92 kb/d.
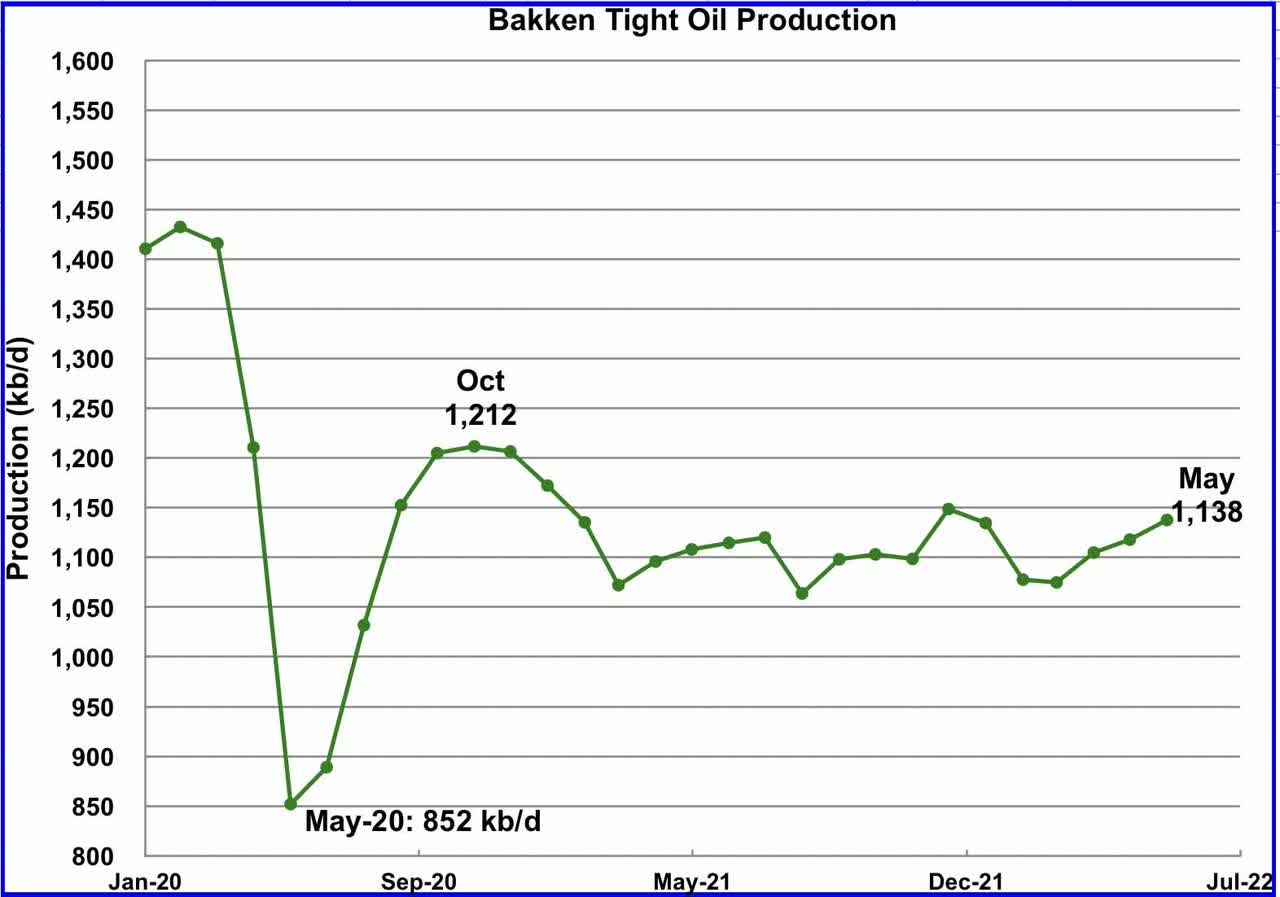
The Bakken’s May LTO output increased by 20 kb/d to 1,138 kb/d. Note the EIA reported a drop of 214 kb/d in April for North Dakota in the production charts above. Will the April drop show up in the July report?
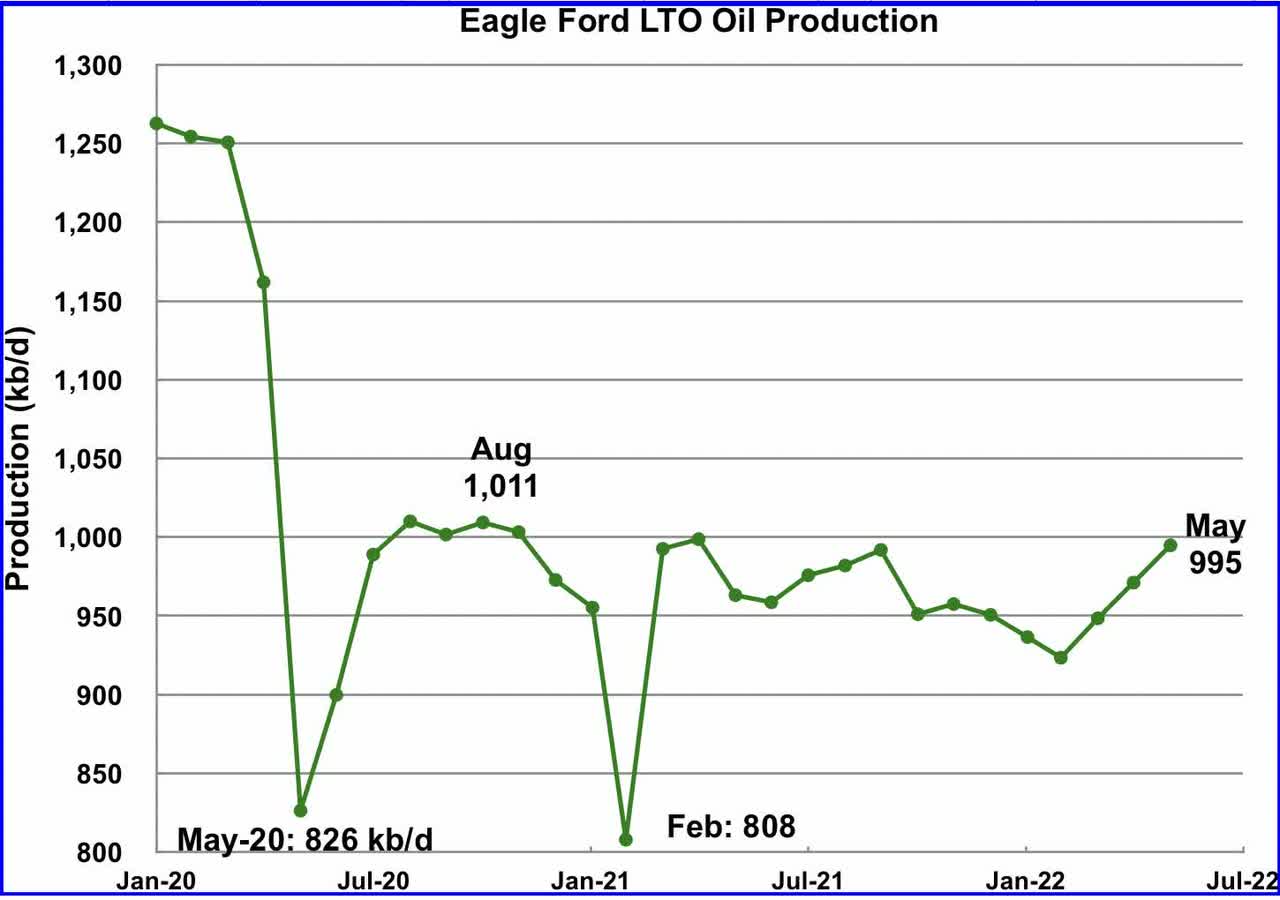
The Eagle Ford basin production increased by 24 kb/d to 995 kb/d in May.
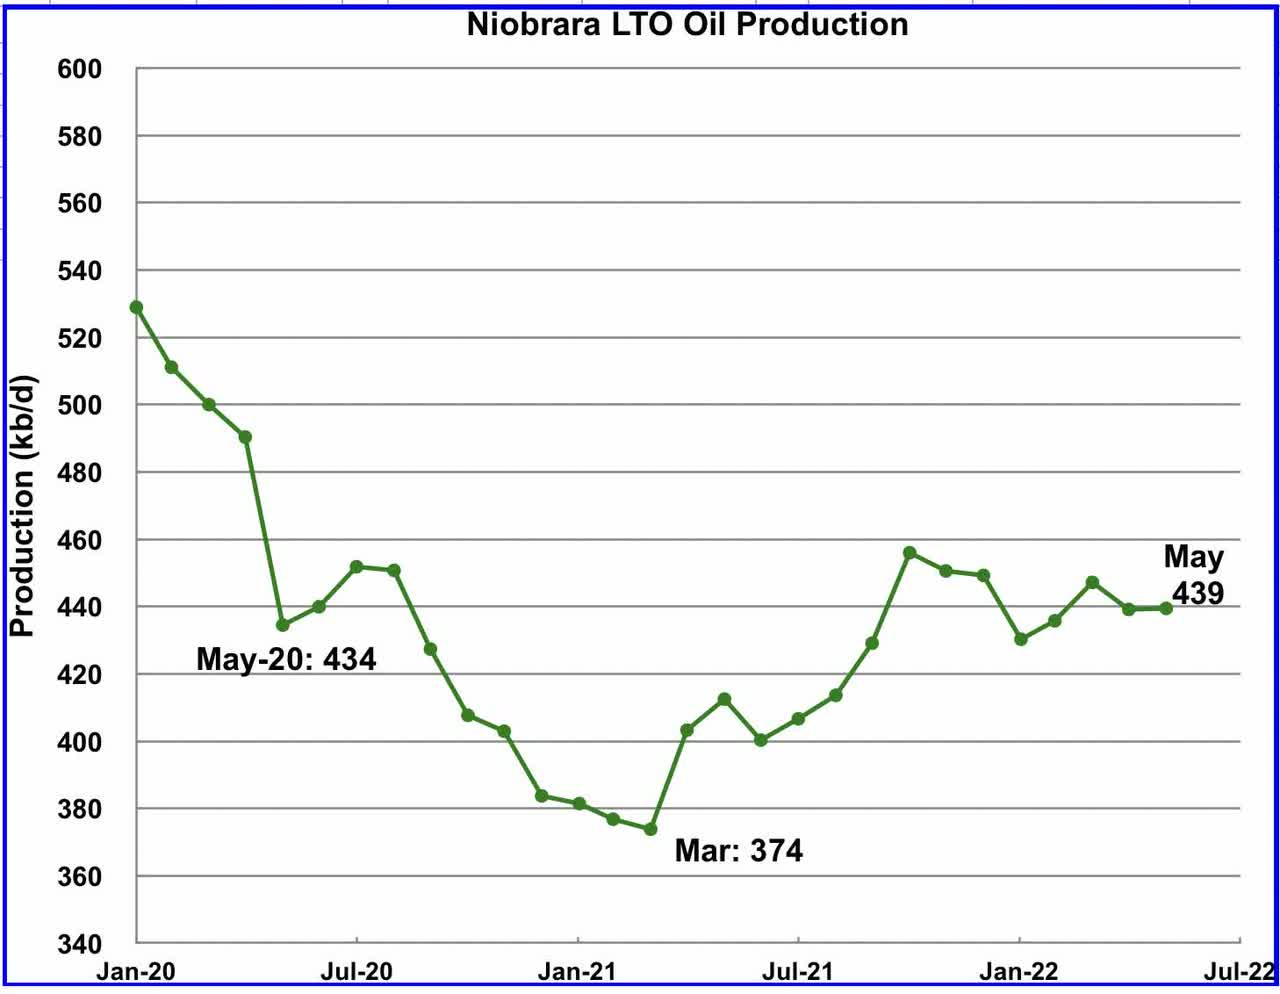
After increasing production from March 2021 to October 2021, output in the Niobrara began to drop in November 2021. May’s output was unchanged at 439 kb/d.
Editor’s Note: The summary bullets for this article were chosen by Seeking Alpha editors.
Be the first to comment