

Luke Sharrett
Since I put out my latest cautious note on Norfolk Southern Corporation (NYSE:NYSE:NSC), the shares are up about 11.8% against a gain of 10.6% for the S&P 500. Since the company has posted results since, I thought it’d be worthwhile to revisit the name to see if it’s time to throw in the towel and actually buy the stock that’s clearly done well recently. I’ll make this determination by reviewing the most recent financial performance, and by looking at the valuation. I determined in a previous article that an investor can receive much more cash from the 10-year Treasury Note, so I’m going to keep that comparison in the back of my mind as I go through this analysis.
It’s time again for the “thesis statement” paragraph. This short synopsis is for the benefit of people who ignore titles, and bullet points, and who jump to the second paragraph of an article, and who want spoilers because they can’t stomach the prospect of wading through an entire article of mine. I don’t know how big that crowd of bullet point avoiders is, but I can imagine that there are many out there who don’t want to tolerate my bragging and various other odious traits. I will continue to avoid Norfolk Southern. The shares are between 7%-14% more expensive today, and that’s troublesome in light of the fact that earnings have only grown by about 2% over the past year. The company has increased indebtedness by about ⅓ (!) over the past three years, and much of that has gone to share buybacks. I think management overpaid for these recently, so I consider this to be a failure. Most troubling of all is the fact that the shares are near multi-year high valuations in spite of the headwinds we’re seeing, ranging from labor problems to input inflation.
Financial Snapshot
The most recent financial result was in many ways quite good in my estimation. For example, over the first two quarters of 2022, revenue was about 13.4% higher than it was during the same period in 2021. Net income growth was much more muted, at only about 2%. This disappointing income growth was largely a function of fuel and materials expense increases, which were up by 94.25%, and 38.3% respectively. We may see more cost increases of this nature on the horizon. Against this backdrop, management saw fit to increase dividends by about 13.75%.
You may recall that the world suffered a global pandemic recently, and it had a significantly negative impact on economic activity among other things. For that reason, I feel a need to compare the most recent financial period to the pre-pandemic world to see to what extent the company has recovered from the pernicious effects of the pandemic. The relevant period of comparison is the first six months of 2019, as that’s the closest pre-pandemic period we have for comparison. When reviewing the income statement, it seems fairly clear that the company has fully recovered from the pandemic. Specifically, revenue and net income are higher by 6.9% and 8.8% respectively. From the vantage point of 2022, it is as if the pandemic never happened to Norfolk Southern.
That written, it’s not all lip whistles and moon pie at Norfolk Southern. The level of indebtedness has grown dramatically over the past few years. In fact, the company has over 31% more long-term debt outstanding now than it did only 3 years ago. The level of debt has increased by 9.75% over the past year. It may be a character flaw of mine, and maybe I’m made of less stern stuff than the captains of industry over at Norfolk Southern, but if my level of indebtedness increased by nearly ⅓ over three years, I’d reevaluate. If interest rates continue to rise, this added indebtedness will likely add to future interest expenses. Hopefully the extra $1.214 billion of extra debt over the past six months was put to good use. That is a great segue for me to write about the recent buyback activity.
The Buyback
If I were an investor in Norfolk Southern I’d be concerned about the rapid increase in the level of indebtedness. In particular, the company took on another $1.214 billion of debt over the past six months alone, which was a 9% increase. While the company was loading up on debt, it spent about $1.454 billion on stock buybacks. Most of this buyback activity, fully $854 million, took place between April 1 and June 30. The company managed to retire exactly 3,458,863 shares over this three-month period. This means that they spent an average of $246.90 per share to accomplish this.
Many people judge the quality of a buyback by whether or not the stock was acquired at a price that happens to be above or below the current stock price. I prefer to judge the quality of a buyback based on the valuation that management retired shares at as I consider it to be a bit more objective a measure. I think the idea that a buyback can flit from “good” to “bad” based on the up and down price movement of the stock is a bit silly. Thus, we’ll definitely come back to this $246.90 figure when I write about the valuation below.
Although I don’t like the increased level of debt, and the relatively slow earnings growth here, I’ll concede that the dividend is well covered, and I’d be willing to buy these shares at the right price.
Norfolk Southern Financials (Norfolk Southern investor relations)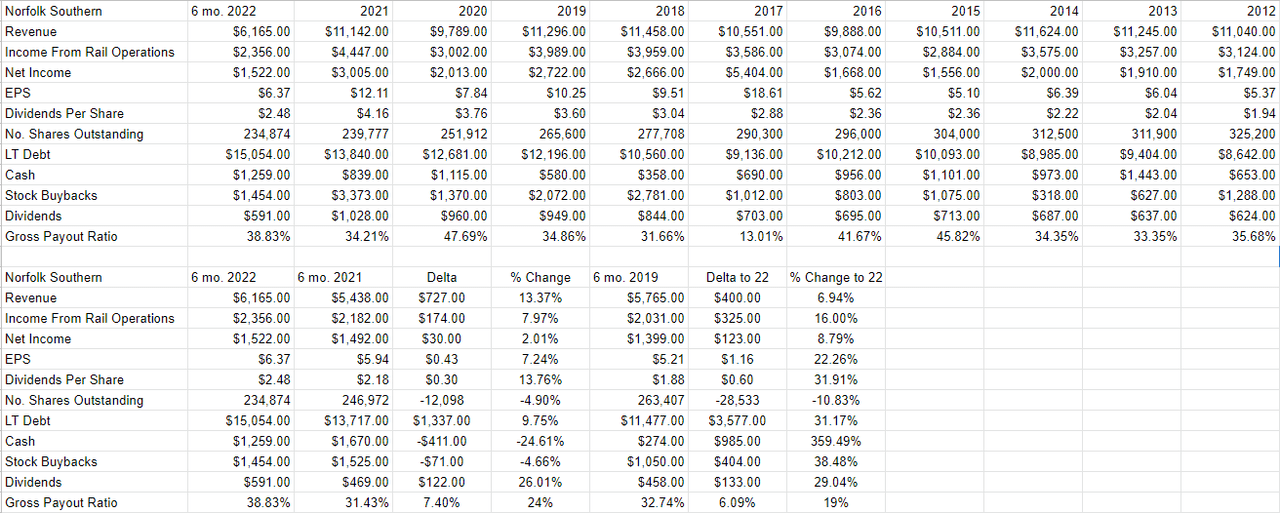
The Stock
Welcome to the section of the article where I point out yet again what I consider to be screamingly obvious, namely that “the business” is quite a different thing from “the stock.” If you read my stuff regularly for some reason, this isn’t a shock to you. If you’re new here, welcome to the party. I feel a need to point this out because one of the more pernicious old adages that float around investing circles is that “we don’t buy stocks, we buy businesses.” No, we absolutely do not “buy businesses.” We very much buy “stocks”, and they are affected by forces that are in addition to the ups and downs of the firm. For instance, a stock may move up or down in price because of what an analyst said about a related, or only peripherally related, business. For example, Norfolk Southern may be affected by someone writing about coal demand in the teeth of a global energy shortage. Additionally, the stock may be affected by rumors of potential strike activity.
Finally, the stock is very definitely affected by our collective views about the overall market, and stocks as an asset class. For this reason, we need to consider the stock as a thing distinct from the business. It may be tiresome that your stock gets buffeted around by forces having very little to do with the company, but in my experience, this creates tremendous opportunity also. The only way to consistently make money trading stocks is to spot discrepancies between the crowd’s view about a given company and subsequent results. Further, we want to go long a stock when the crowd becomes overly pessimistic, and we want to avoid stocks when the crowd becomes overly sanguine. This approach causes investors to miss out on some great gains in the short run, but I think it preserves the purchasing power of your capital over time, and that’s really the name of the game in my view.
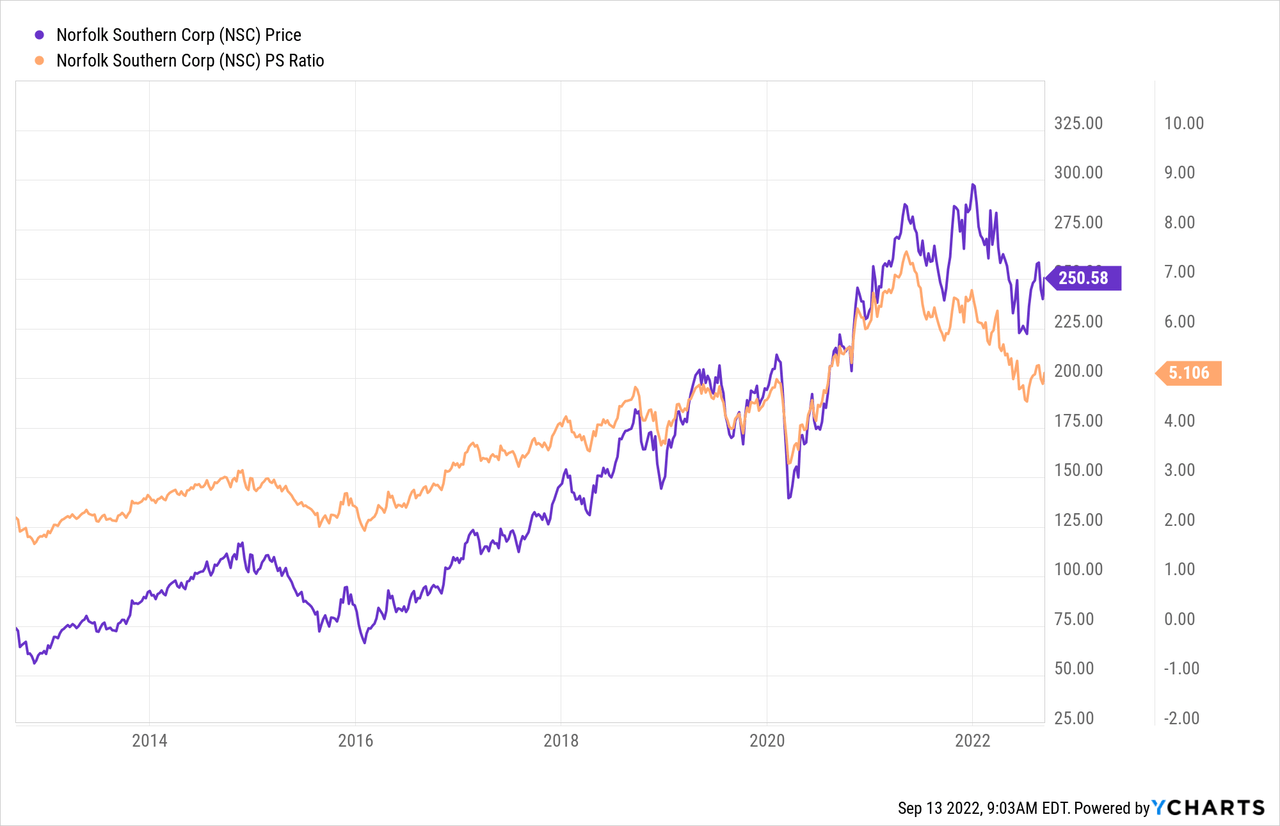
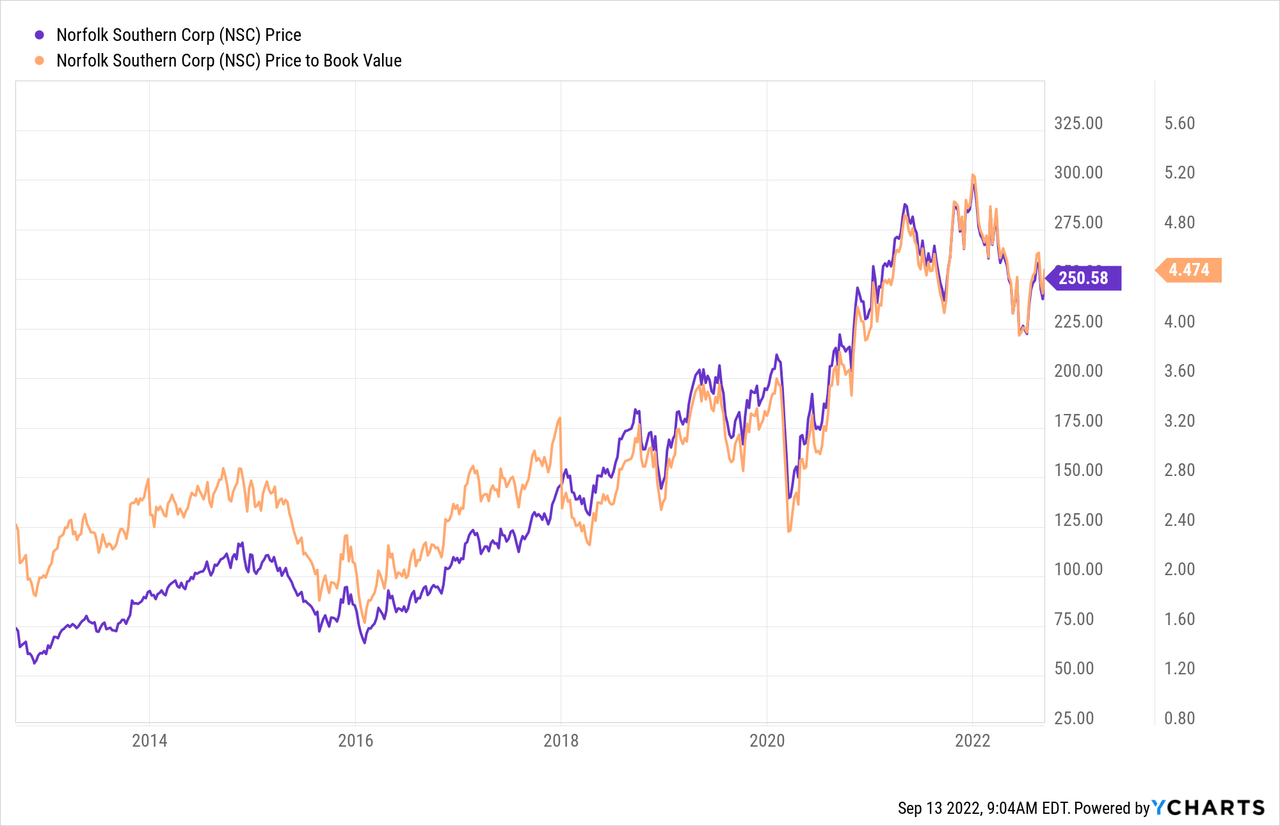
I want to buy when the crowd is particularly pessimistic. I measure pessimism in a few ways, ranging from the simple to the more complex, and I publish some of those measures on this forum. On the simple side, I look at the ratio of price to some measure of economic value like earnings, free cash flow and the like. I want to see a stock trading at a discount to both the overall market and its own history. When last I reviewed Norfolk Southern, I was bothered by the fact that price-to-sales and price-to-book ratios were at 4.75 and 3.92 times respectively. The shares are between 7% and 14% more expensive per the following:
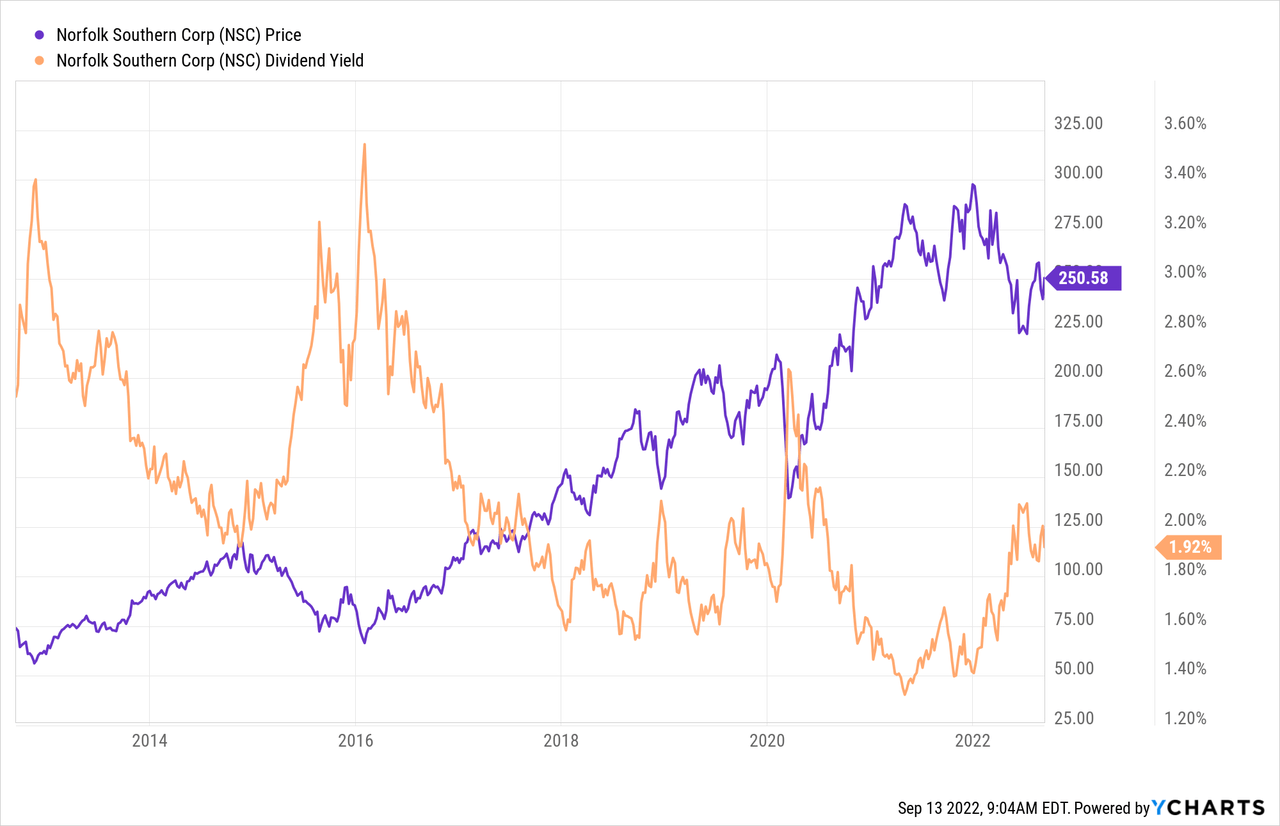
While investors are paying between 7%-14% more for the shares, they’re getting about 9.5% less income from the dividend yield per the chart below. This is particularly troublesome in light of the fact that it’s possible to receive a much less risky yield of about 3.44%:
In addition to looking at simple ratios, I want to try to understand what the market is currently “thinking” about a given stock. I do this by using the magic of high school algebra to isolate the “g” (growth) variable in a standard finance formula. This is an approach described by Professor Stephen Penman in his tome “Accounting for Value.” It’s also described, in a slightly more accessible manner, in Mauboussin and Rappaport’s recent update to their classic “Expectations Investing.” The approach tries to uncover the current assumptions that go into “making” the current stock price. When I apply this approach to Norfolk Southern, it seems that the market is assuming a perpetual growth rate of about 5.9% for this business. That is massively optimistic in my view and is yet another reason to avoid the shares.
Reviewing the Buyback
You may recall from a previous section that I determined that the company retired 3.458 million shares at an average price of $246.90 during the most recent quarter. This is the equivalent of retiring shares at a price-to-sales ratio of about 5.03, which is very near a multi-year high. I consider this to be a waste of owner capital, especially in light of the egregious growth in long-term debt.
Conclusion
I think the business is facing some headwinds, as evidenced by the fact that fuel and materials costs are up massively over the past year. A person who insists on going long here is taking a bet that these pernicious trends are about to reverse. That may be, but the risk is too great in my estimation. Additionally, there is obviously labor discontent at the railroads, and that won’t be great for business. Most troubling of all is the fact that the valuation is on the rich side in spite of these problems. That is not a great circumstance when TINA (“there is no alternative”). When investors can actually receive a relatively healthy and predictable cash flow from a 10-year Treasury Note, then the relative value of a stock like this looks even worse. I’m going to continue to avoid Norfolk Southern, and I’d recommend other investors do the same until valuations return to a more typical valuation.
Be the first to comment