

imaginima
The large drop in US equities recently has also brought down oil and gas stocks. Recessionary fears have damped oil and gas prices as well as stocks in those sectors. The Nordstream explosion serves as a reminder that the natural gas bull market is secular and long term as it dims any hope of Europe returning to Russian gas.
Oil and gas may be one of the few green shoots in the current market (recent news suggests OPEC+ is considering an output cut of 1 million barrels per day, which may indicate that the OPEC Put (previously discussed here) is well and alive. This article will focus on natural gas.
As reality slowly sinks in that Europe will be facing an energy shortage for years, which US natural gas stock is best placed to capitalize on the LNG boom? It appears the current European energy policy still does not fully address the issue of supply, rather focusing on taxing profits etc. Without an adequate plan on the supply front (whether increasing coal, nuclear or oil generation, or buying up the rest of the world’s LNG supply), it appears the crisis will continue to persist.
For units of measurement conversion between cubic meters, cubic feet and tons, please see the bottom of the article.
As elaborated in a previous article, I believe US upstream natural gas producers will be the main long term beneficiary of the LNG boom as:
- In the short run, the US LNG export boom will benefit LNG exporters such as Cheniere (LNG) that will be able to capture the margins from producing LNG
- In the long run:
- exporting LNG has not been a particularly profitable business and Europeans probably will not want to perpetually pay elevated prices, hence margins will revert to mean at some point.
- However, upstream natural gas production may see higher margins as the LNG export boom removes the supply glut within the US, which will materially increase US natural gas prices. I won’t repeat the details from my previous article: for further details refer to the above link.
- One reader questioned why downstream isn’t the biggest beneficiary given the large difference between the wellhead and residential natural gas prices. The differential mainly reflects the costs with getting the natural gas to market rather than any exorbitant profitability.
US nat gas prices (EIA)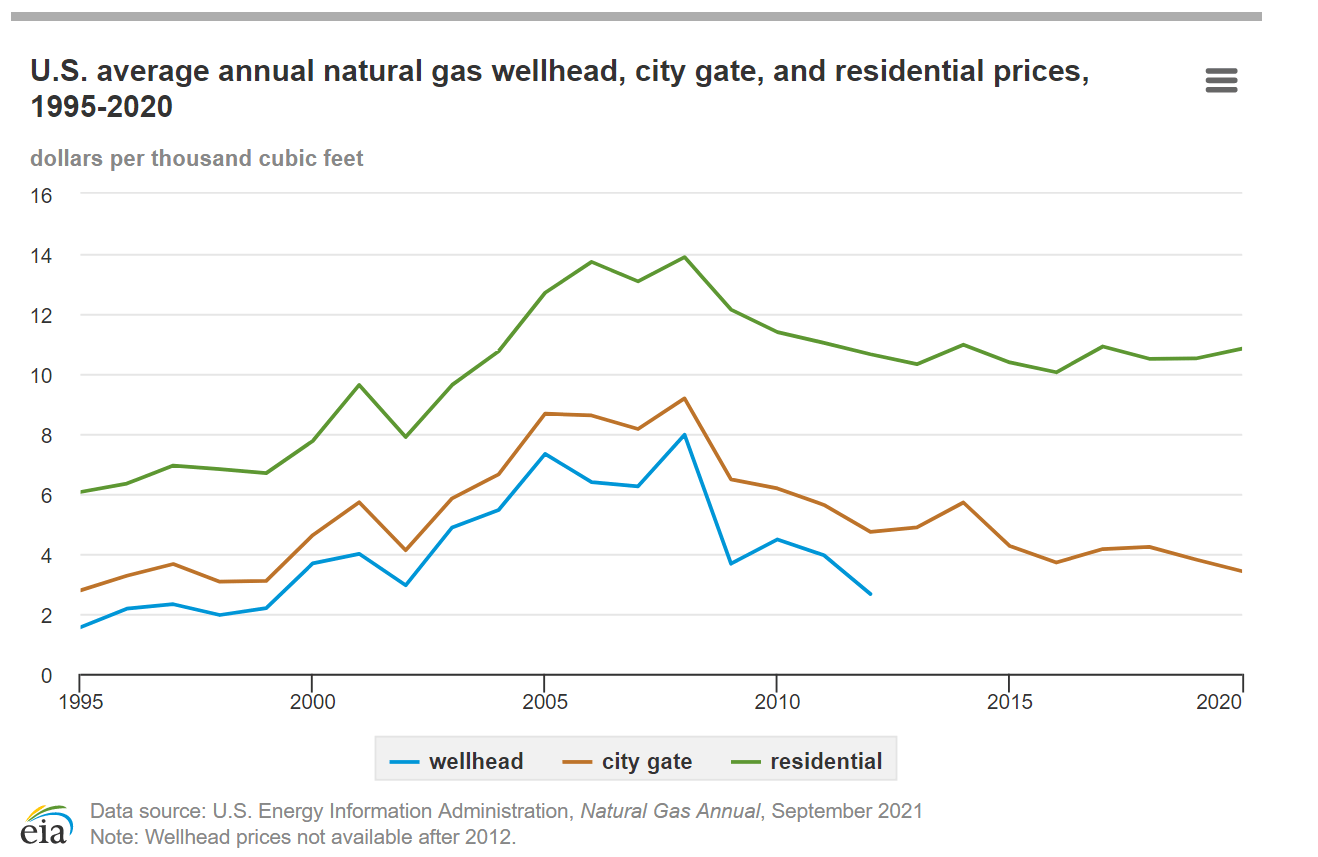
- This may also work for natural gas prices: if natural gas prices increase a few dollars, the percentage impact on producers will be far bigger than the impact on the end-user, making any price hikes more palatable.
For reference, I show below the strip natural gas prices based on futures from now to 2034. Natural price futures trade at $7/mmBTU in the US for the next few months but sharply fall off to $4-5/MMbtu for the next decade. The near term prices have fallen a lot recently due to overall bearish movements but I think this is not valid in the long run – US natural gas consumption fell only 2% in 2020, one of the worst years in economic history, hence natural gas consumption is quite inelastic and any dip in domestic consumption will far be compensated by increasing LNG exports. I argue in my previous article above that US LNG exports may increase by a further 3 tcf while a 2% decline from recession would only be 0.6 tcf.
US nat gas prices (barchart.com)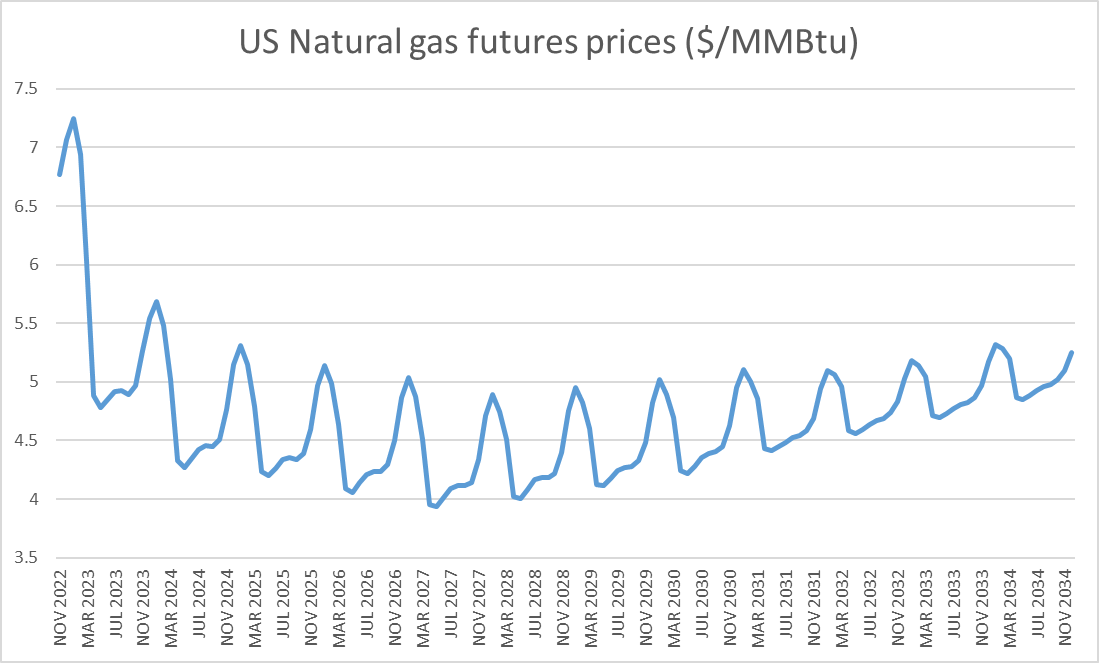
Let’s now look at two representatives of upstream and midstream natural gas as potential investments.
Upstream: EQT Corp (NYSE:EQT)
EQT is representative of the upstream pure play, with ~95% of its revenues from upstream natural gas production. Compared to many large oil companies where natural gas accounts for something like 10% of revenues (for example, Occidental), EQT is as pure play as it gets.
EQT has recently receded from 52 week highs (from $52 on Sept 14 to $40 recently) but has still gone up over 10 times from its bottom in February 2020 ($4.16/share). So the question, is it still a buy or is it time to sell, like some other contributors have suggested?
EQT (stockcharts.com)
EQT has several things going for it:
- Strong resource base and cost competitiveness: EQT’s cost competitiveness can be seen from two angles:
- Company assessed their breakeven price by well for their 1,800 core locations. 90% of them had a breakeven price at $2.5 (using a discount rate of 10%).
EQT breakeven (Company investor presentation)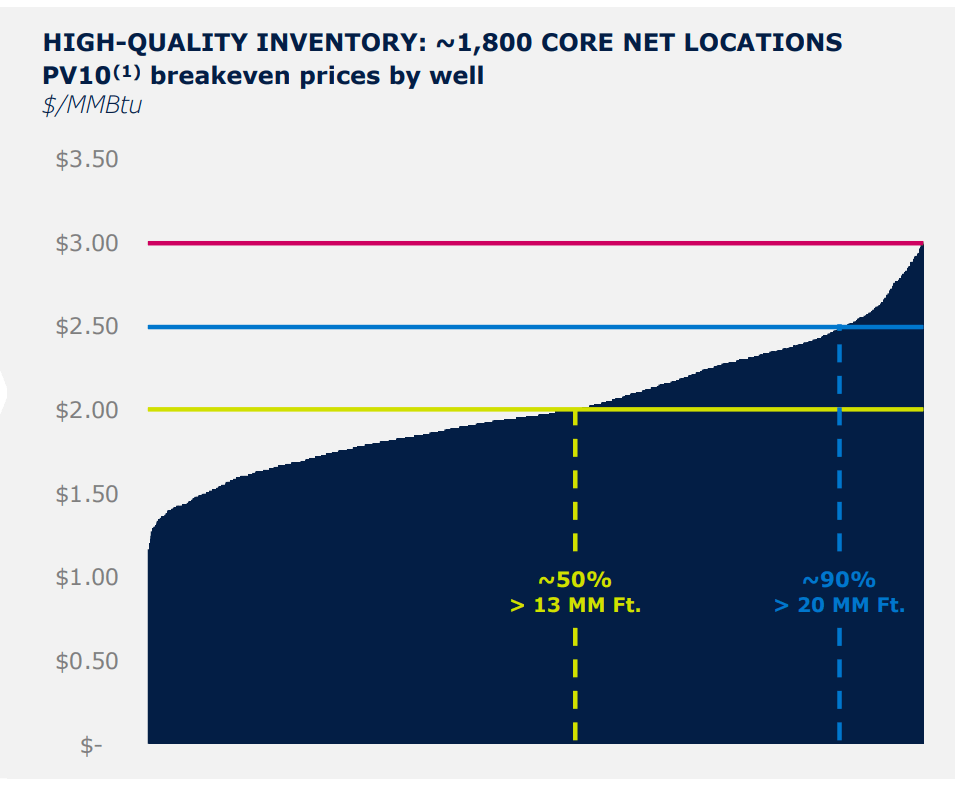
Source: Company investor presentation
2.EQT has high capital efficiency versus peers, with capex per unit output very low compared to competitors.
EQT capex (Company investor presentation)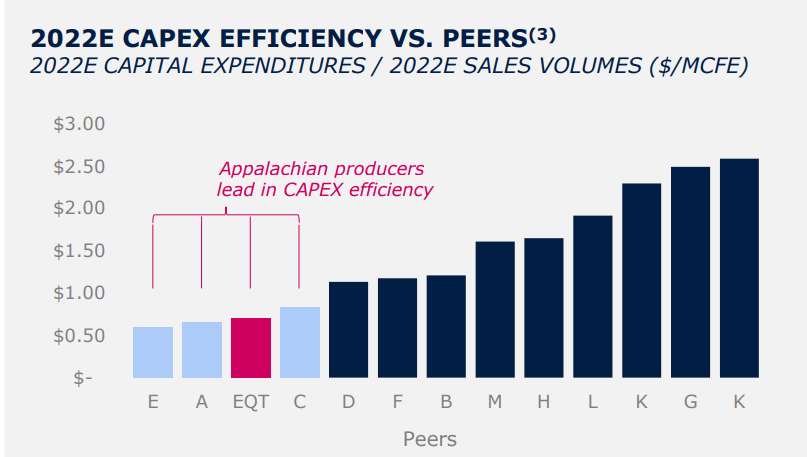
3.This enables the Company to claim a cashflow forecast breakeven of $2.3/MMbtu (average forecast from FY22-FY27) before the THQ acquisition (which further lowers the breakeven to $2.15/MMbtu and will be separately discussed below).
- Disciplined Management capital allocation decisions
Management has been quite disciplined in its capital allocation decisions:
-
- Distribution of natural gas windfall: Faced with the windfall from higher natural gas prices this year, Management is in the process of paying down debt, increasing the dividend, and conducting share buybacks. The acquisitions made in FY21 and FY22 are complimentary with the existing business.
- M&A: Management has focused its M&A activity essentially on horizontal integration and has not materially rushed into new arenas like LNG (which it stated in its Q2-2022 earnings call that it was exploring), but has stayed within its circle of competence and strengthened the circle:
- In May-2021, Management acquired Alta, an upstream Appalachian natural gas producer situated close to the Company, which added a projected $300-$400 million annual FCF at an acquisition price of $2.9 billion.
- Sep 6th 2022, Management announced the THQ acquisition, also an upstream Appalachian natural gas producer situated nearby the Company, at a consideration of $5.2 bn of which $2.6bn will be cash and remainder paid in 55 million shares of EQT stock. The deal is quite compelling from a value perspective.
- THQ will add roughly 10% of production and acreage to the combined business as shown below.
EQT THQ (Company investor presentation)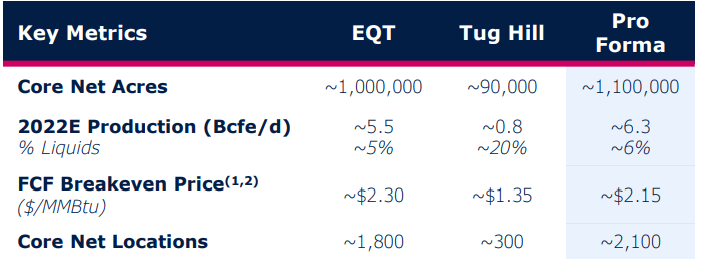
The valuation is much higher than the Alta acquisition in terms of price paid per daily production volumes and acreage but the natural gas industry has boomed since the Alta acquisition. Overall, the transaction valuation appears to be favorable – the NTM (next twelve month) EBITDA multiple is only 2.7. Management states the implied natural gas price from the valuation is under $3/MMbtu (though it is unclear what discount rate they are using).
- Potential for further growth: As Appalachian natural gas pipelines are overall running at their full capacity, capex is mainly maintenance in nature. However, if additional pipelines are built, then EQT may be able to ramp up production and achieve further growth. EQT shows 7 bcf/d of blocked/cancelled pipelines which it believes 70% of voters supports additional production and buildout. I’m a bit skeptical whether these pipelines will be built given they have been blocked/cancelled for so long. In case they are, this could provide additional upside.
EQT expansion (Company investor presentation)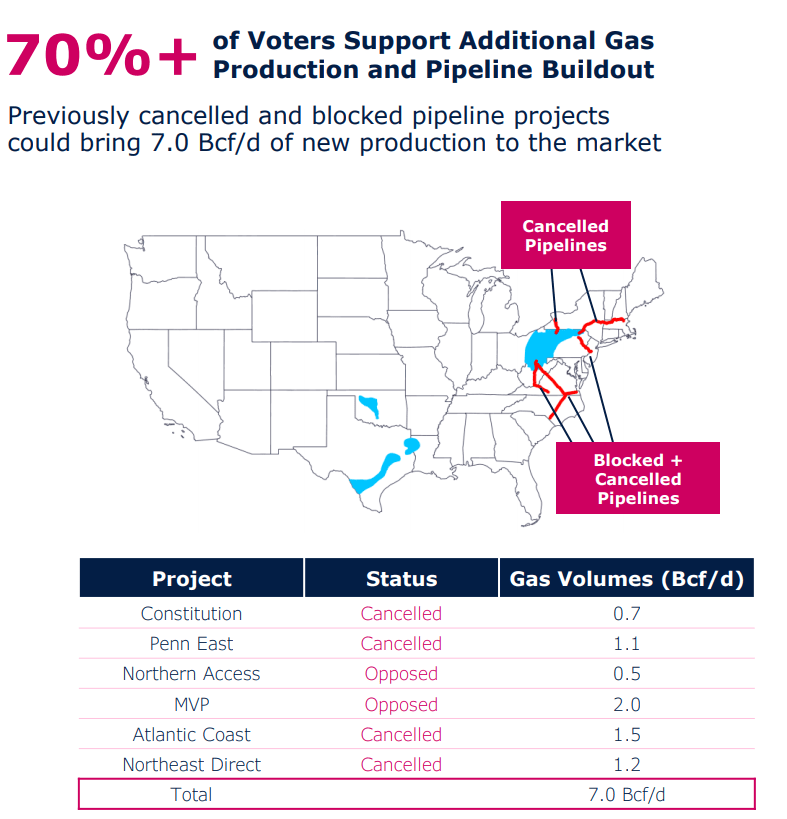
The fundamentals appear to be favorable but how undervalued is the stock? I think given that one chart will say it all, there is no need to over-analyze using a model:
EQT cashflow outlook (Company investor presentation)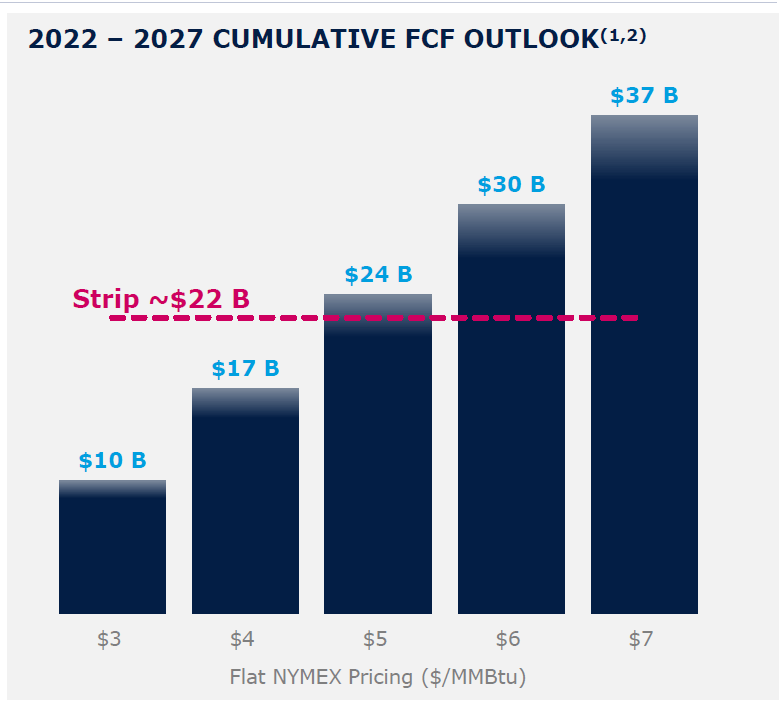
If natural gas prices remain at around strip prices (which was essentially a bit lower than $5 on average for most of 2022-2027), then EQT would generate $22 billion of FCF by 2027, which would exceed its entire EV (current market cap is $15bn and debt is c$6bn for an EV of $21 billion).
Even if natural gas prices are $4 for the next 5 years, EQT will have generated $17 billion by 2027 and recouped 80% of its EV. These numbers are before the bolt-on acquisition of THQ, but given the favorable deal profile of the THQ acquisition, it’s unlikely to materially change the above assessment.
Midstream: Cheniere
Cheniere (Cheniere’s stock ticker is LNG and to avoid confusion with the product LNG, I will refer to it by its name Cheniere rather than its ticker) has US LNG liquefaction facilities that enable it to transform natural gas into LNG, which is then shippable to the rest of the world. It has been a main beneficiary from the LNG boom as US LNG replaces Russian gas in Europe due to the capacity of LNG production being a major bottleneck constraining US LNG exports for at least a few years.
I see several things working against Cheniere, mainly being the fact that time is not its friend:
- LNG has been in a supply glut for many if not most years and the current supply tightness is an aberration. While oil and gas supply might be constrained due to lack of will to increase production (see here for a full discussion), it seems unlikely the US will purposefully constrain LNG facilities to supply its European allies with LNG.
- Hence, Cheniere is unlikely to earn above average profit margins for too long. In fact its investor presentations provides earnings guidance for FY22 and only some overall cashflow guidance up till FY26, unlike EQT which provides much more detail for years beyond FY22. This is probably because the benefits from high natural gas prices are backloaded for EQT and frontloaded for Cheniere.
This is fully reflected in LNG’s EPS estimates.
LNG EPS estimate (Seekingalpha)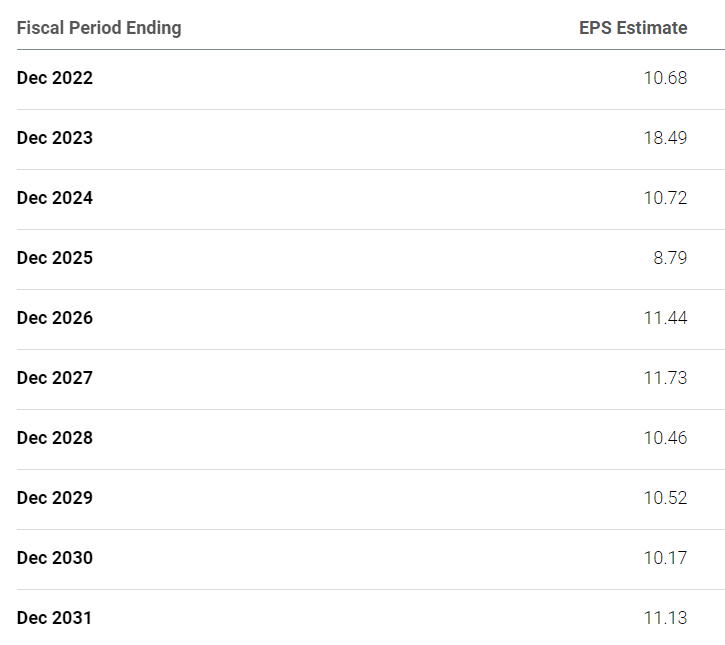
The math behind it isn’t that hard: The main drivers of Cheniere stock value are (i) how much production it has (and can increase) and ((ii)) the margins (i.e. differential between the price it sells LNG for and the cost of purchasing the natural gas in the US) it receives for each unit of LNG produced and shipped.
LNG export price differential (EIA)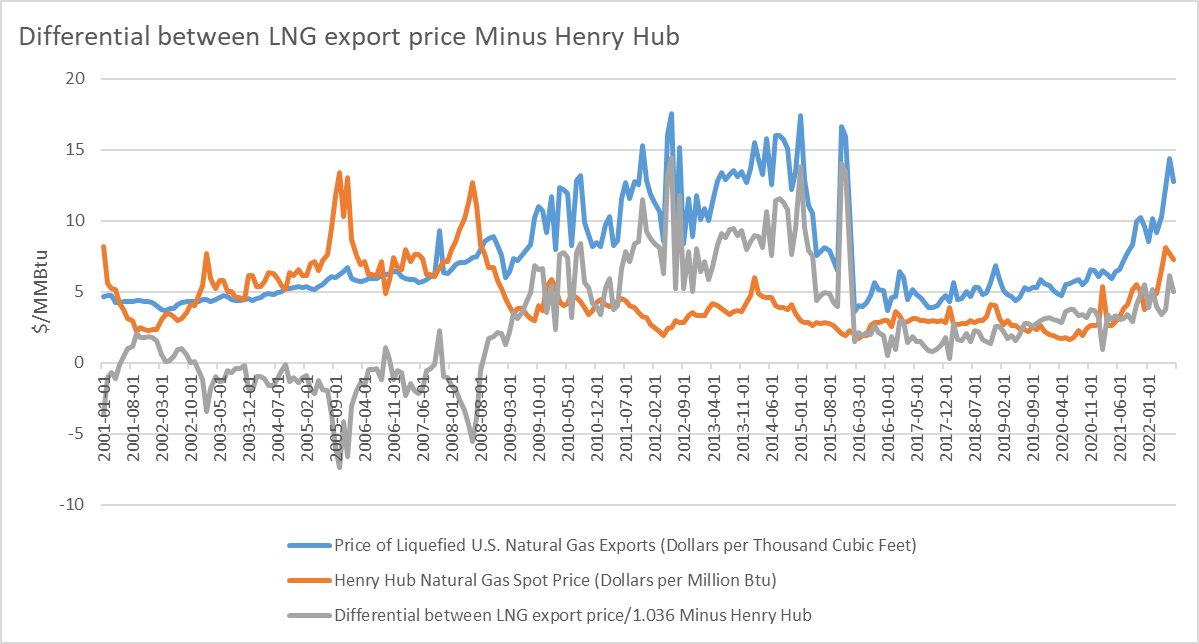
Source: EIA data
The grey line is the difference between LNG export price/1.036 and Henry Hub natural gas spot price, which roughly reflects the margin LNG facilities could earn historically from 2001 to present. Except a few years in which LNG demand outstripped capacity, most of the time margins were under $5/MMBtu, especially since 2016.
Long story short, if Cheniere’s margins revert to $3/MMBtu its current market cap reflects profitability under those circumstances:
- Even if its production capacity increases to 3 tcf/year (60 mtpa) from the current 2.3 tcf/year (45 mtpa) by 2027, then this would convert to FCF of about $5.5bn a year ($9 bn revenues net of gas costs ($3*$3) minus $2 billion in cash SG&A costs, minus $1 billion attributable to minority interest minus $600million for maintenance capex, income tax etc) , which corresponds to about $47.7 billion present value at 8% discount rate.
- Management estimates >$20 billion in distributable free cash flow by 2026 (of which $7bn will be invested in the growth to attain the 2027 capacity expansion to 3 tcf/year). This “>$20bn” was recently estimated by Morgan Stanley to be $27 billion. That would be about $47.7+27-7=$67.7 billion enterprise value, minus $26 billion in net debt would attain about c$40 billion equity value, which is more or less the current market cap.
Cheniere cashflow allocation (Company investor presentation)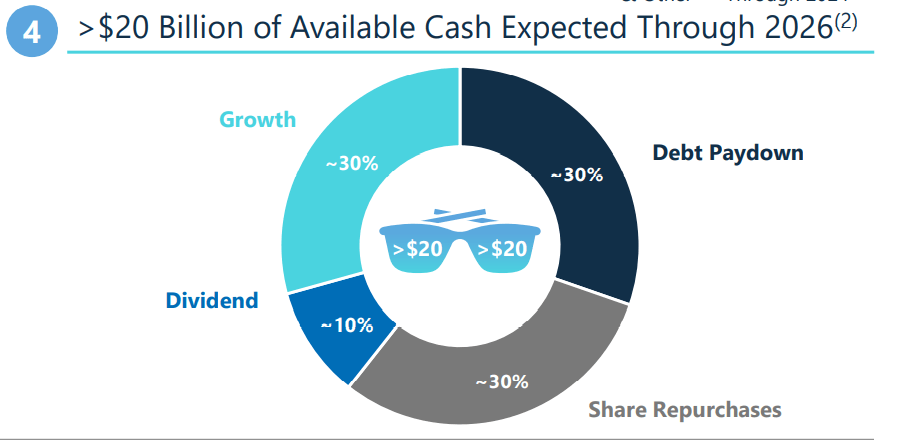
- However, any further upside is heavily based on the “margin” that Cheniere can earn, as recently estimated by Morgan Stanley below. I would find the scenario of $8.75/MMBtu to be wildly optimistic given capacity is likely to expand and historically this industry has not been able to sustain high levels of profitability.
|
Bull case: $269 |
Base case $203 |
Bear case $137 |
|
Assumes long-term differential between Asian LNG and Henry Hub (i.e. export and US production price) to be $8.75/MMBtu |
Does not specify |
Assumes long-term differential between Asian LNG and Henry Hub (i.e. export and US production price) to be $2.75/MMBtu |
Source: Morgan Stanley
Summary
Upstream US natural gas producers such as EQT appear to be valued with a margin of safety and perfectly perched to benefit from the increase in US exports of LNG to Europe. EQT would earn back its entire enterprise value by 2027 if US natural gas prices were around $4.5-$5/MMBtu for the next 4 years.
Midstream operators are making the most money now due to LNG capacity shortages, but this has not been too profitable historically, so there is much less margin of safety. For Cheniere to further see large gains in its stock prices, the future profitability of LNG exports would have to tremendously increase (unfortunately, history suggests LNG capacity has usually been in a glut).
Appendix: Unit of measurement conversion
For the reader to compare more easily with whichever unit he is using
1 cubic meter (‘CM’) = 35.31 cubic feet (‘CF’)
1000 cubic feet = 1.036 million Btu or MMBtu (which is the unit traded on the US exchanges for natural gas)
1 ton = 1470 cubic meters
M=million, b= billion, t=trillion
(I won’t use mm for million and m for thousand, unless in the context of MMBtu per convention, because that’s just confusing)
To set a baseline: Russia annual exports to EU of natural gas in 2021 = 6.55 tcf a year (roughly equal to 1,854 bcm or 126 million tons).
Be the first to comment