

onurdongel/E+ via Getty Images
A guest post by Ovi
Below are a number of crude oil plus condensate (C + C ) production charts for Non-OPEC countries created from data provided by the EIA’s International Energy Statistics and updated to December 2021. This is the latest and most detailed world oil information available. Information from other sources such as OPEC, the STEO and country specific sites such as Russia, Brazil, Norway and China is used to provide a short term outlook for future output and direction for a few countries and the world.
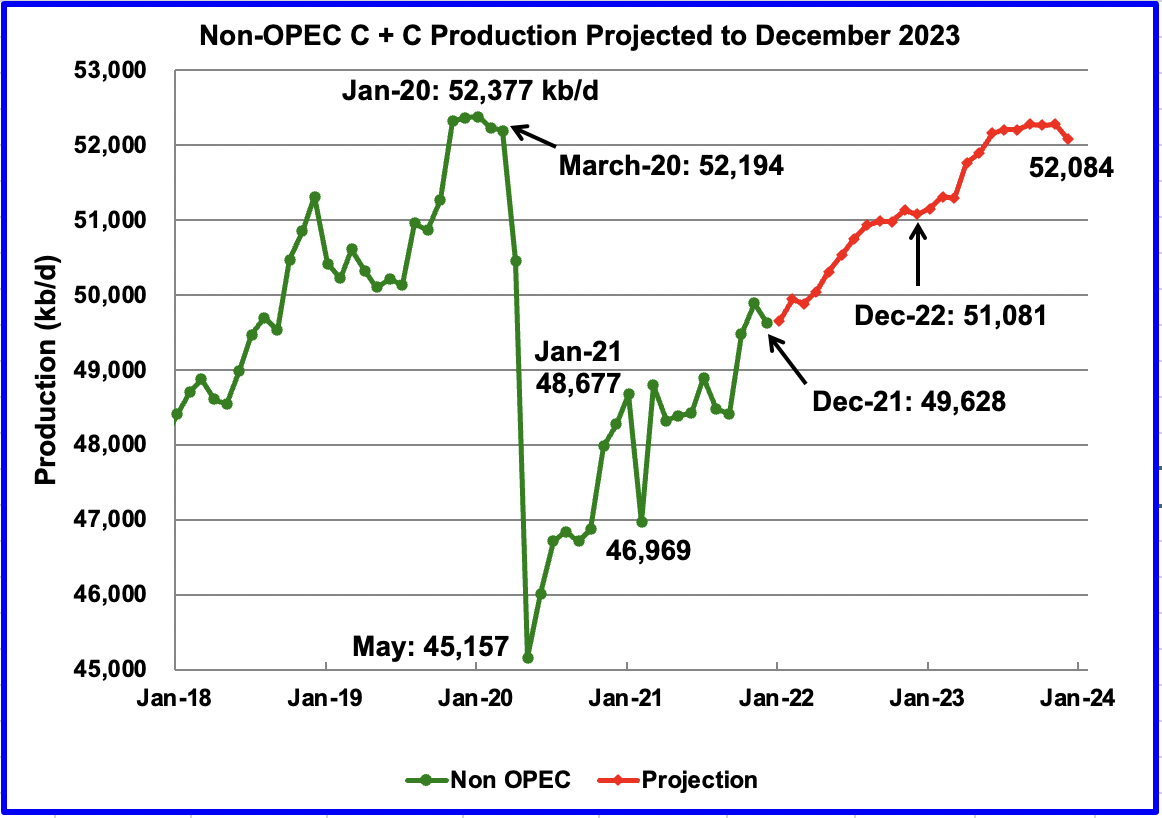
December Non-OPEC production decreased by 261 kb/d to 49,628 kb/d. Of the 261 kb/d decrease, the biggest decreases came from the US 205 kb/d, Brazil 113 kb/d and China 91 kb/d. Offsetting the decreases were increases from Norway, 117 kb/d and Guyana 86 kb/d.
The December 2021 output of 49,628 kb/d is 2,566 kb/d lower than the March pre-covid rate of 52,194 kb/d.
Using data from the March 2022 STEO, a projection for Non-OPEC oil output was made for the time period January 2022 to December 2023 (Red graph). Output is expected to reach 52,084 kb/d in December 2023, which is 293 kb/d lower than the January pre-covid peak of 52,377 kb/d.
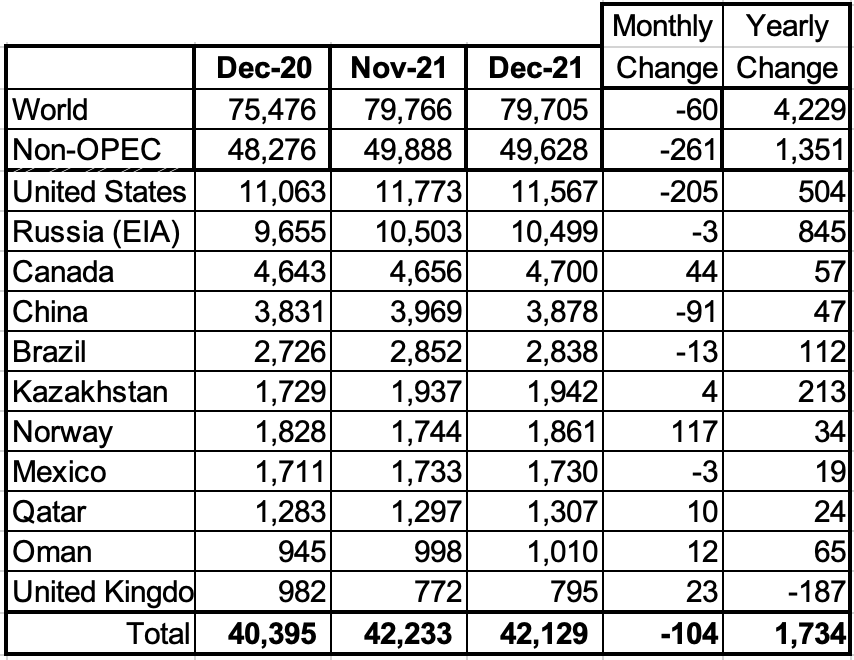
Above are listed the world’s 11th largest Non-OPEC producers. The original criteria for inclusion in the table was that all of the countries produced more than 1,000 kb/d. The UK has currently fallen below 1,000 kb/d.
In December, these 11 countries produced 84.9% of the Non-OPEC output. On a YoY basis, Non-OPEC production increased by 1,351 kb/d while on a MoM basis production it decreased by 261 kb/d to 49,628 kb/d. World YoY December output increased by 4,229 kb/d.
Production by Country
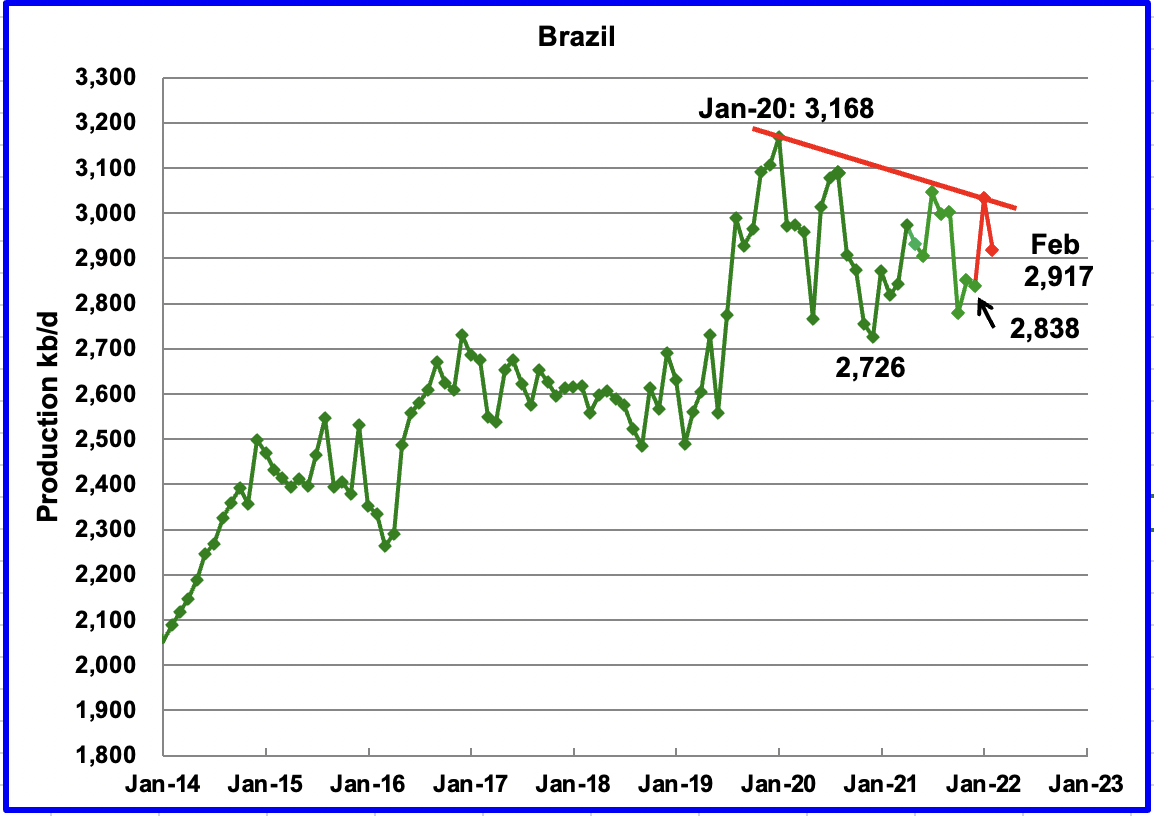
The EIA reported Brazil’s December production decreased by 13 kb/d to 2,838 kb/d. Brazil’s National Petroleum Association reported that February’s output declined to 2,917 kb/d after January increased to 3,032 kb/d. (Red Markers).
Brazil continues to experience difficulties in increasing its yearly output. However according to the IEA, production in 2022 is expected to exceed 3,000 kb/d.
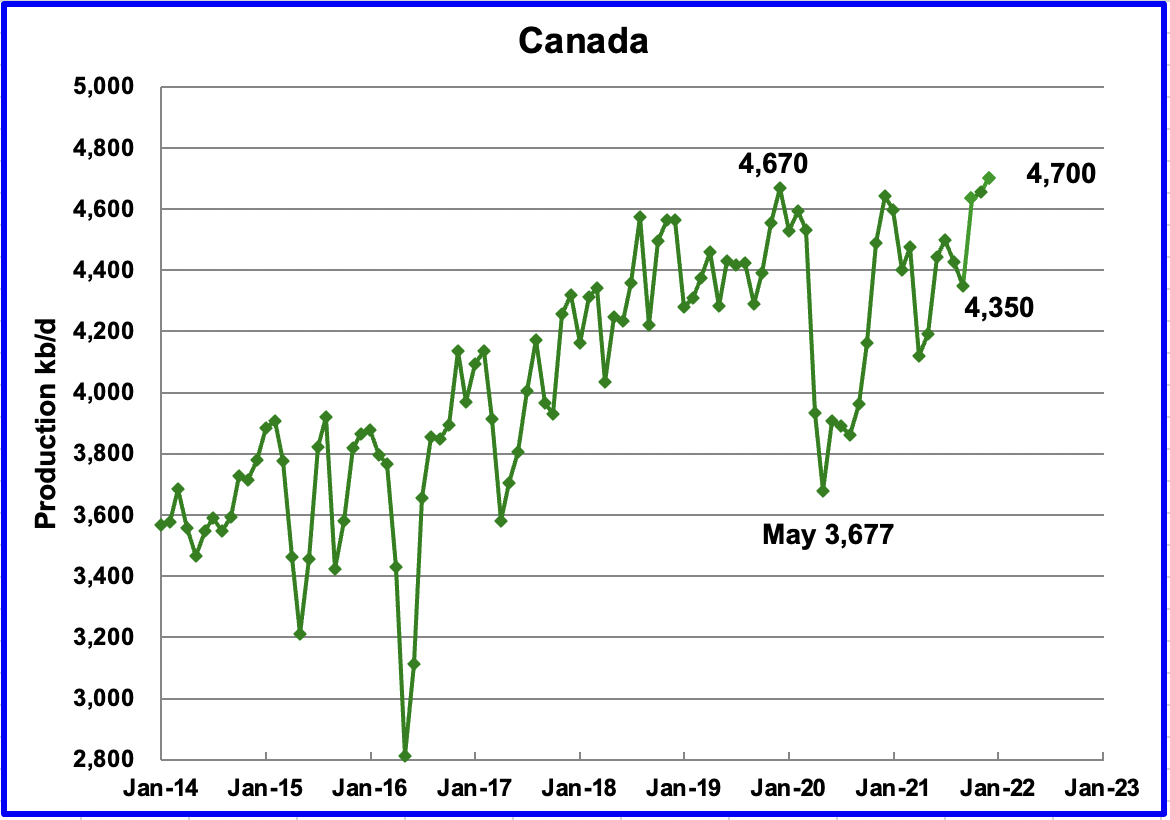
According to the EIA, December’s output increased by 44 kb/d to 4,700 kb/d.
There appears to be renewed US interest in resurrecting the Keystone XL pipeline project as a means of enhancing US energy security. In this regard, Senator Manchin will be visiting two oilsands producers in the week of April 10.
“Senator Joe Manchin of West Virginia and chairman of the United States Senate Committee on Energy and Natural Resources will visit Alberta between April 11 and 12. The Alberta government says the visit is to “learn about the province’s responsible energy sector and to discuss North American energy security.”
While there have been a number of calls to revisit the Keystone XL decision, many don’t realize the capital investment that TC pipeline made to the project and lost it all. Contributing to the loss were the numerous court challenges they faced, which they would face again. Also many proponents don’t realize that the Capline pipeline (See below) which was reversed is possibly a better alternative to Keystone XL.
The constraints put on Canada’s export capacity by the cancellation of Keystone XL were mitigated by the start up of Line 3. The upgraded Line 3 pipeline which added close to 400 kb/d of export capacity started operating in December 2021. Another pipeline, the expanded Trans Mountain pipeline will get Canadian oil to tidewater and is expected to be completed by end 2023. It will have a nominal capacity of going from approximately 300,000 barrels per day to 890,000 barrels per day.
“A reversed Capline would open a significant new route for Canadian oil to the key Gulf Coast processing hub, experts say, adding as much as 1.2-million barrels a day (b/d) of new transport capacity to a market already buoyed by increased crude-by-rail shipments and major additions along established pipeline corridors. Capline currently ships crude north about 1,020 kilometres from St. James, La., to Patoka, Ill. Keystone XL, by contrast, plans to ship 830,000 bpd.
“I think the refineries in Louisiana would be interested in accessing heavy Canadian crude through that means,” said Afolabi Ogunnaike, a Houston-based analyst at energy consultancy Wood Mackenzie. “The challenge is, is there sufficient capacity to get the crude into Patoka?”
A New Canadian oil Field
The Norwegian oil company Equinor and its partners plan to develop the oil field at the Flemish Pass, about 500 kilometres east of St. John’s. Bay du Nord will be the first project to move the offshore oil industry into such deep waters, with drilling to go more than a kilometre underwater.
The Equinor plan is to use a massive floating production, storage and offloading vessel, commonly known as an FPSO, capable of producing up to 200,000 barrels daily.
According to this source, the Bay du Nord development for the Flemish Pass Basin could contain up to one billion barrels.
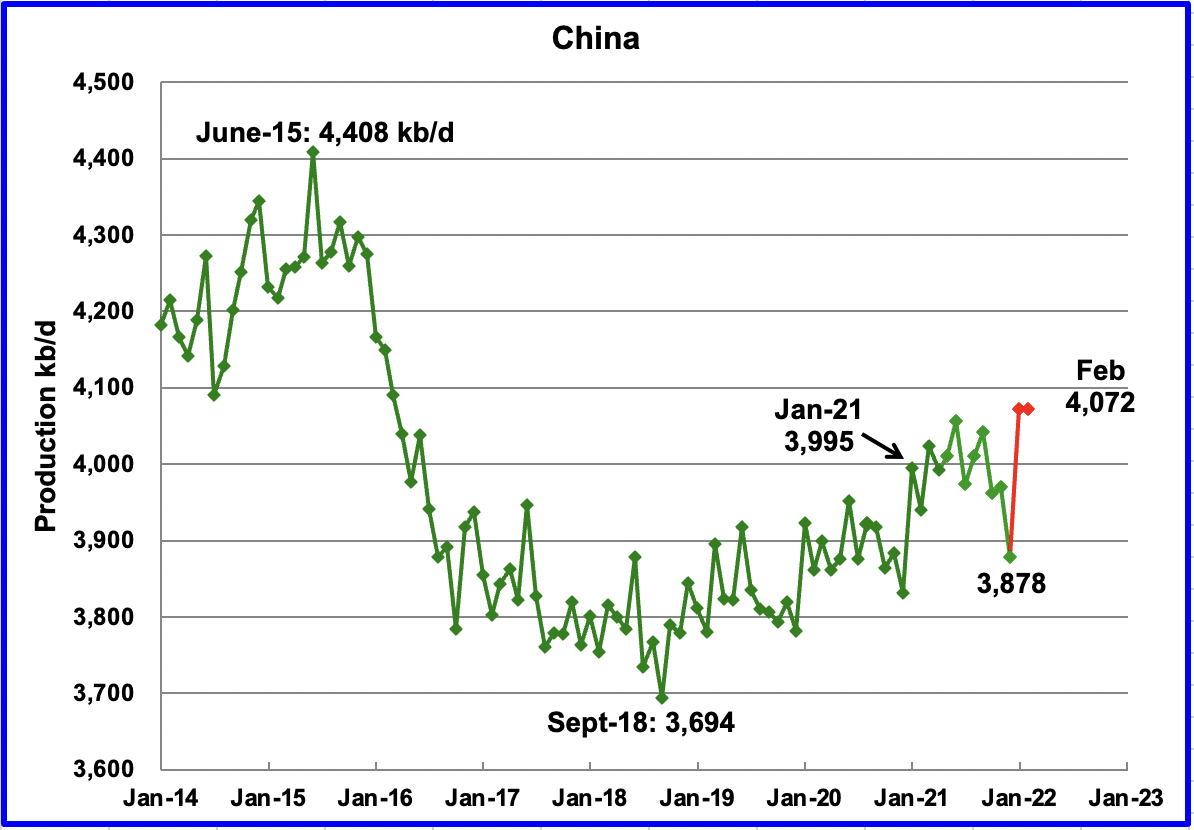
The EIA reported China’s output decreased by 91 kb/d from 3,969 kb/d in November to 3,878 kb/d in December. January’s output rebounded to 4,072 kb/d in January and held steady in February. (Red markers).
A sidebar: Close to the 22nd of every month I access the Chinese National Bureau of Statistics to get their crude production for the previous month. The information is no longer available. December was the last month when the information was provided. Will China’s oil production information now become a state secret?
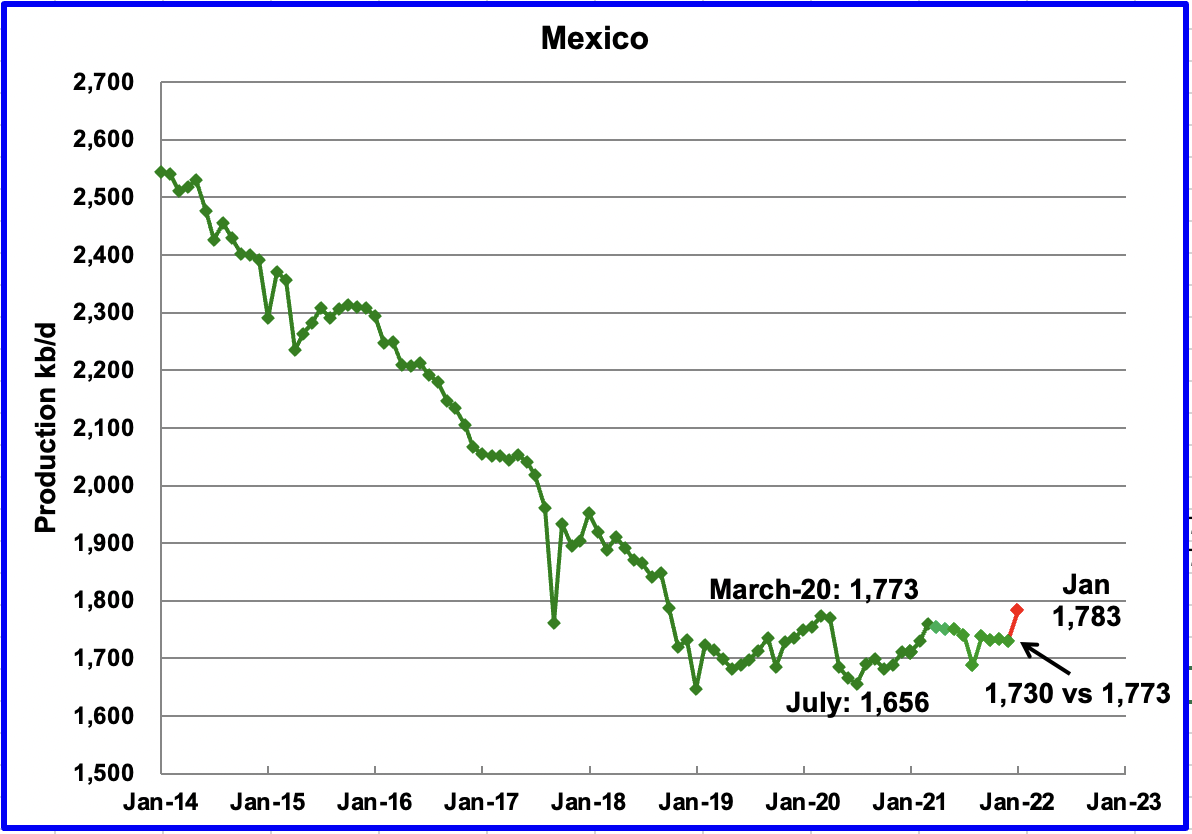
Mexico’s production as reported by the EIA for December decreased by 3 kb/d to 1,730 kb/d.
Data from Pemex showed that December’s output climbed to 1,773 kb/d and was essentially unchanged for January at 1,783 kb/d. (Red marker). However for some unknown reason, it appears that the EIA reduced Mexico’s official December C + C production by 43 kb/d. For November, the EIA decreased Pemex’s output by 38 kb/d. The January output of 1,783 kb/d may again be reduced by the EIA to something in the area of 1,743 kb/d.
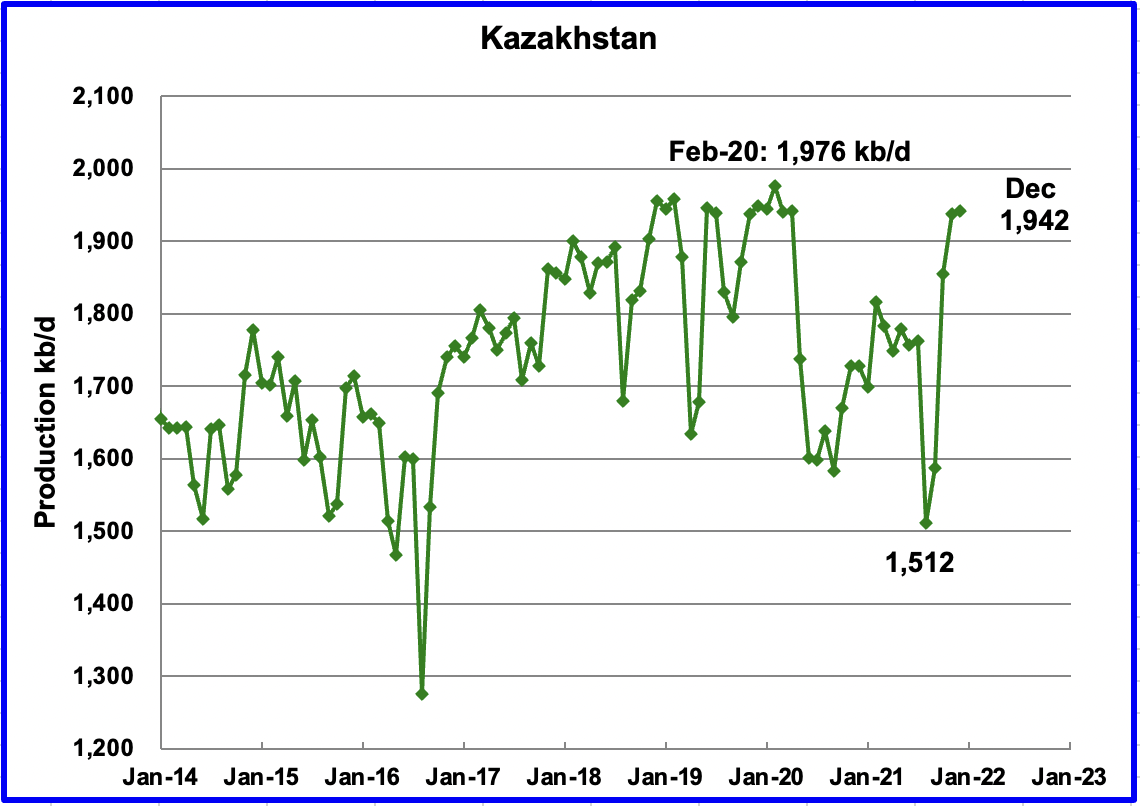
Kazakhstan’s output increased by 4 kb/d in December to 1,942 kb/d following the end of maintenance in the Tengiz field. December was the highest output since May 2020. The small increase in December was expected since it is close to its former peak output of 1,976 kb/d.
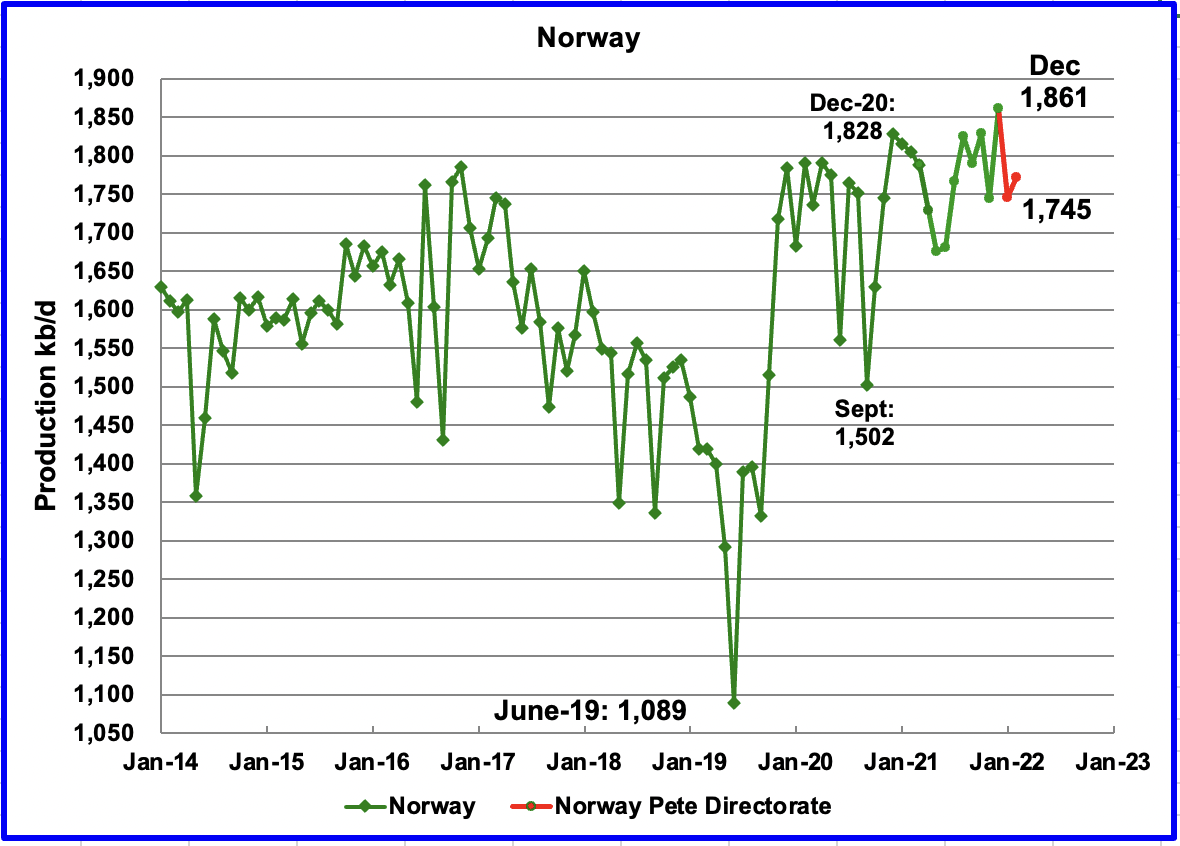
The EIA reported that Norway’s December production increased by 117 kb/d to 1,861 kb/d. The Norway Petroleum Directorate (NPD) reported that production in January decreased to 1,745 kb/d and then increased to 1,772 kb/d in February. (Red markers.)
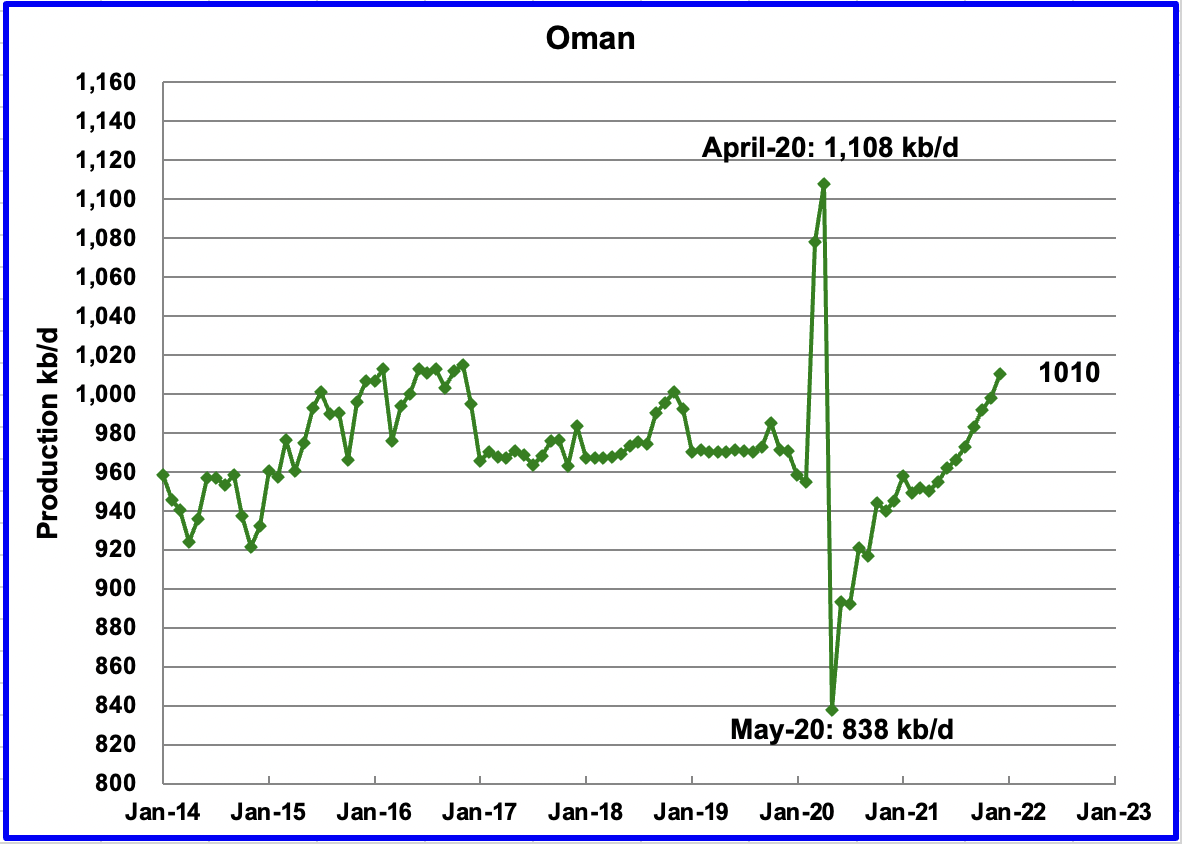
Oman’s December production increased by 12 kb/d to 1,010 kb/d.
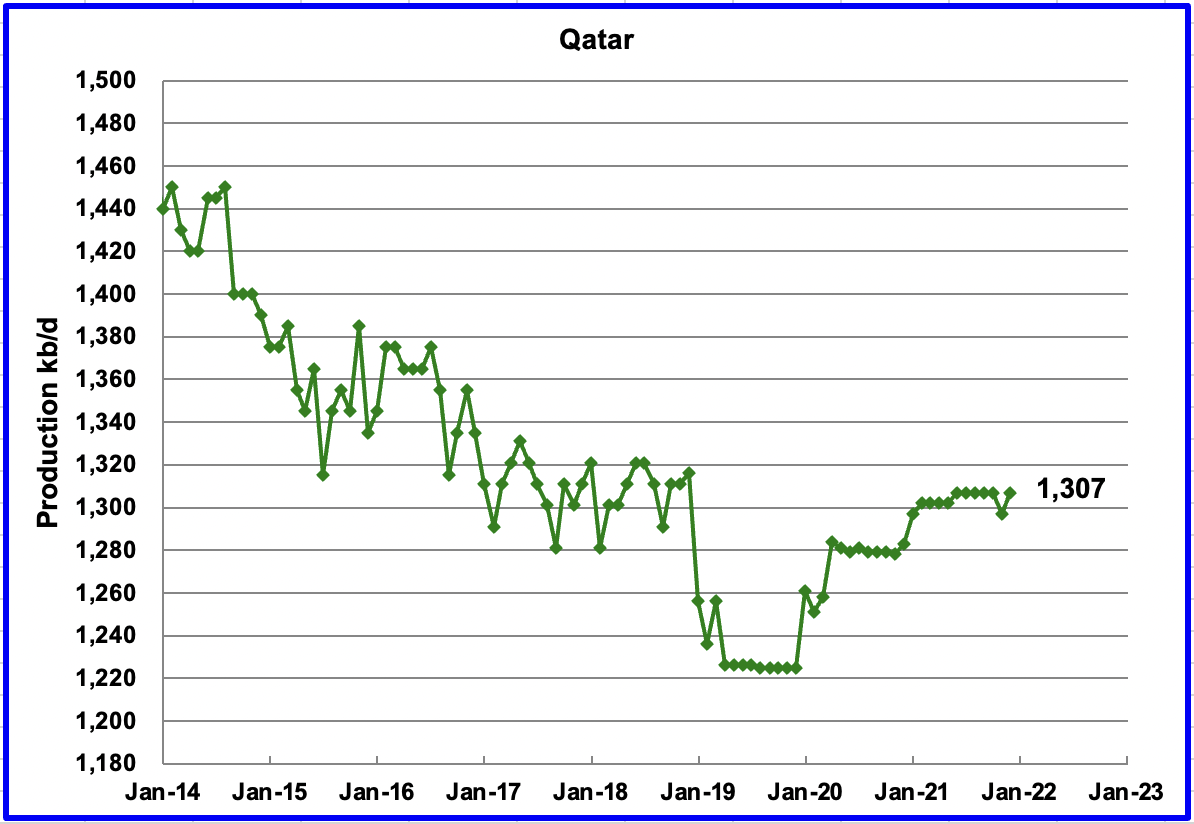
December’s output increased by 10 kb/d to 1,307 kb/d.
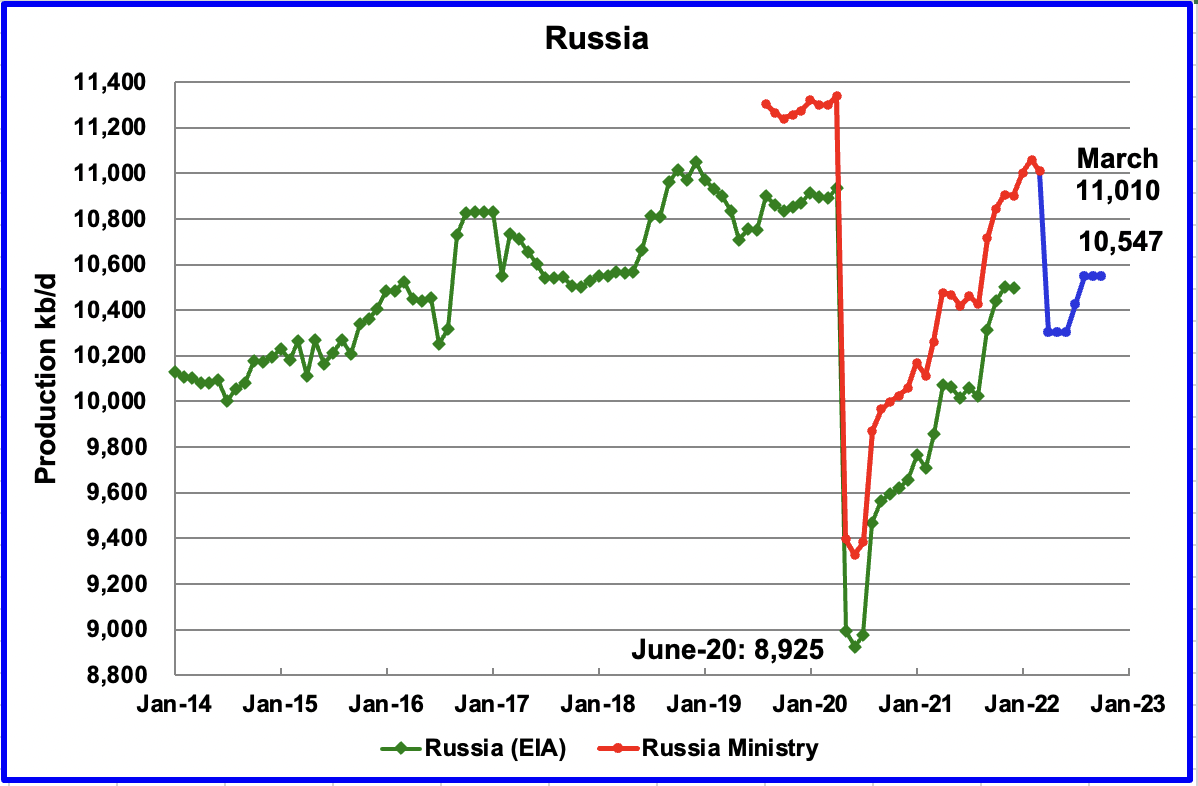
The EIA reported that Russian output decreased by 3 kb/d in December to 10,499 kb/d. According to this source, March’s production decreased by 50 kb/d to 11,010 kb/d. The blue graph represents the STEO’s forecast for Russian production up to October 2022 and beyond due to the imposition of economic sanctions by the U.S. and many other countries.
The Rusian C + C forecast was made by comparing the ratio of the STEO’s all liquids output with the Russian Ministry C + C output over the period October 2021 to February 2022. Russian C + C production was close to 97.5% of the STEO all liquids data. That percentage was used to generate the Blue graph.
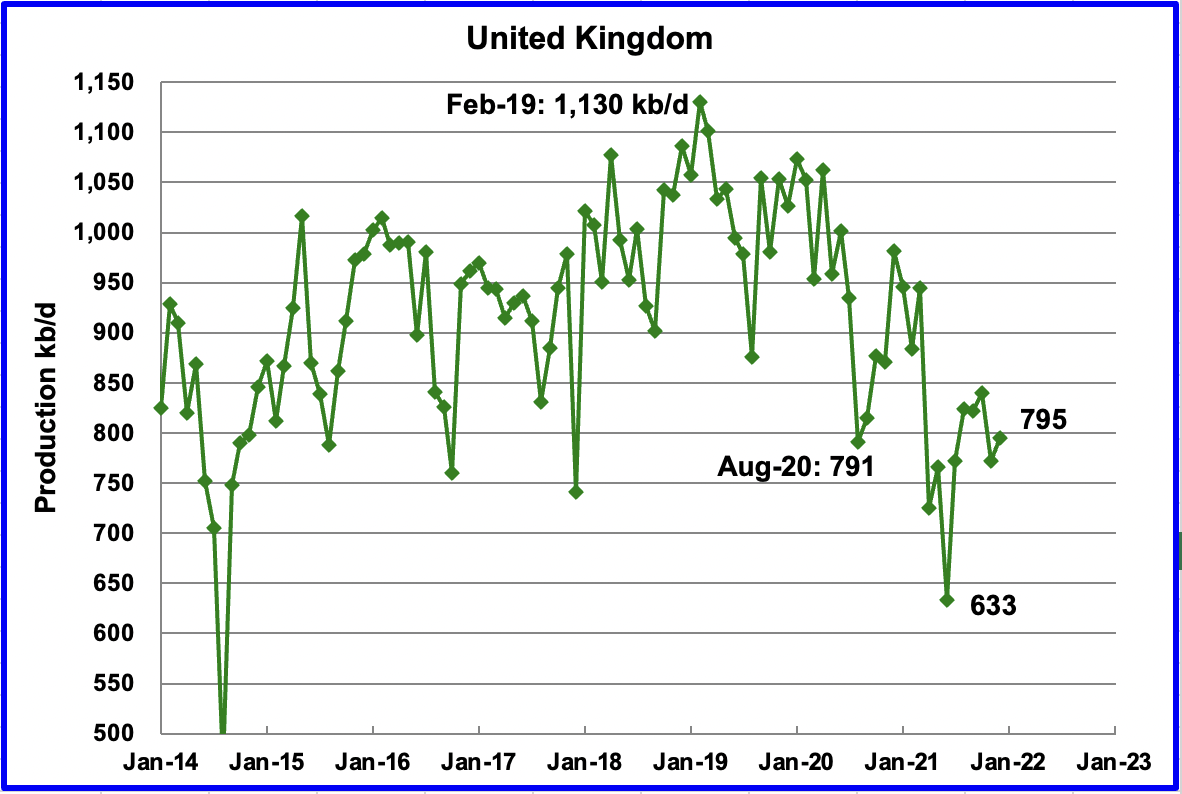
UK’s production increased by 23 kb/d in December to 795 kb/d. The chart indicates that UK oil production has entered a steep decline phase.
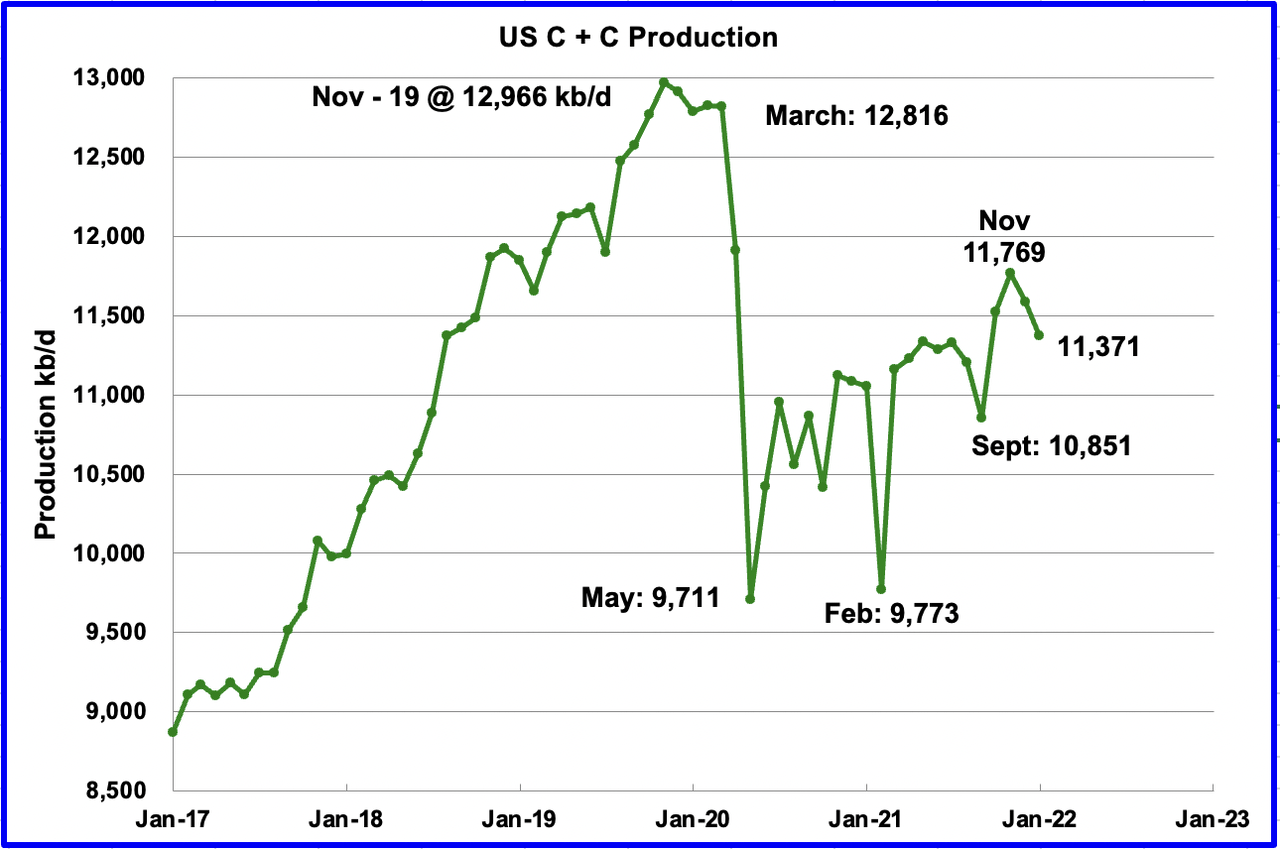
U.S. January production decreased by a surprising 216 kb/d to 11,371 kb/d. In December production dropped by 182 kb/d for a combined total of 398 kb/d from November to January. The main declining states were Texas 120 kb/d, New Mexico 31 kb/d and North Dakota 24 kb/d. Of the top 10 states, only Colorado increased its production. It is not clear if weather, geology or other issues contributed to the decline.
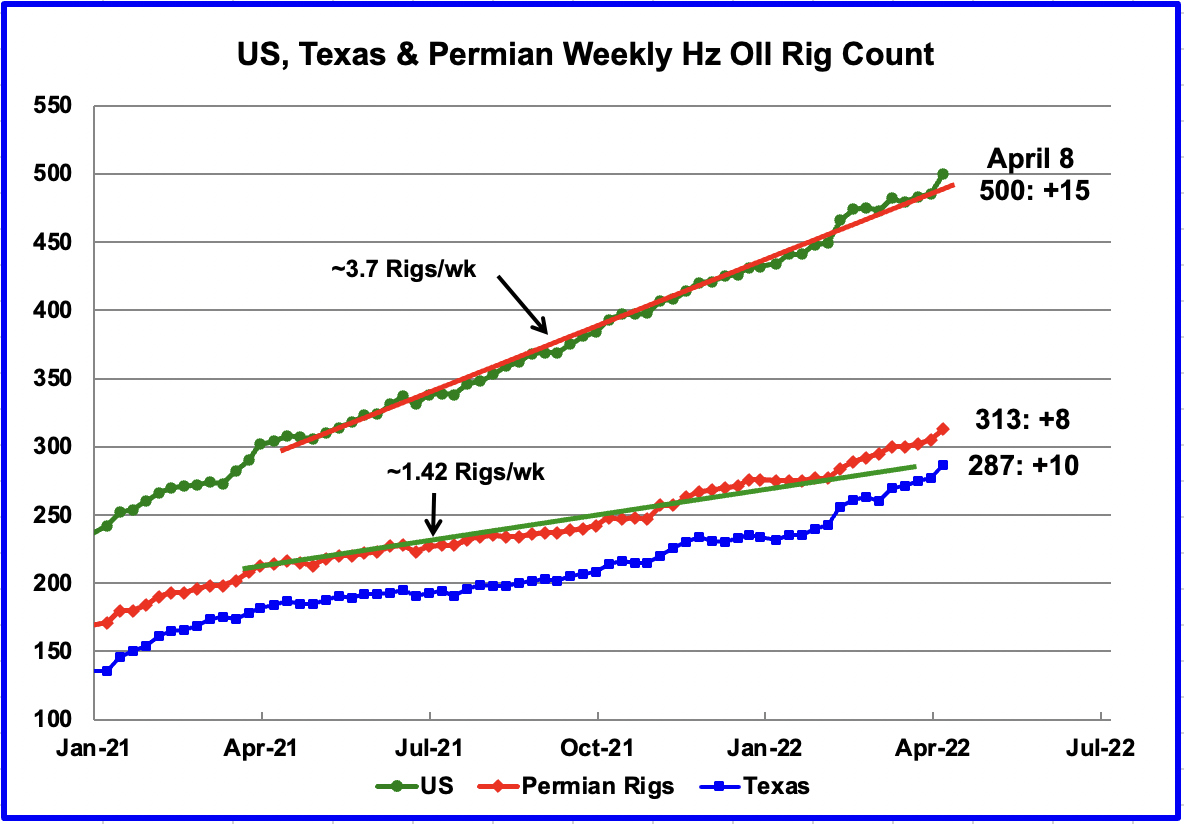
Something is changing/happening in the Texas Permian with regard to rigs.
From the beginning of April 2021 to the end of January 2022, the US has been adding horizontal oil rigs at an average rate of close to 3.7 rigs/wk. However since the beginning of February, rig additions have accelerated in the US and particularly in the Texas Permian.
For the week ending April 8, 15 horizontal oil rigs were added in the U.S. for a total of 500. Permian rigs increased by 8. In Texas, the rig count increased by 10.
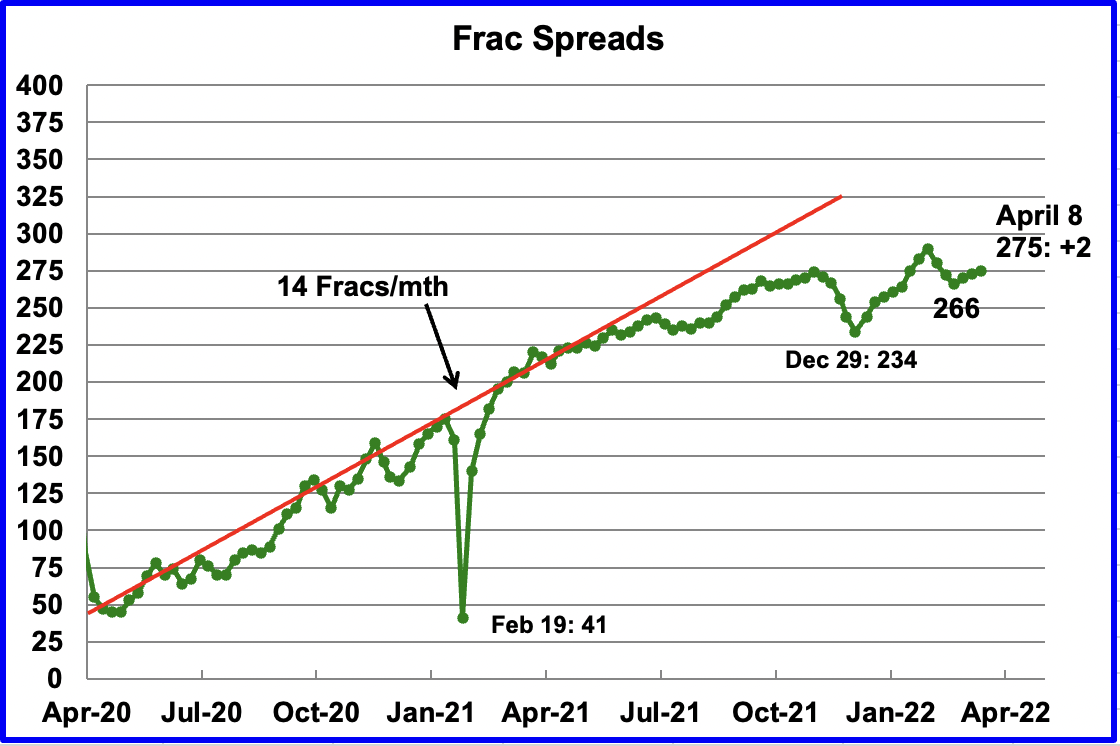
The growth in frac spreads is not keeping up with the growth in rigs.
Frac spreads hit a high of 290 at the end of February and dropped to a low of 266 in the week ending March 18. Since then 9 frac spreads have been added for a total of 275 in the week ending April 8. The graph appears to be indicating a slowing of frac spread additions with a possible plateau in the 275 region.
Note that these 275 frac spreads include both gas and oil spreads, whereas the rigs information is strictly oil rigs.
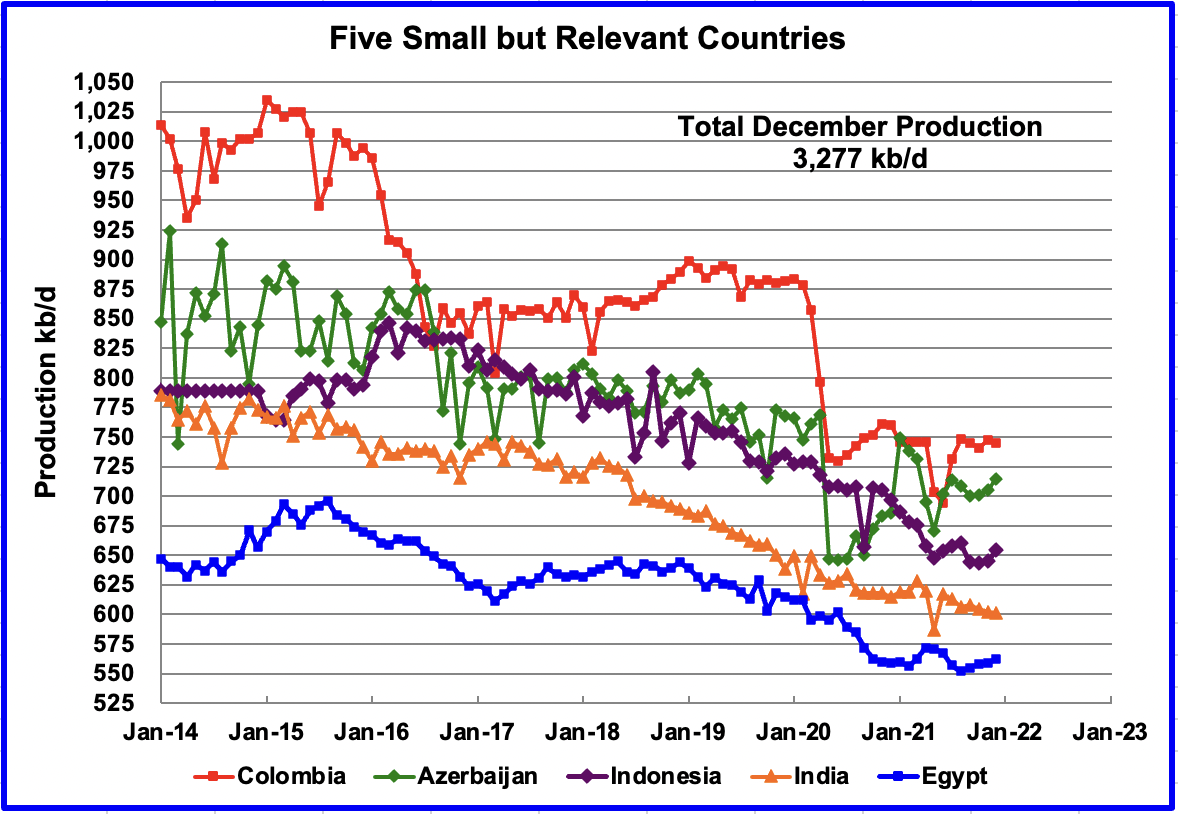
These five countries complete the list of Non-OPEC countries with annual production between 500 kb/d and 1,000 kb/d. Their combined December production was 3,277 kb/d, up by 17 kb/d from November.
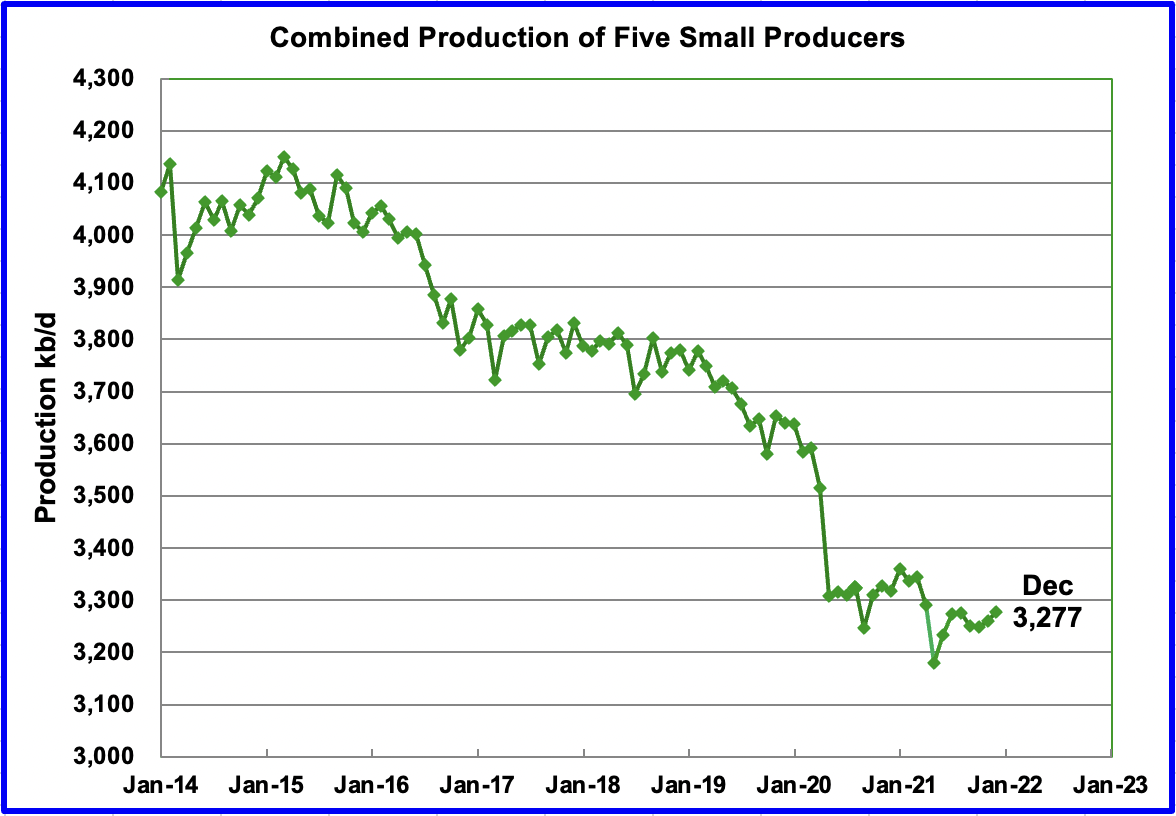
The overall output from the above five countries has been in a slow decline since 2015. The drop in May 2020 from 3,500 kb/d to 3,300 kb/d was primarily from Azerbaijan, 125 kb/d, which is a member of OPEC + and Colombia.
World Oil Production
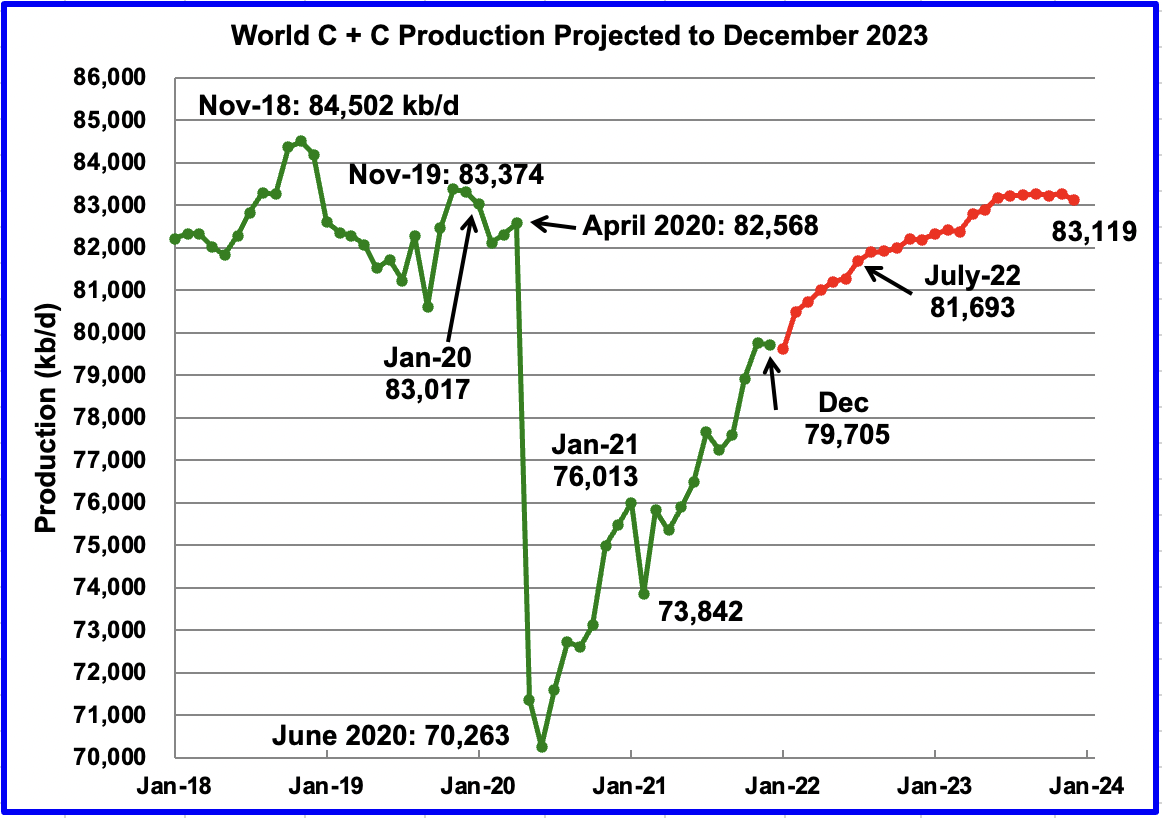
December’s world oil production decreased by 60 kb/d to 79,705 kb/d according to the EIA (Green graph). The 60 kb/d decrease was a combination of 3 large decreases, Ecuador 239 kb/d, US 205 kb/d and China 91 kb/d offset by Norway’s increase of 117 kb/d and many more with output below 100 kb/d, such as Guyana 86 kb/d.
This chart also projects world C + C production out to December 2023. It uses the March 2022 STEO report along with the International Energy Statistics to make the projection. (Red markers).
It projects that world crude production in December 2023 will be 83,119 kb/d, 173 kb/d higher than projected in the March report. It is also 102 kb/d higher than the January pre-covid rate of 83,017 kb/d and 1,383 kb/d lower than the November 2018 peak.
Could the plateauing shown in the later half of 2023 be the first indication that peak oil occurred in November 2018 at 84,502 kb/d?
Editor’s Note: The summary bullets for this article were chosen by Seeking Alpha editors.
Be the first to comment