

code6d/iStock Unreleased via Getty Images
In this analysis of Nike Inc. (NYSE:NKE), we examined the company and compared it with competitors in terms of its branding based on its NPS score, Google Trends and social media presence in terms of Facebook likes. Based on this, we determined whether the company derives an advantage from its branding and projected its share of growth.
Moreover, we looked into its revenue by sales channel as it shifts away from third-party distributors to its retail and online stores. We analyze its margins from these segment channels to determine the potential impact on its future profitability.
Lastly, we looked into its geographic revenue breakdown and identified the key regions driving its growth. We analyze its growth opportunity across different regions based on the market forecast CAGR to determine its growth outlook internationally.
Leading Sportwear Brand
Company Data, Khaveen Investments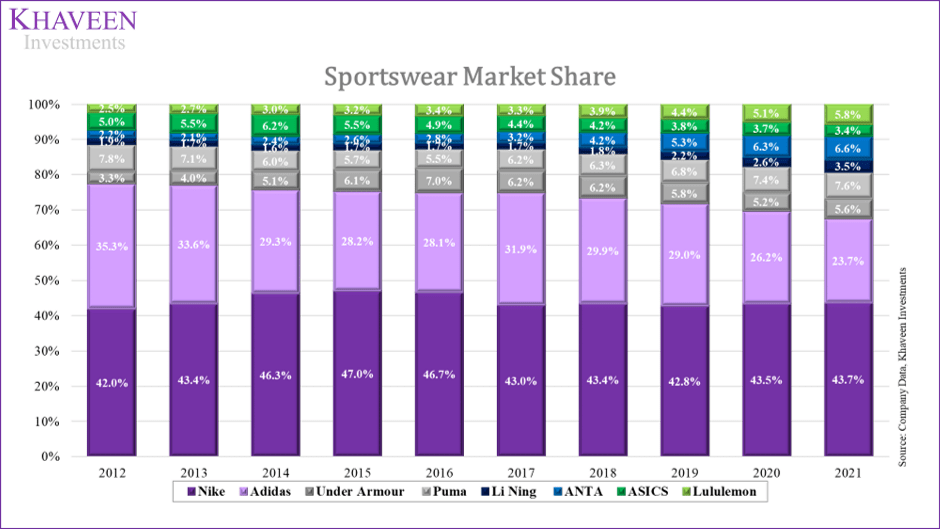
Source: Company Data, Khaveen Investments
In the past 10 years, Nike’s market share had increased and maintained its position as the market leader with a market share almost twice that of adidas. On the other hand, its closest competitor adidas had seen its market share consistently decline in the past 10 years. In terms of average revenue growth, adidas was tied with Asics with the lowest average growth in the past 10 years. Other brands which solidified their market share include Under Armor and Puma while Asics unperformed the market. China-based brands such as Li Ning and Anta experienced the strongest growth during the period and had the highest share gain among competitors but remain relatively smaller players compared to Nike.
To analyze Nike’s branding, we examined several metrics such as its Net Promoter Score (NPS) from Comparably which is a measure of consumer satisfaction. Additionally, we also compiled its average Google Trends scores in the past 5 years to gauge its online search interest. Besides that, we collected the number of likes across these companies’ social media platforms including Facebook (the largest social media platform) and calculated its 3-year growth rate.
|
Branding |
NPS Score |
Google Trends |
Facebook 3-year Growth% |
|
Nike |
52 |
73 |
8.5% |
|
adidas |
42 |
25 |
11.8% |
|
Asics |
50 |
3 |
17.1% |
|
Puma |
38 |
10 |
5.8% |
|
Under Armour |
45 |
4 |
9.3% |
|
Lululemon |
38 |
18 |
28.5% |
|
Average |
44.2 |
22.2 |
13.5% |
Source: Comparably, Google Trends, Trackalytics, Facebook, Khaveen Investments
Based on the table, we see that Nike had above-average NPS and Google Trends scores as well as a higher-than-average number of social media followers across all 3 platforms. Nike had the highest NPS and Google Trends score of all of its competitors. In terms of social media presence, it had below-average growth while Lululemon had the highest growth. However, its total follower base is higher than all competitors except for adidas. Overall, we believe this highlights its superior branding as an advantage to the company as the market leader. To project its growth, we derived the % difference between its NPS score from the average score to determine its share of growth. We derived the market growth rate forecast based on the weighted forecast CAGR of the apparel, footwear and sports equipment market.
|
Market CAGR |
Market Size ($ mln) |
Weight |
CAGR |
|
Apparel Market |
1,710,939 |
72.8% |
3.39% |
|
Footwear Market |
488,289 |
20.8% |
7.65% |
|
Sports Equipment |
150,624 |
6.4% |
6.53% |
|
Weighted Total |
2,349,852 |
100.0% |
4.48% |
Source: Statista, Khaveen Investments
Based on our derived difference of each company’s NPS score from the average, we multiplied the % average difference of NPS and Google Trend scores with the market CAGR forecast to project each company’s 5-year forward growth rate through 2026. This leads to a revenue growth rate forecast of 10.01% for Nike but we tapered it down by 1% per year as a conservative assumption. For Li Ning and Anta, we forecasted both companies based on the market forecast CAGR instead due to the lack of NPS data for these companies.
|
Company |
NPS Score Difference from Average % |
Google Trends Difference from Average % |
Average Difference % |
5-year Forecast Growth Rate |
|
Nike |
117.7% |
329.3% |
223.5% |
8.0% |
|
adidas |
95.1% |
112.8% |
103.9% |
4.7% |
|
Asics |
113.2% |
13.5% |
63.4% |
2.8% |
|
Puma |
86.0% |
45.1% |
65.6% |
3.9% |
|
Under Armour |
101.9% |
18.0% |
60.0% |
4.2% |
|
Li Ning |
N/A |
N/A |
N/A |
4.5% |
|
Anta |
N/A |
N/A |
N/A |
4.5% |
|
Lululemon |
86.0% |
81.2% |
83.6% |
3.7% |
Source: Khaveen Investments
Company Data, Khaveen Investments
All in all, we believe that Nike has a solid branding advantage based on its NPS and Google Trends scores higher than its competitors. We expect this to continue supporting Nike’s strong market positioning and forecasted its share of growth higher than the market forecast at a 5-year average forward rate of 8% and gaining some market share at the expense of competitors such as Asics, Puma, Under Armour and Lululemon.
Shift to Direct Sales Channel
The company sells through 2 main channels which are Nike DIRECT (‘DTC’) and wholesale. Nike DIRECT involves the company selling through its owned retail stores and digital platforms. In 2017, Nike announced its Consumer Direct Offense and Triple Double strategy. According to Nike, through the strategy, the company will focus on key growth markets globally, enhancing product innovation and unifying its Nike Direct business unit to improve customer experiences. Moreover, the company outlined its plan to focus on selected retail partners such as Nordstrom (JWN) and Foot Locker (FL). It had cut off several retailers including Dillard’s, DSW, Urban Outfitters (URBN) and Shoe Show.
Based on its annual report, the company claims that its DTC business revenue has higher margins than its wholesale business. According to Wedbush Securities, its DTC margin was estimated to be 62% compared to 38% for its wholesale business in 2018.
To identify the benefit of Nike’s direct selling strategy, we examined the incremental impact of Nike DIRECT on its total gross margins as disclosed in its annual report.
|
Nike DTC Revenue ($ bln) |
2016 |
2017 |
2018 |
2019 |
2020 |
2021 |
Average |
|
DTC Revenue ($ bln) |
7.86 |
9.08 |
10.43 |
11.75 |
12.38 |
16.37 |
|
|
Growth % |
18.6% |
15.5% |
14.9% |
12.7% |
5.4% |
32.2% |
18.20% |
|
DTC as % of Total Revenue |
24.3% |
26.4% |
28.7% |
30.0% |
33.1% |
36.8% |
|
|
Nike Wholesale |
-7.83 |
-9.05 |
-10.39 |
-11.71 |
-12.34 |
-16.33 |
|
|
Growth % |
18.6% |
15.6% |
14.9% |
12.7% |
5.4% |
32.3% |
18.24% |
|
Nike Revenue |
32.4 |
34.4 |
36.4 |
39.1 |
37.4 |
44.5 |
|
|
Growth % |
5.8% |
6.1% |
6.0% |
7.5% |
-4.4% |
19.1% |
7.49% |
|
Nike Gross Margins |
46.24% |
44.58% |
43.84% |
44.67% |
43.42% |
44.91% |
44.80% |
|
Increase in Nike Gross Margins from DTC |
0.20% |
1.00% |
-0.10% |
0.20% |
-0.10% |
-0.40% |
0.20% |
Source: Nike, Khaveen Investments
Based on the table above, Nike’s DTC as a % of revenue had consistently increased over the past 8 years as its DTC revenue growth outpaced its wholesale revenue growth. Based on its annual report, the company reported an increase in margins from DTC at an average of 0.2% per year. Overall, Nike’s gross margins had been overall rather stagnant in the past 8 years despite the growth of its DTC business.
|
Nike Digital Commerce Revenue ($ bln) |
2016 |
2017 |
2018 |
2019 |
2020 |
2021 |
Average |
|
Nike Digital Commerce Sales |
1.7 |
2.2 |
2.8 |
3.8 |
5.5 |
9.1 |
|
|
Growth % |
29.4% |
27.3% |
35.7% |
44.7% |
65.5% |
40.52% |
|
|
Digital Commerce Sales as % of Revenue |
5.3% |
6.4% |
7.7% |
9.7% |
14.7% |
20.4% |
|
|
Nike Non-Digital Commerce Sales |
30.7 |
32.2 |
33.6 |
35.3 |
31.9 |
35.4 |
|
|
Growth % |
4.8% |
4.5% |
5.1% |
-9.7% |
11.1% |
3.17% |
|
|
Nike Revenue |
32.4 |
34.4 |
36.4 |
39.1 |
37.4 |
44.5 |
|
|
Growth % |
5.8% |
6.1% |
6.0% |
7.5% |
-4.4% |
19.1% |
7.49% |
Source: Nike, Khaveen Investments
Moreover, in terms of e-commerce sales, the table above shows the growth of Nike’s digital commerce revenue which outpaced that of its non-digital commerce sales and driving its total revenue growth over the past 6 years. Additionally, we compiled each companies’ online sales and calculated the % of online sales over their total sales.
|
Branding |
Online Sales ($ bln) |
Total Revenue ($ bln) |
Online Sales % |
|
Nike |
9.1 |
44.54 |
20.4% |
|
adidas |
EUR 3.942 |
EUR 21.23 |
18.6% |
|
Asics |
JPY 51.7 |
JPY 328.7 |
15.7% |
|
Puma |
0.504 |
7.7 |
6.5% |
|
Under Armour |
0.897 |
5.7 |
15.7% |
|
Li Ning |
1.07 |
3.55 |
30.0% |
|
Anta |
1.96 |
6.76 |
29.0% |
|
Lululemon |
2.31 |
5.86 |
39.4% |
|
Average |
8.9 |
53.0 |
22% |
Source: Company Data, eCommerceDB
Despite growing rapidly, Nike’s online sales as a % of total revenue are still below the average of its competitors in the table above. In comparison, Lululemon leads by having the highest online sales % of revenue followed by the China-based competitors including Li Ning and Anta which both have higher online sales % than Nike. Though, Nike’s online sales value is higher than all competitors in the table.
To forecast the company’s gross margins going forward accounting for the shift to DTC, we assumed its DTC revenue growth to continue outpacing its total revenue growth with an 8-year historical growth rate, reaching 66.4% by 2026. We assumed its gross margins from DTC to increase by 0.2% per year based on its past 8-year average in our forecast.
|
Nike Gross Margin Forecast |
2021 |
2022F |
2023F |
2024F |
2025F |
2026F |
|
Nike DTC Revenue ($ mln) |
16,370 |
19,349 |
22,869 |
27,030 |
31,949 |
37,762 |
|
Growth % |
18.20% |
18.20% |
18.20% |
18.20% |
18.20% |
|
|
DTC % of Revenue |
36.8% |
41.3% |
44.4% |
47.7% |
51.3% |
55.1% |
|
Nike Wholesale |
28,168 |
29,646 |
30,538 |
30,653 |
29,776 |
27,670 |
|
Growth % |
5.2% |
3.0% |
0.4% |
-2.9% |
-7.1% |
|
|
Nike Revenue ($ mln) |
44,538 |
48,995 |
53,407 |
57,683 |
61,725 |
65,432 |
|
Growth % |
10.0% |
9.0% |
8.0% |
7.0% |
6.0% |
|
|
Gross Margins |
44.91% |
44.91% |
45.11% |
45.31% |
45.51% |
45.71% |
|
Increase in Margins from DTC |
-0.40% |
0.20% |
0.20% |
0.20% |
0.20% |
0.20% |
|
Net Gross Margins |
45.11% |
45.31% |
45.51% |
45.71% |
45.91% |
|
|
Increase in gross profit from DTC ($ mln) |
38.7 |
45.7 |
54.1 |
63.9 |
75.5 |
Source: Company Data, Khaveen Investments
Nike, Khaveen Investments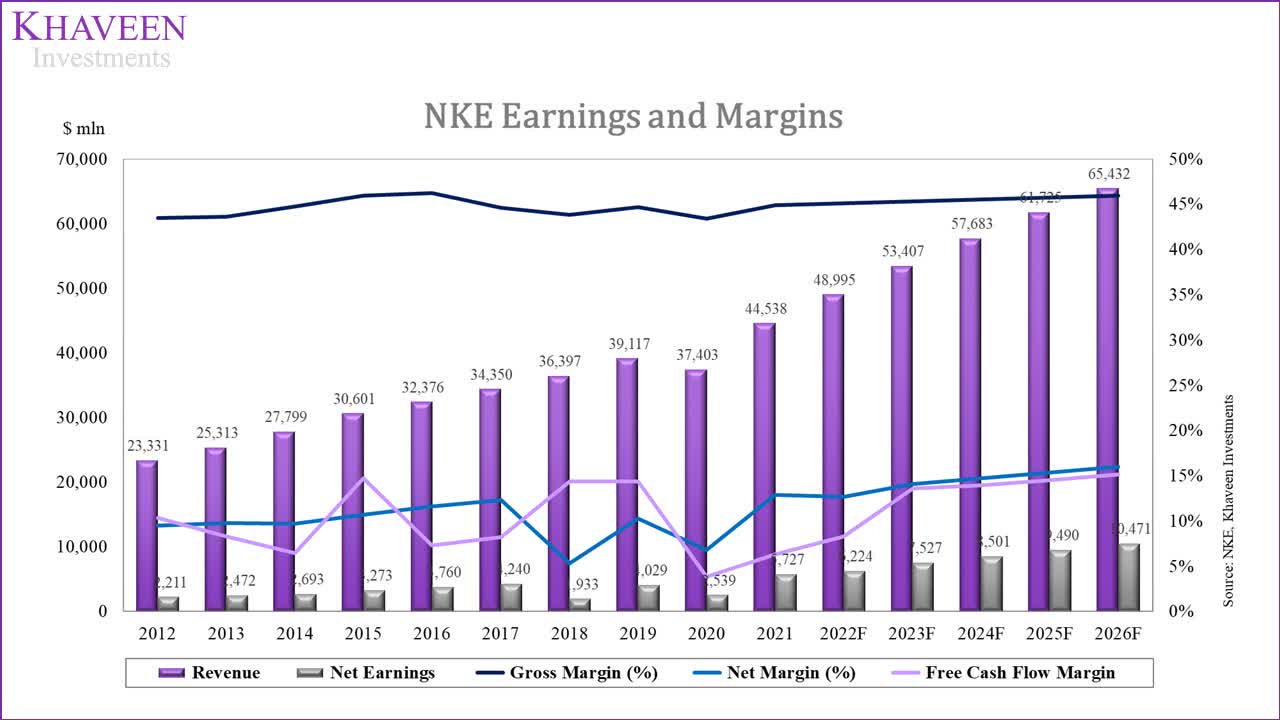
All in all, the superior growth of its DTC and e-commerce revenue compared to its non-DTC and traditional commerce revenue growth had led to the share of DTC and e-commerce revenue increasing. We believe the company’s DTC and e-commerce business revenue could continue increasing as it outlined its Consumer Direct Offense and Triple Double strategy and focus on key retailers. We expect this to lead to a positive impact on its gross margins at a forecasted margin of 45.9% by 2026 based on its historical average increase of 0.2% per year.
International Segment Revenue Growth
Nike, Khaveen Investments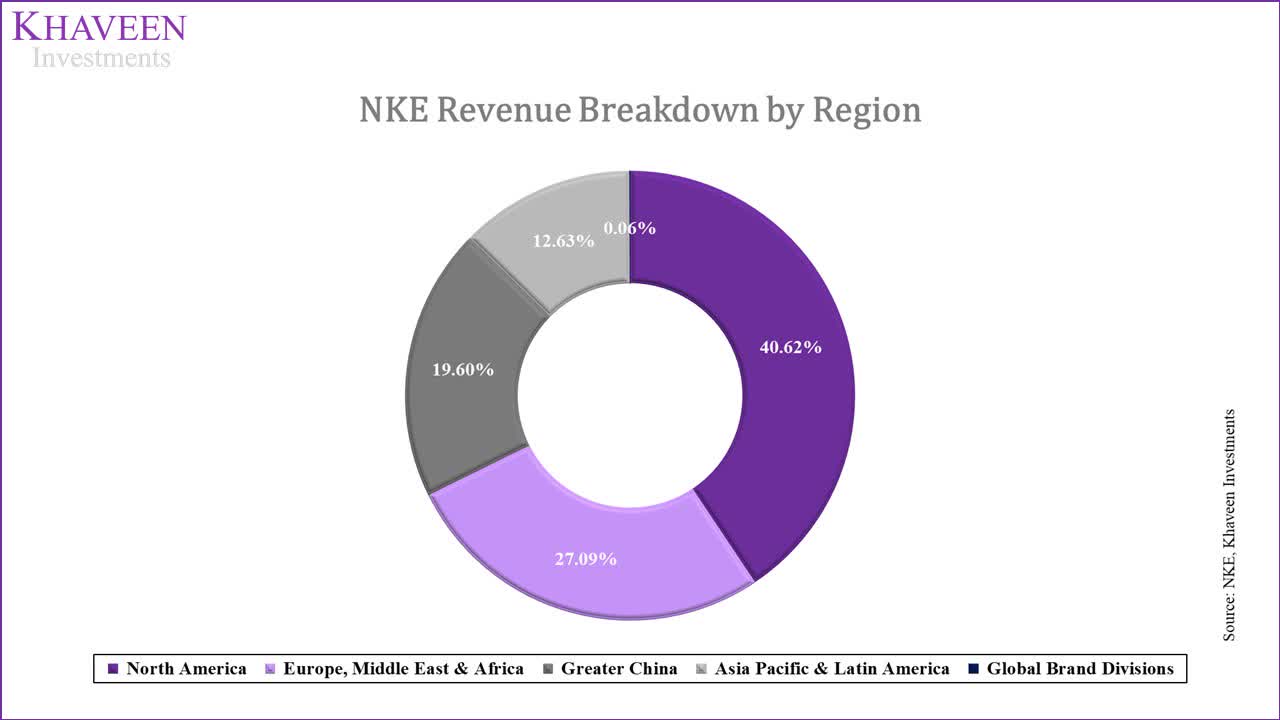
|
Company Past 5-year Geographic Revenue Growth % |
North America |
EMEA |
Greater China |
Asia Pacific & Latin America |
|
Footwear |
5.2% |
7.0% |
17.4% |
4.7% |
|
Apparel |
1.4% |
13.8% |
17.6% |
6.1% |
|
Equipment |
-6.6% |
5.9% |
8.9% |
-6.7% |
|
Total |
3.5% |
9.1% |
17.1% |
4.5% |
Source: Nike
Nike is an international brand in more than 170 countries. Its geographic revenue breakdown is split into North America, EMEA, Greater China and the Asia Pacific & Latin America. Based on its 2021 breakdown, North America is its largest market by revenue followed by EMEA and Greater China. However, China had its growth engine with the highest growth rate followed by EMEA and the Asia Pacific which also highlights its growth success internationally. In terms of product categories, footwear had been its highest growing category in North America, but Apparel was the highest growth in all of its international segments whereas Equipment had consistently the lowest growth in all regions.
To determine its international growth outlook, we compared the market forecasted growth CAGR through 2025 of each of its product categories across North America, China, Europe, South America, Africa and Asia to identify the highest growth markets.
|
Geographic Regions |
Apparel Market ($ mln) |
Apparel CAGR |
Footwear Market |
Footwear CAGR |
Sports Equipment |
Sports Equipment CAGR |
Average |
|
North America |
390,124 |
2.38% |
106,818 |
4.06% |
22,503 |
5.31% |
3.92% |
|
China |
318,978 |
4.43% |
80,446 |
9.85% |
34,622 |
7.39% |
7.22% |
|
Europe |
498,094 |
2.72% |
137,622 |
5.39% |
26,321 |
4.60% |
4.24% |
|
South America |
59,849 |
4.34% |
53,916 |
13.42% |
6,707 |
7.91% |
8.56% |
|
Africa |
64,098 |
5.48% |
17,711 |
13.10% |
11,919 |
9.44% |
9.34% |
|
Asia (excluding China) |
343,229 |
4.16% |
82,908 |
9.13% |
44,942 |
6.95% |
6.75% |
|
Average |
3.92% |
9.16% |
6.93% |
Source: Statista, Khaveen Investments
According to the table, in the apparel market, both Europe and Asia plus China are the largest markets, but Asia has higher growth compared to Europe. Although the two smallest markets, both Africa and South America have higher growth than the average. Similarly in the footwear and sports equipment markets, both Africa and South America are the smallest but have the highest growth rates. While China does not have the highest growth rates, it has higher than average growth across all 3 product categories.
We plotted Nike’s revenue in a bubble chart by its geographic segments and product categories namely Footwear, Apparel and Equipment with the size of each bubble representing Nike’s revenue for the product category in that region. The axes represent the market size on the horizontal axis and the market forecast CAGR on the vertical axis derived from the table above. Then, we determined the midpoint of both axes based on the average market CAGR and market size.
Company Data, Statista, Khaveen Investments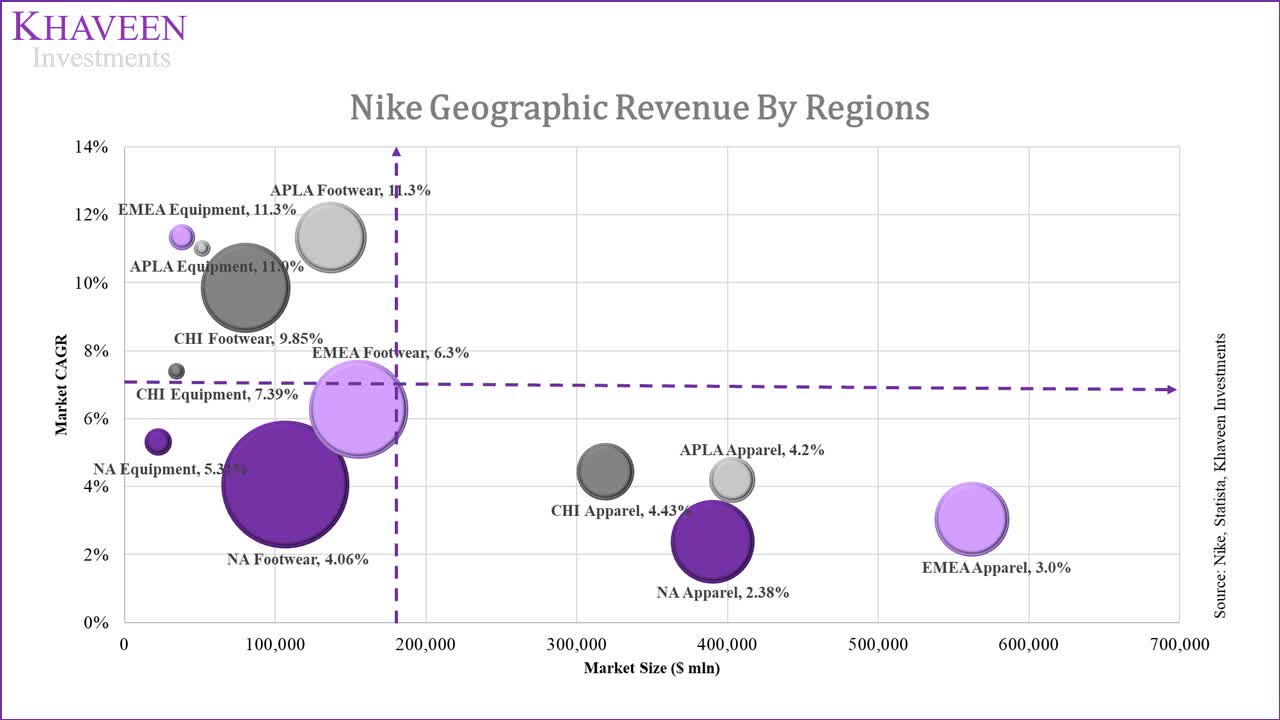
From the chart, we observe Nike’s revenue streams in all quadrants except for the top right quadrant. More of the company’s revenues are concentrated in the bottom half of the chart which is lower growth. For its high growth segments, most of its revenues which are from footwear in the quadrant are concentrated on the left side of the chart, indicating a smaller market opportunity based on the market size.
We observed that across all geographic regions that Nike’s footwear is its largest product category followed by Apparel. In terms of footwear, Nike’s largest market in North America has the lowest growth rate. While EMEA is a larger market, China and Asia Pacific & Latin America have higher growth forecasts. Similarly, in apparel, Nike derives the largest revenue contribution from North America but has the lowest growth rate compared to the other regions. The Asia Pacific & Latin America has the highest growth rate for apparel, but EMEA presents the largest market opportunity in size. Lastly, the equipment market is the smallest among the three but has higher growth rates than the apparel market in all regions. The equipment market shows strong growth in EMEA and Asia Pacific & Latin America. Overall, we expect that although Nike’s revenue contribution had been the highest from North America, its home market, we see the company’s international revenue growth being driven by growth in China, EMEA and Asia Pacific & Latin America. Notwithstanding, as its revenue streams are concentrated in the top left and bottom half of the chart, we believe this indicates a limited growth outlook for the company as a whole.
Risk: Stronger Competition in China Market
Nike depended on the Greater China market which was the key geographic revenue growth driver for the company and represents 20% of its total revenue. According to Bloomberg, China-based competitors including Li Ning and Anta gained market share on Alibaba’s (BABA) Tmall (largest e-commerce company in China) by 12 percentage points and stood at 21% combined in January 2022. Additionally, based on Bloomberg data, foreign brands’ sales in the country declined by 24% while domestic brands such as Li Ning and Anta had strong revenue growth of 60.4% and 24.3% respectively in 2021. Thus, we believe this highlights the increasing competition from domestic brands which could pose a risk to Nike’s growth in the country accounting for 20% of its revenues.
Valuation
We projected the company’s revenues in the table below based on our derived forward revenue growth rate tapered down by 1% as a conservative assumption as discussed in the points above.
|
Nike Projections ($ mln) |
2020 |
2021 |
2022F |
2023F |
2024F |
2025F |
2026F |
|
Revenue |
37,403 |
44,538 |
48,995 |
53,407 |
57,683 |
61,725 |
65,432 |
|
Growth % |
-4.38% |
19.08% |
10.01% |
9.01% |
8.01% |
7.01% |
6.01% |
Source: Nike, Khaveen Investments
To value the company, we used a DCF analysis as we expect the company to continue generating positive cash flows. Our terminal value is based on the industry average of selected competitors at an EV/EBITDA average of 19.10x.
Seeking Alpha, Khaveen Investments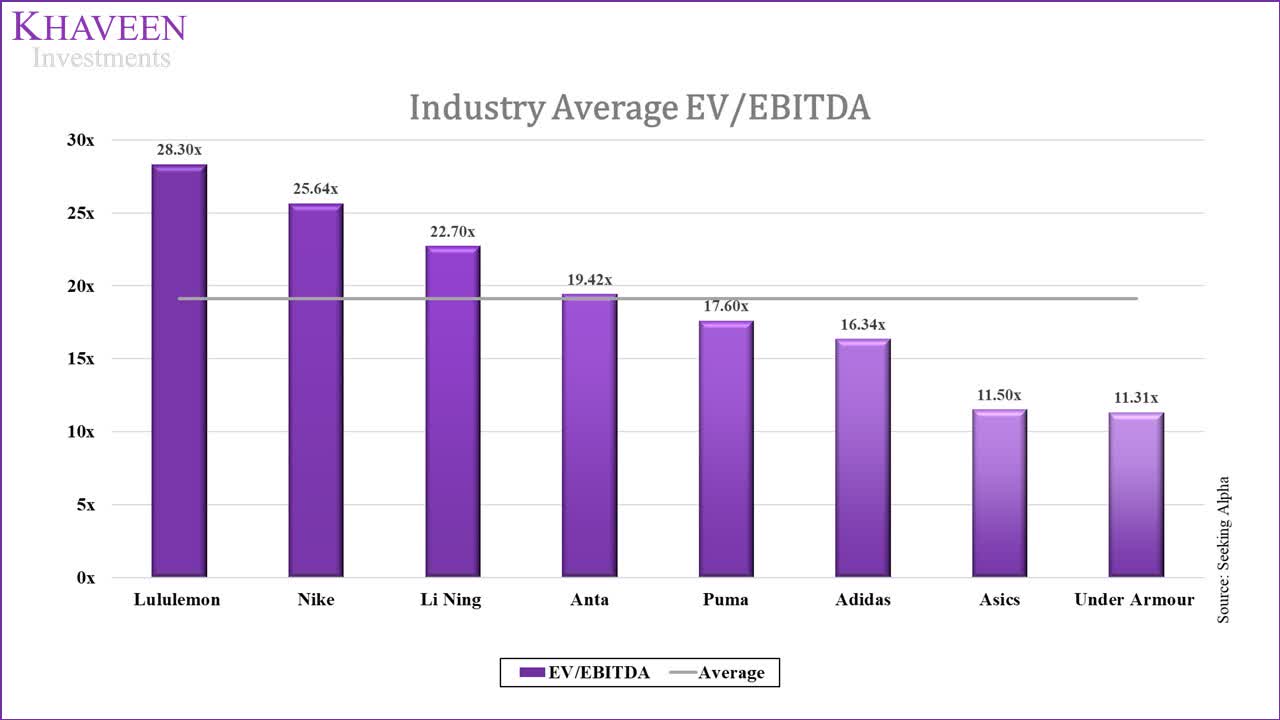
Based on a discount rate of 8.6% (company’s WACC), our model shows that its shares are fairly valued.
Khaveen Investments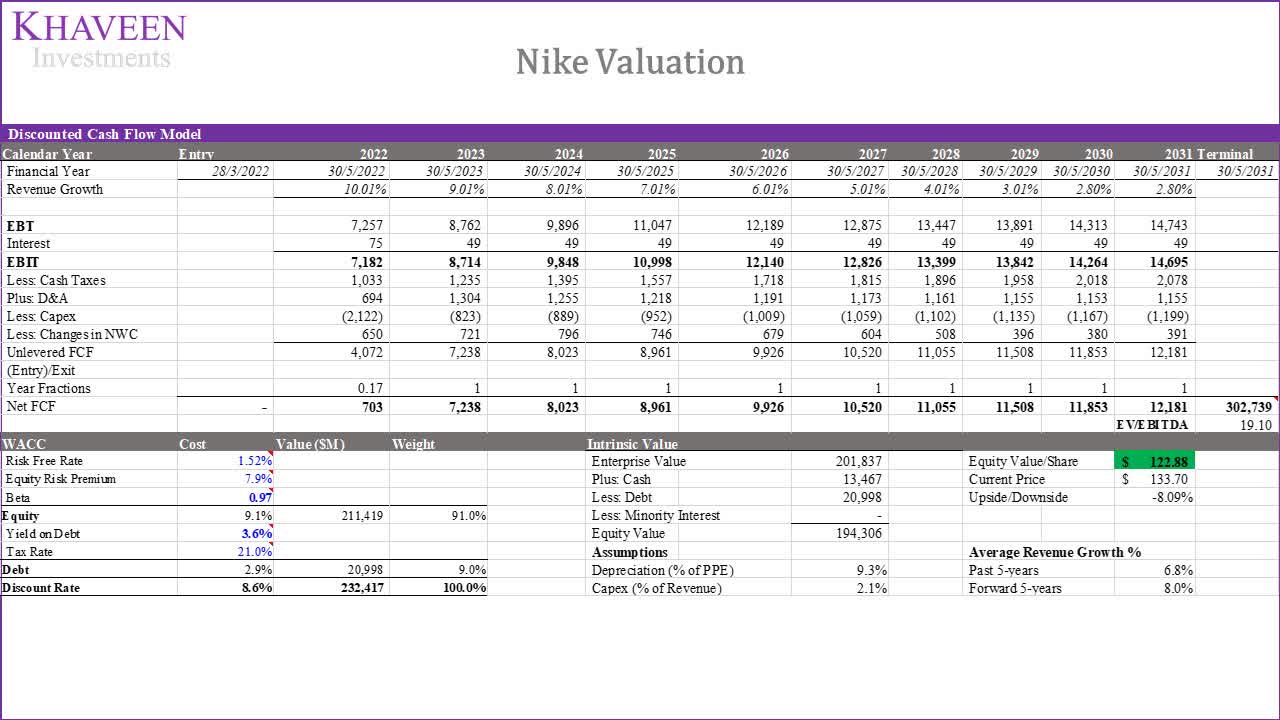
Verdict
All in all, we determined that Nike has superior branding than its competitors as it has the highest NPS and Google Trends score among its competitors despite its lower Facebook presence growth. Based on this, we believe the company could leverage its branding advantage to solidify its market leadership and projected its share of the growth of the total market at a 5-year average forecast revenue growth rate of 8%. Moreover, we examined its shift towards DTC and concluded its positive impact on its gross margins at an average increase of 0.2% per year and expect its margins to continue rising to 45.9% by 2026 with its Consumer Direct Offense and Triple Double strategy. Lastly, we analyzed its international revenue segments where Greater China had been its growth driver. We plotted its revenue segments based on market forecast CAGR and size and determined that the company has a limited growth outlook as a whole based on our bubble chart where most of its revenue segments are concentrated in the smaller and lower growth quadrants. Overall, we rate the company as a Hold with a target price of $122.88.
Be the first to comment