

iQoncept/iStock via Getty Images
Investment Thesis
NKE YTD Stock Price
Seeking Alpha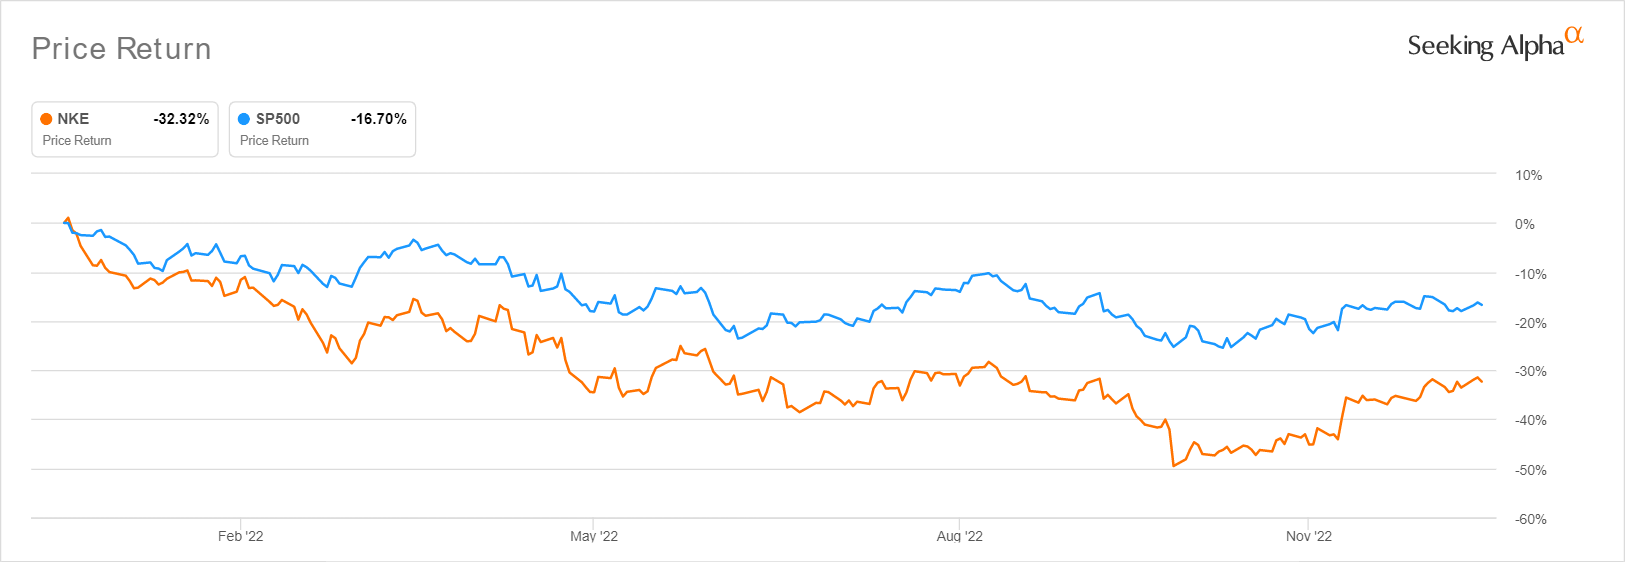
Despite the tragic -32.32% correction YTD, the NIKE, Inc. (NYSE:NYSE:NKE) stock continued to offer excellent 5Y total price returns of 80.7% and 10Y returns of 414%. However, seeing that it has also recovered by 34.08% since the October bottom, it is apparent that the stock has been remarkably buoyed by China’s unexpected reopening and the Fed’s 50 basis point pivot. The country accounted for 16.14% of the company’s revenues in FY2022 and 18.61% in FY2021, despite the previous hardline Zero Covid Policy. Therefore, we reckon that market analysts are right in that NKE may outperform over the next few quarters, due to the flurry of revenge spending during the reopening cadence.
However, that theory has also led to a massive baked-in premium on NKE’s valuations, indicating minimal upsides in the short term. Therefore, investors who still choose to nibble at current levels should also size their portfolios accordingly, in the event of volatility.
NKE May Impress Through FY2025, With Improved Balance Sheet Performance
NKE Revenue, Net Income ( in billion $ ) %, EBIT %, and EPS
S&P Capital IQ
For its upcoming FQ2’23 earnings call, NKE is expected to report decent YoY revenue growth of 10.6% and EPS of -21.3%, due to the tougher YoY comparison. Furthermore, due to the rising inflationary pressures, elevated operating costs, and inventory strain, the company may face impacted gross margins of -1.9 percentage points and EBIT margins of -2.2 percentage points, compared to pre-pandemic levels. Thereby, triggering a notably lower EPS of $0.65 for the upcoming quarter, despite the continuous expansion in its top line to $12.57B.
NKE Balance Sheet ( in billion $ ) %
S&P Capital IQ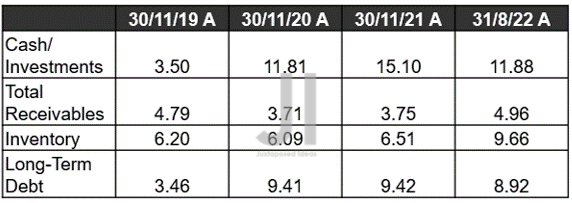
On the other hand, we must applaud NKE’s management as well, in the tremendous improvement in the balance sheet. By FQ1’23, the company reported impressive cash/ investments of $11.88B and total receivables of $4.96B. Thereby, triggering a lower net debt level of $0.71B, compared to FQ1’20 levels of $3.17B.
However, this positive development is also countered by NKE’s eye-watering $9.66B of inventories by the latest quarter, possibly attributed to lower-than-expected consumer demand during the worsening macroeconomics. We’ll see, since the November CPI report has shown improved sequential demand for apparel by 0.2%, compared to October levels of -0.7%. As a result, its inventory levels may potentially decline to healthier levels by FQ2’23, significantly aided by the recent Thanksgiving and Black Friday festivities. We’ll see.
NKE FCF ( in billion $ ) % and Dividends
S&P Capital IQ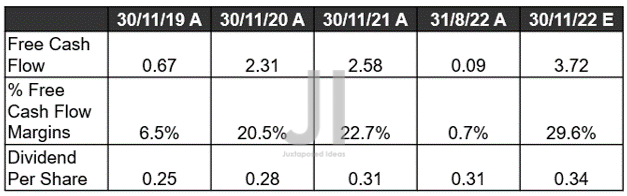
As a result, it is not surprising that market analysts are also expecting NKE to deliver expanded Free Cash Flow [FCF] generation of $3.72B and FCF Margins of 29.6% for FQ2’23. Thereby, securing its next quarterly dividend as well, in line at $0.34.
NKE Projected Revenue, Net Income ( in billion $ ) %, EBIT %, EPS, FCF %, Dividends, and Debt
S&P Capital IQ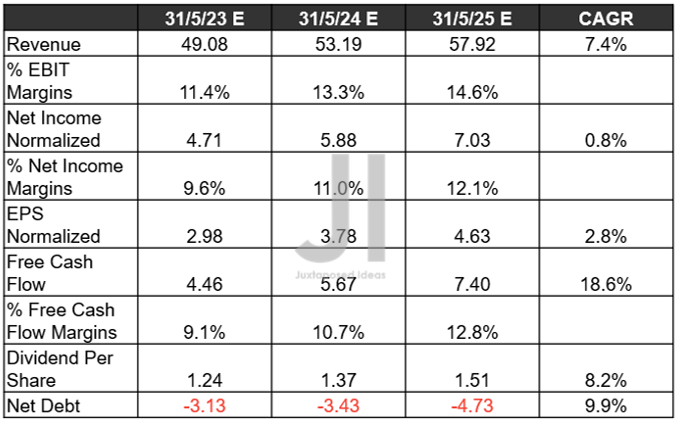
Market analysts are confident about NKE’s forward execution as well, due to the sustained expansion in its top and bottom line growth through FY2025 at a CAGR of 7.4% and 2.8%, respectively. More than decent indeed, in comparison to pre-pandemic levels of 6.5%/4.9% and hyper-pandemic levels of 6.1%/19.6%.
In addition, NKE is expected to sustain its expanded EBIT/ net income/ FCF margins from 12.2%/10.3%/12.2% in FY2019, 14.3%/14.7%/9.5% in FY2022, and finally to 14.6%/12.1%/12.8% by FY2025. As a result, ensuring the health of its balance sheet to -$4.73B of net debts, while also expanding its dividends paid out to $1.51 at the same time. Naturally, those who had added at the rock-bottom levels of $83.12 in October would have seen a decent dividend yield of 1.82% by FY2025, against its 4Y average of 0.92% and sector median of 2.09%.
In the meantime, we encourage you to read our previous article on NKE, which would help you better understand its position and market opportunities.
- Add NIKE: Just Do It At The Time Of Maximum Pain
So, Is NKE Stock A Buy, Sell, or Hold?
NKE 5Y EV/Revenue and P/E Valuations
S&P Capital IQ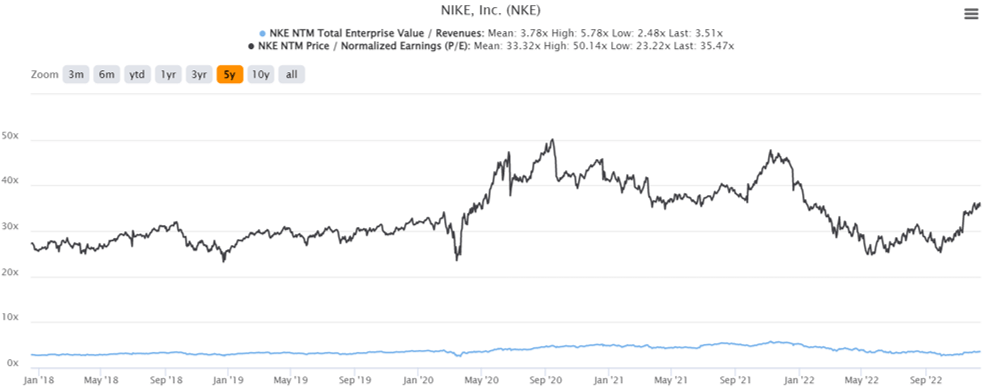
Due to the stellar financial projections, it is no wonder that the NKE stock is trading at a premium NTM P/E of 35.47x, higher than its 5Y mean of 33.32x and YTD mean of 30.40x. Based on its FY2025 EPS of $4.63 and current P/E valuations, the stock may appear undervalued now, with an ambitious 47.34% upside to a price target of $164.22. However, we reckon those numbers are overly optimistic, in comparison to consensus estimates of $114.06. Thereby, indicating a minimal margin of safety for those who choose to add at current levels.
NKE may indeed deliver excellent earning calls over the next few quarters, triggering a moderate recovery ahead. However, we prefer to exercise caution for now, since the Feds will raise interest rates through 2023, further complicated by China’s fast and furious reopening cadence. The latter’s robust consumer demand may potentially askew Powell’s dovish hopes and trigger a prolonged inflationary pain through 2024, pointing to more uncertainties in the intermediate term.
As a result, we prefer to rate the NKE stock as a buy only below $100s, for an improved margin of safety for the next decade portfolio growth and investing. Do not chase this rally.
Be the first to comment