

imaginima/iStock via Getty Images
Thesis
This is an update on an article that I published about half a year ago, back in May 2022. The article, entitled “NextEra Energy And VPU: Worst Time In A Decade To Buy Utilities”, cautioned readers about the risks in both the utility sector as represented by the Vanguard Utilities ETF (NYSEARCA:VPU) and also NextEra Energy (NYSE:NEE). My concern is mostly twofold as detailed in the article. And I foresee the rising interest rates to both pressure their profit (both raising borrowing costs) and their valuation multiples.
1. The utility sector’s (represented by VPU) yield spread relative to risk-free rates is among the lowest level in a decade at that time
2. At an individual stock level, its leader NEE is even more expensively valued. The premium of NEE valuation relative to VPU is near the highest level in a decade (and remember that VPU itself is near its highest premium relative to the treasury rates).
Fast-forward to now, the risk-free interest rates did increase as expected. The 10-year Treasury rates climbed by about 68 basis points from 2.88% then to the current level of 3.56%. However, both VPU and NEE prices have held up as you can see from the following chart. To wit, VPU’s price stayed almost flat (changed only 0.15% since then) and NEE’s price actually went up by 9.2% since then. Due to these price changes, both VPU and NEE’s P/E multiples have expanded since my last writing. In VPU’s case, its P/E multiple has increased from 23.6x in May to the current level of 24.0x. And in NEE’s case, it increased from 27.2x to 29.3x.
This update, therefore, discusses the implications of these two developments in detail. And the conclusion is that the risks in both the utility sector and its leader NEE have become even higher now. As such, I am changing my rating from “hold” back in May to “sell”.
Source: Seeking Alpha data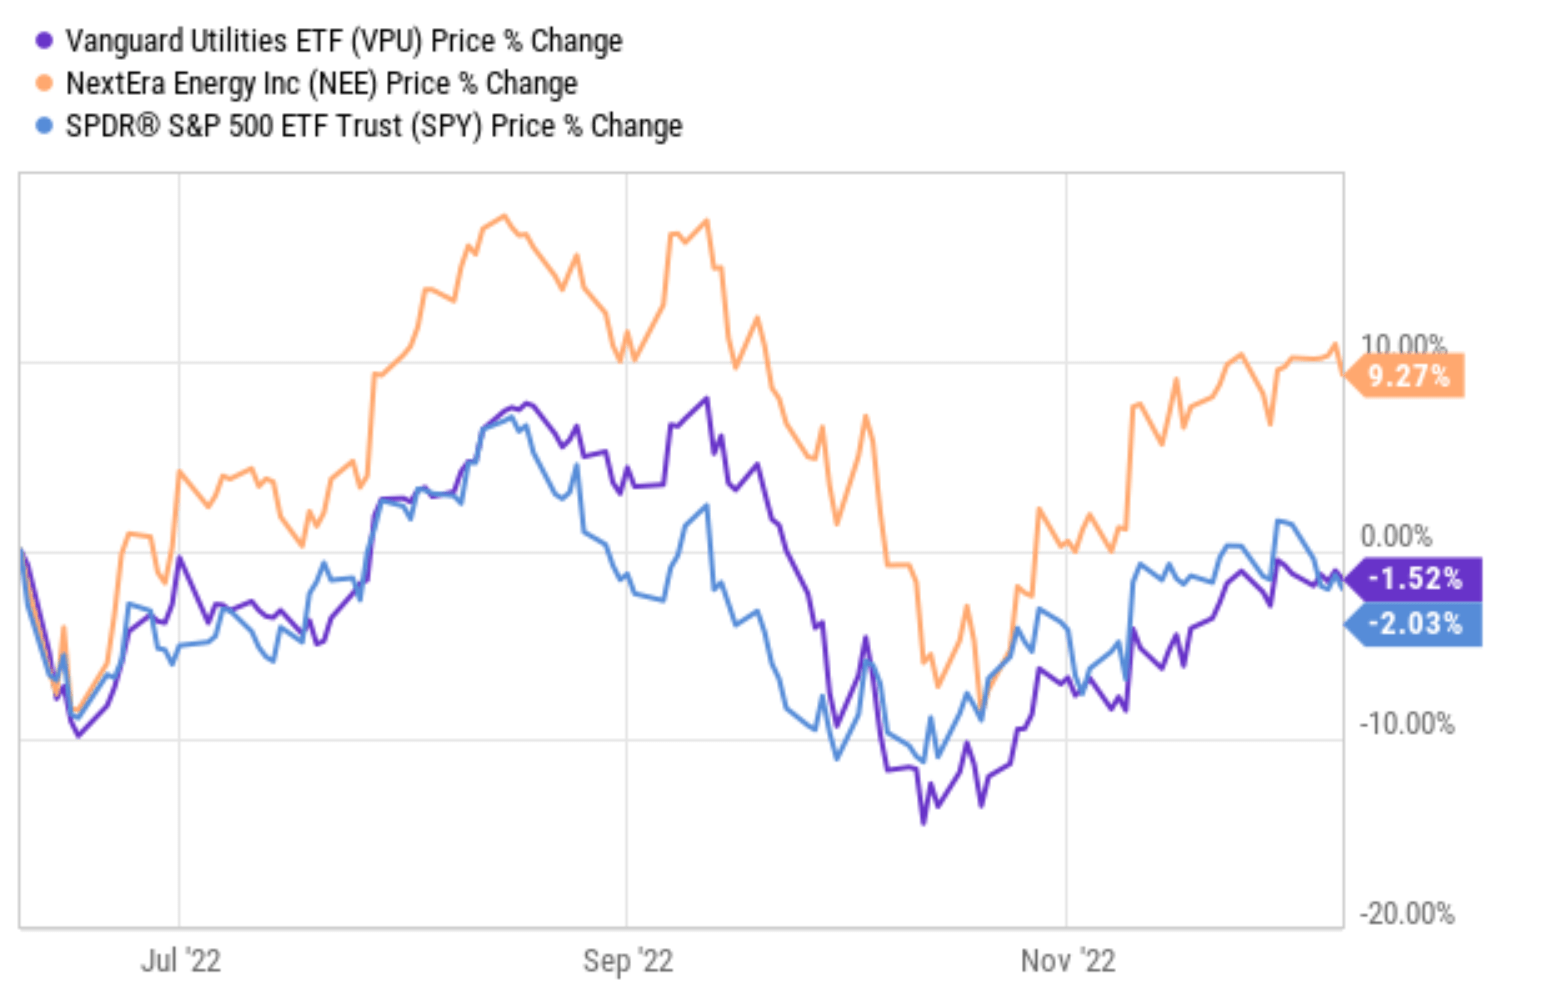
A macroscopic view
As a top-down investor, let me first start with a macroscopic view as shown in the market sector dashboard below. The mechanics of the market dashboard are detailed in our earlier article here and you are welcome to download it here.
As seen, the utility sector currently is the most expensively valued sector in terms of its yield spread (“YS”) relative to the 10-year Treasury rates. To wit, the YS Z-score is at a negative 2.59, meaning its risk premium relative to risk-free interest rates is worse than a two-sigma event.
Source: Author based on Seeking Alpha data
Once we get a sense at the macroscopic level, we also like to check out a few individual stocks. Sometimes, a sector’s valuation is heavily biased by one or two leading stocks (and you just need to avoid those stocks). But in the case of the utility sector here, it is not the case as you can see from the comparison between NEE and the sector in the next table. As seen, NEE is even more overvalued than VPU across all metrics: about 22% by P/E ratio, 96% by P/BV ratio, and 208% by P/S ratio. Note that the data in this table are gleaned from either Yahoo! Finance or Seeking Alpha after the market closed on Dec 9.
As we will detail later, NEE certainly deserves a premium over the sector given its scale, growth potential, and superior profitability (as shown in the ROE and margin comparison below). However, as to be elaborated on later, my view is that its superiority cannot justify such a large premium.
Source: Author based on Yahoo and Seeking Alpha data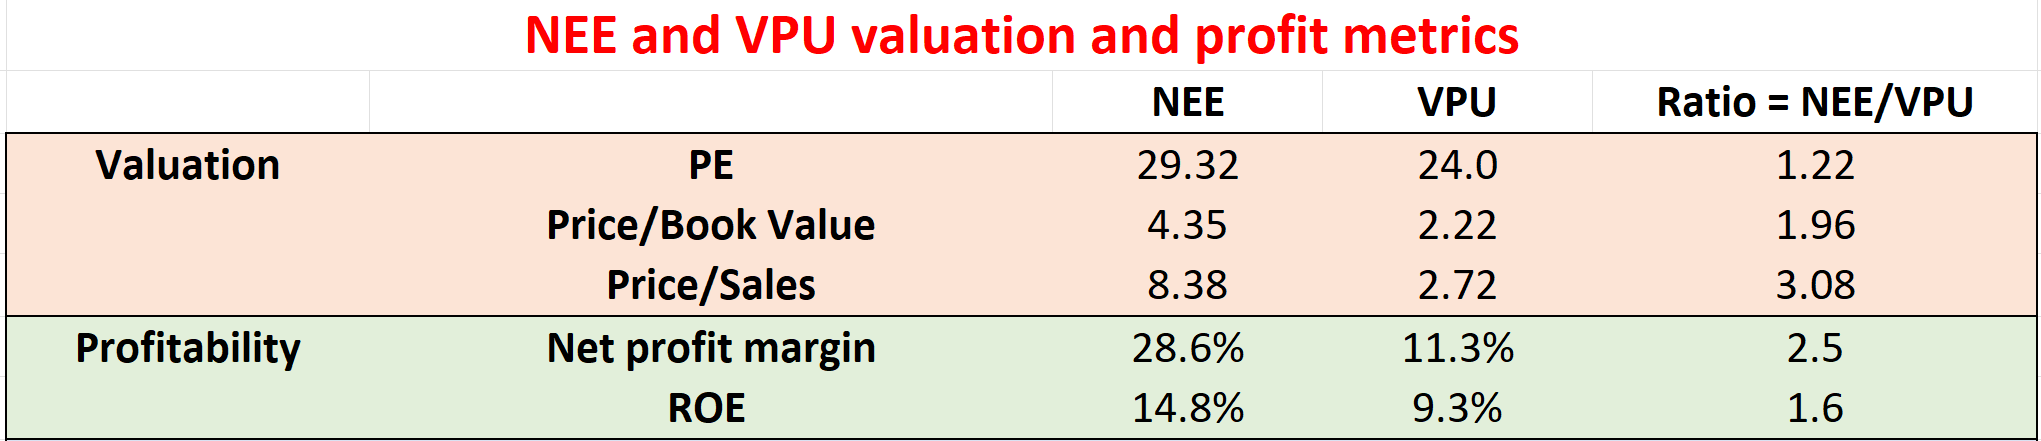
VPU and NEE – basic information
Let me quickly introduce both first. VPU is a popular ETF in the utility space. It holds 68 stocks, all in the utility space as you can get a good idea from the following list of its 10 holdings. Also as seen, NEE is its largest holding by far. NEE currently represents 13.94% of VPU’s total assets, more than 2x than its next largest holding (Duke Energy (DUK)). NEE is a holding company for Florida Power & Light Company (FPL), which provides electricity to roughly 5.8 million customers in eastern, southern, and northwestern FL. NEE, through its subsidiaries, engages in a multitude of operations in the generation of electricity through wind, solar, nuclear, coal, and natural gas facilities.
Thanks to its scale and efficiency, NEE has delivered superior returns to the sector as a whole in the past as seen from the 2nd chart below. NEE has delivered a total return of 16.55% CAGR, more than 7% above VPU’s 9.18% CAGR (which is already a very respectable level of return by itself).
Source: Seeking Alpha data Source: Portfolio Visualizer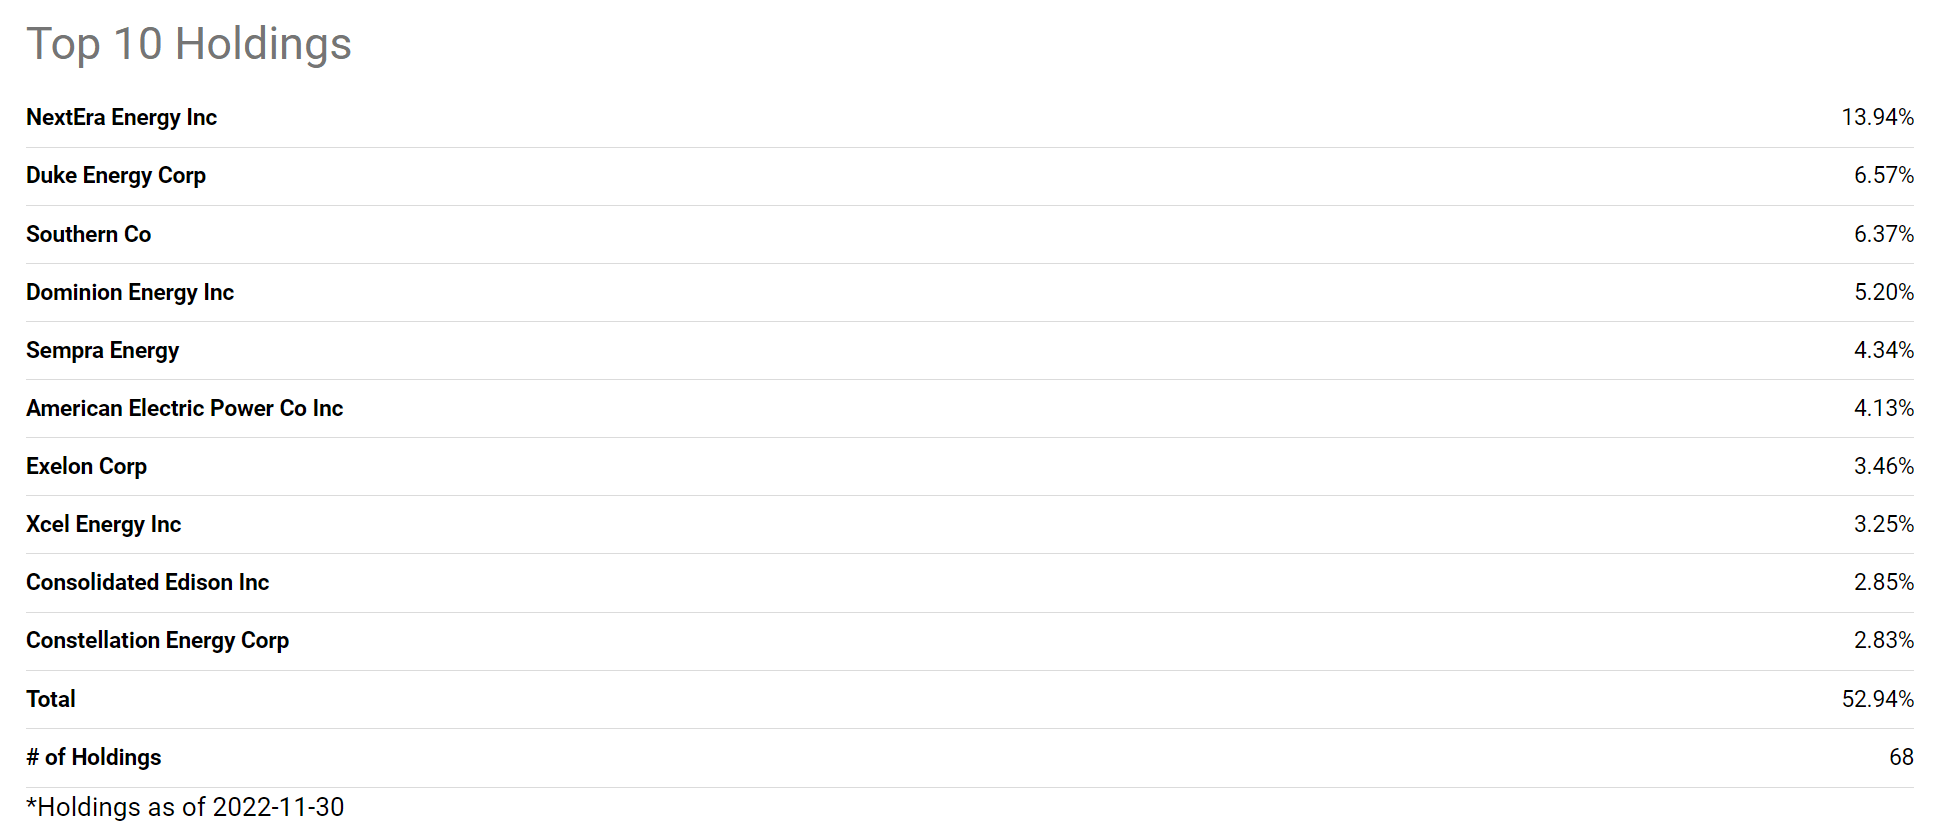

NEE and VPU: Profitability
NEE’s superior returns root in its business model, superior profitability, and also a very healthy local economy. The Sunshine State attracts strong migration and is experiencing one of the fastest U.S. population growth rates in recent years. Florida’s unemployment rate of 2.7% remains below the national average and at its lowest level in over 15 years. Meanwhile, distribution and transmission (D&T) expansion, and reliability/hardiness projects in storm-challenged Florida, are leading to rapid growth in the utility’s rate base (property, plant, and equipment on which utilities are allowed to earn an economic rate of return).
All told, NEE was able to maintain a robust ROCE (return on capital employed) and a really low level of cost of capital as shown in the chart below. To wit, NEE’s ROCE has been fluctuating only in a quite narrow range from about 7.0% to 12%, with an average of 9.4% in the past 10 years. In the meantime, its WACC (weight average cost of capital) is only 5.7% on average, leaving a wide gap of 3.7% on average for profitability.
For VPU, its average ROE (return on equity) is 9.3%, close to NEE’s ROCE. As detailed in our earlier writings, ROCE is a more fundamental metric than ROE. And in the case of utility stocks, ROE tends to overestimate profitability. And therefore, the fact that NEE’s ROCE is slightly above VPU’s ROE provides another supporting data point for its superior profitability (in addition to the margin comparison in an earlier section).
Source: Author based on Seeking Alpha data
NEE and VPU: Projected returns
However, I do not see NEE’s superior profitability as being able to justify its valuation premium, as shown in the projected return comparison below.
As seen, NEE is valued at 29.1x FW P/E ratio, about 39% above the historical average of 21.0x. In terms of dividends, its current yield of 2.01% is about 16% below its historical average yield of 2.40%, also signaling a large premium. Because of such valuation premium, for the next 3~5 years, the total return potential is quite limited even assuming a healthy growth rate of 5.5%. As a reference point, its EPS growth in the past 10 years is about 7%. My projections are in a range of a small loss of 6% (the low-end projection) to a total gain of 30% (the high-end projection), translating into an annual return between -1.5% to 6.7%.
Source: Author based on Seeking Alpha data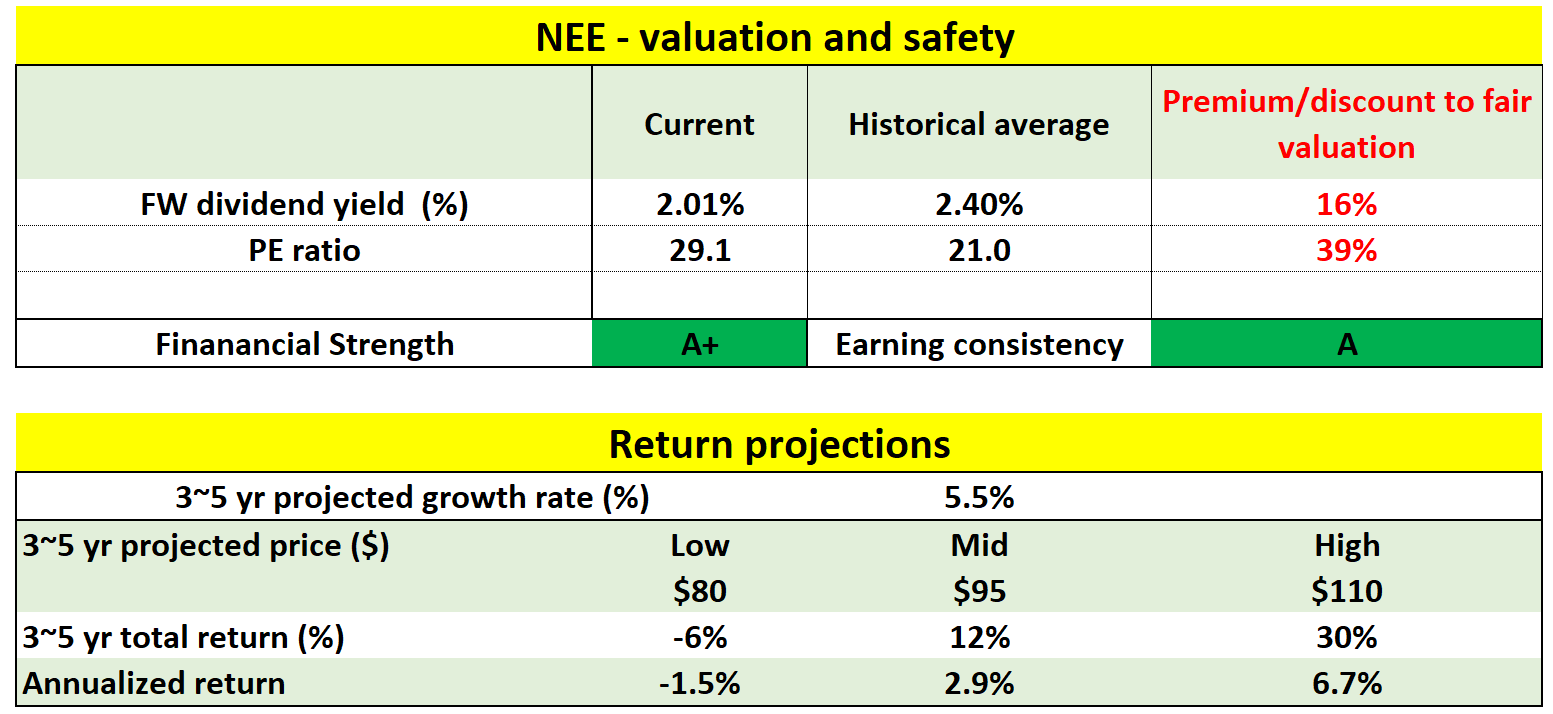
For VPU, the picture is slightly better (because of the lower valuation premium), but still uninspiring. In terms of dividends, VPU’s current yield of 2.88% is only about 5.2% below its historical average yield of 3.04%, signaling a small premium. For VPU, I assumed a 4% growth rate, slower than NEE to account for NEE’s superior scale and profitability as discussed above. As a sector, I expect to grow at the same pace of real GDP growth (assumed to be about 2%) plus an inflation adjustment (assumed to be 2% also).
As you can see, under these assumptions, my projections for VPU are in a range of a small gain of 4% (the low-end projection) to 27% (the high-end projection), translating into an annual return between -0.9% and 6.2%.
Source: Author based on Seeking Alpha data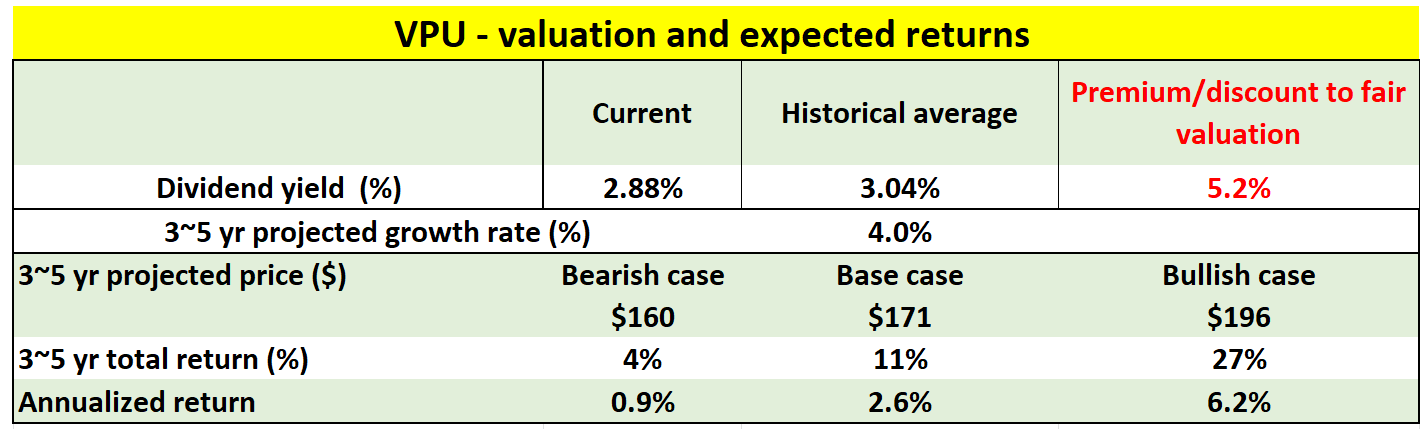
Other risks and summary
To recap, given the interest rate hikes and also the valuation expansion since May 2022, my thesis is that the risks in both the utility sector as a whole (represented by VPU) and also NEE have become even higher now. Besides the risks posed by higher interest rates and high valuation premiums, both the sector and NEE also face some policy uncertainties. Renewable energy is a burgeoning market for both the sector and also NEE. The U.S. tax incentives for renewables were set to expire after 2025. The recently passed Inflation Reduction Act (IRA) is expected to help keep this market flourishing in the years to come after the tax incentive’s expiration. However, the specific level of support from the IRA is unclear at this point.
All told, I see very limited upside for both VPU and NEE for the next few years. My projected annual returns are in the range of a small loss to mid-single digits (about 6%). As such, I am changing my ratings from “hold” back in May to “sell” for both VPU and NEE.
Be the first to comment