

sitox
A few days ago, I wrote an article titled “5 REITs That Blackstone Should Gobble Up” and in that list I mentioned the following real estate investment trusts (“REITs”) poised for a takeover:
- BRT Apartments (BRT)
- Gaming and Leisure (GLPI)
- Plymouth Industrial (PLYM)
- UMH Properties (UMH)
- STORE Capital (STOR).
As I began to ponder the overall cheapness of many REITs within the iREIT coverage spectrum I became fixated on NexPoint Residential Trust, Inc. (NYSE:NXRT), a multifamily REIT that owns 41 properties, consisting of 15,387 units, across 11 markets in 7 Southeastern and Southwestern U.S. states.
As of June 3, 2022, the portfolio was 94.2% occupied with an average effective monthly rent of $1,378 per occupied unit.
NXRT is differentiated by its value-add, workforce focus in which the company seeks to acquire operating well-located middle-income multifamily properties with value-add potential in large cities. NXRT targets markets with the following characteristics:
- Attractive job growth and household formation fundamentals
- High costs of homeownership or class A multifamily rental
- Elevated or increasing construction or replacement costs for multifamily real property
Since inception through March 31, 2022, NXRT has completed 6,398 full and partial, 4,510 kitchen and laundry appliances and 9,624 technology packages, resulting in a $139, $48, and $43 average monthly rental increase per unit and a 21.8%, 70.8%, and 33.5% ROI, respectively.
NXRT Investor Presentation 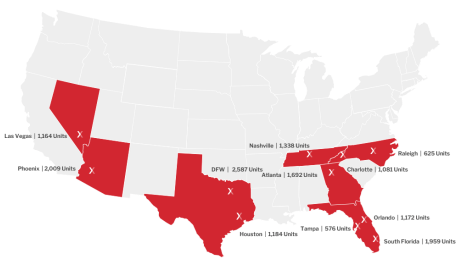
NXRT has become dirt cheap, as evidenced by the snapshot below:
Yahoo Finance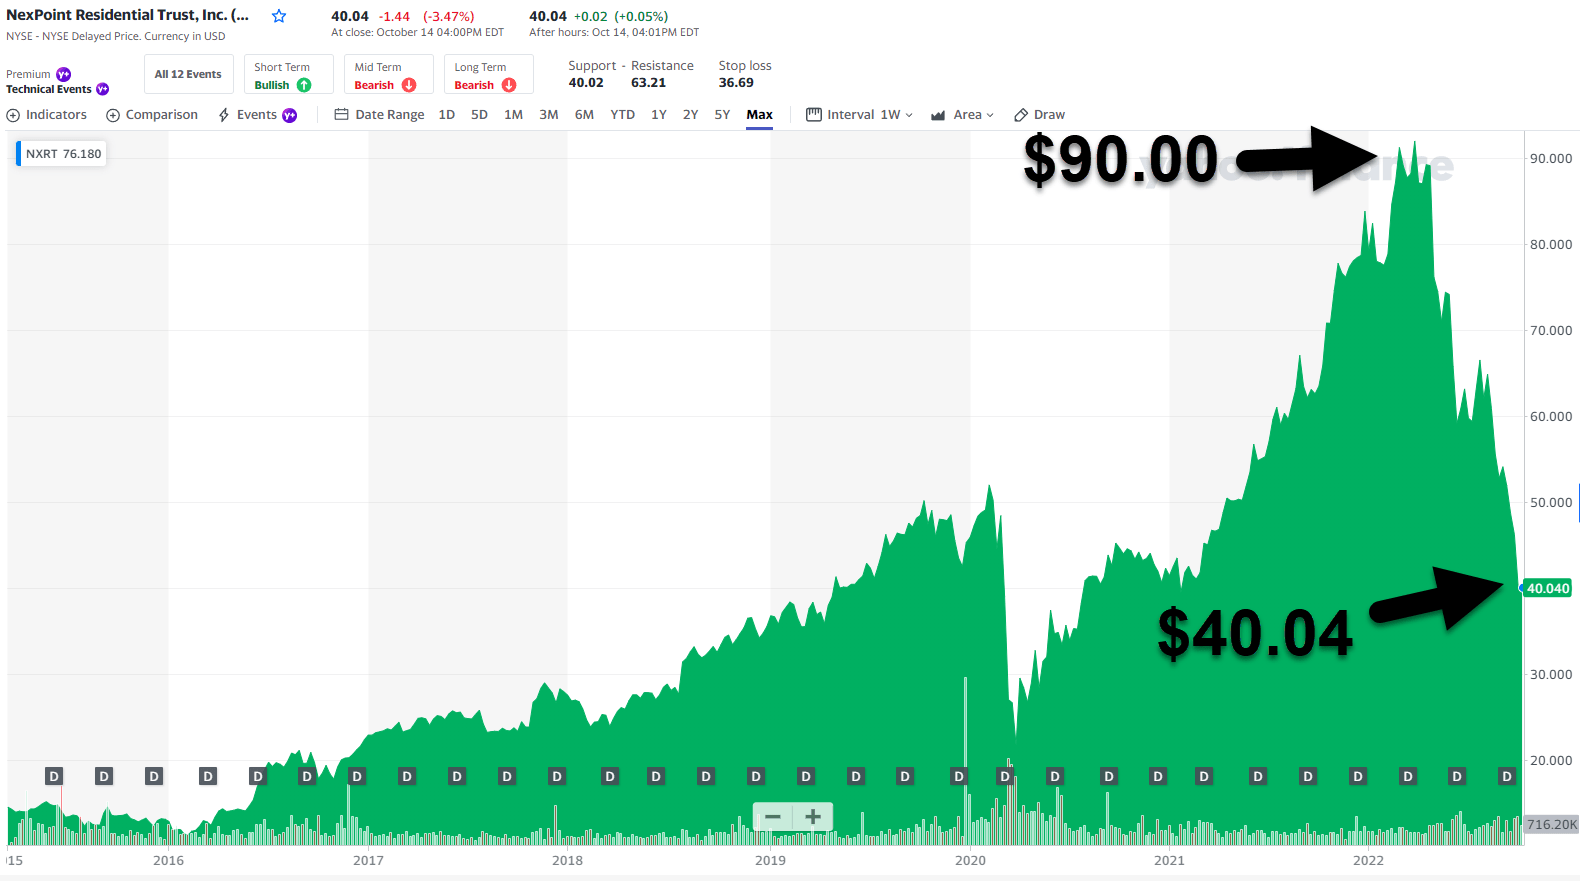
Year-to-date NXRT’s price has dropped over 50% versus the Vanguard Real Estate ETF (VNQ) that’s down around 34% YTD.
Yahoo Finance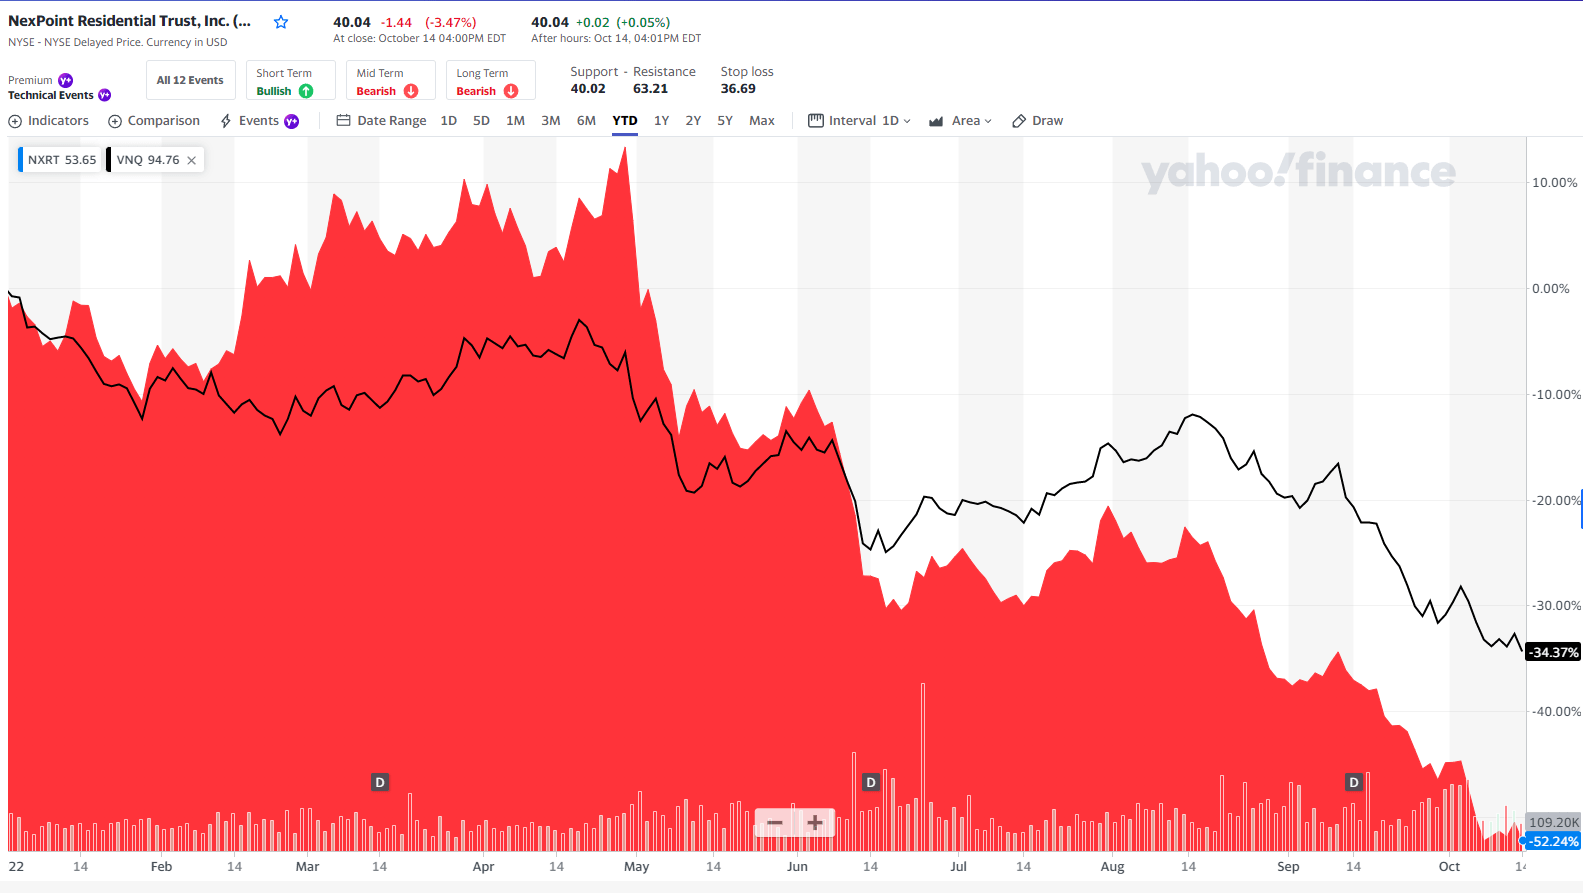
Interesting enough, NXRT was the top-performing multifamily REIT in 2021 – returning over 100% – and is now the worst-performing (multifamily) REIT in 2022 YTD:
iREIT on Alpha 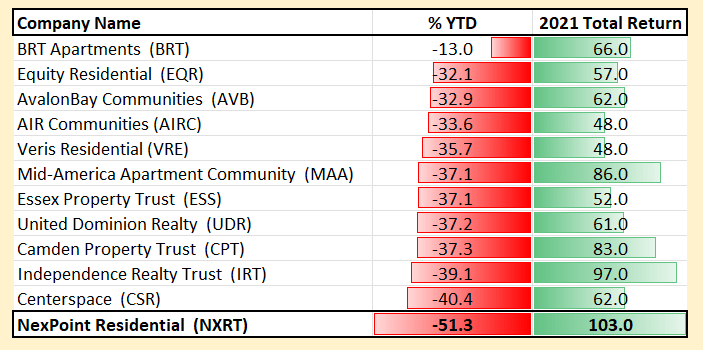
As seen below, NXRT is also the cheapest multi-family REIT, as measured by P/AFFO:
iREIT on Alpha 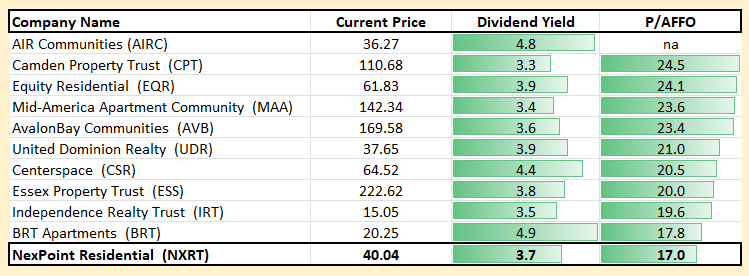
NXRT is well-positioned to continue to focus on the mass migration into the Sunbelt, as it maintains a core focus on delivering internal growth and outsized performance to investors while making prudent capital allocation decisions.
NXRT has long focused on Class B assets that have been upgraded and will continue to attract tenants, through any market condition.
NXRT is externally managed by the Adviser through an agreement dated March 16, 2015, as amended, and renewed on February 14, 2022 for a one-year term by and among the Company, the OP, and the Adviser.
The Adviser conducts substantially all of the Company’s operations and provides asset management services for its real estate investments. The Advisory Agreement requires that NXRT pay the Adviser an annual advisory fee of 1.00% of Average Real Estate Assets.
NXRT added Ms. Cathie Wood to the board of directors in July 2020, as the company said in its 2021 Annual Report, “the importance of adding a racially diverse board member became even more apparent.”
In 2022 NXRT also provided diversity details (such as gender, race, ethnicity, tenure, skills, experience, and age) in its proxy statement.
NXRT Website 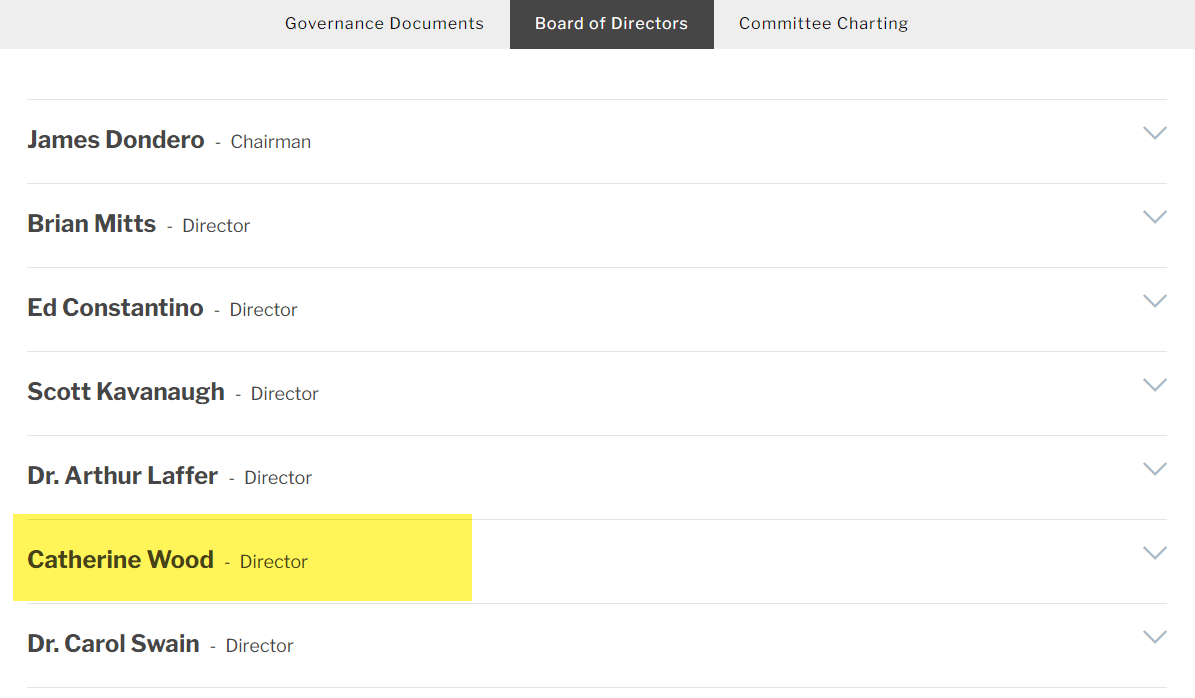
Just for kicks, I thought this chart would be interesting, comparing NXRT with Woods’ (ARKK) fund:
Yahoo Finance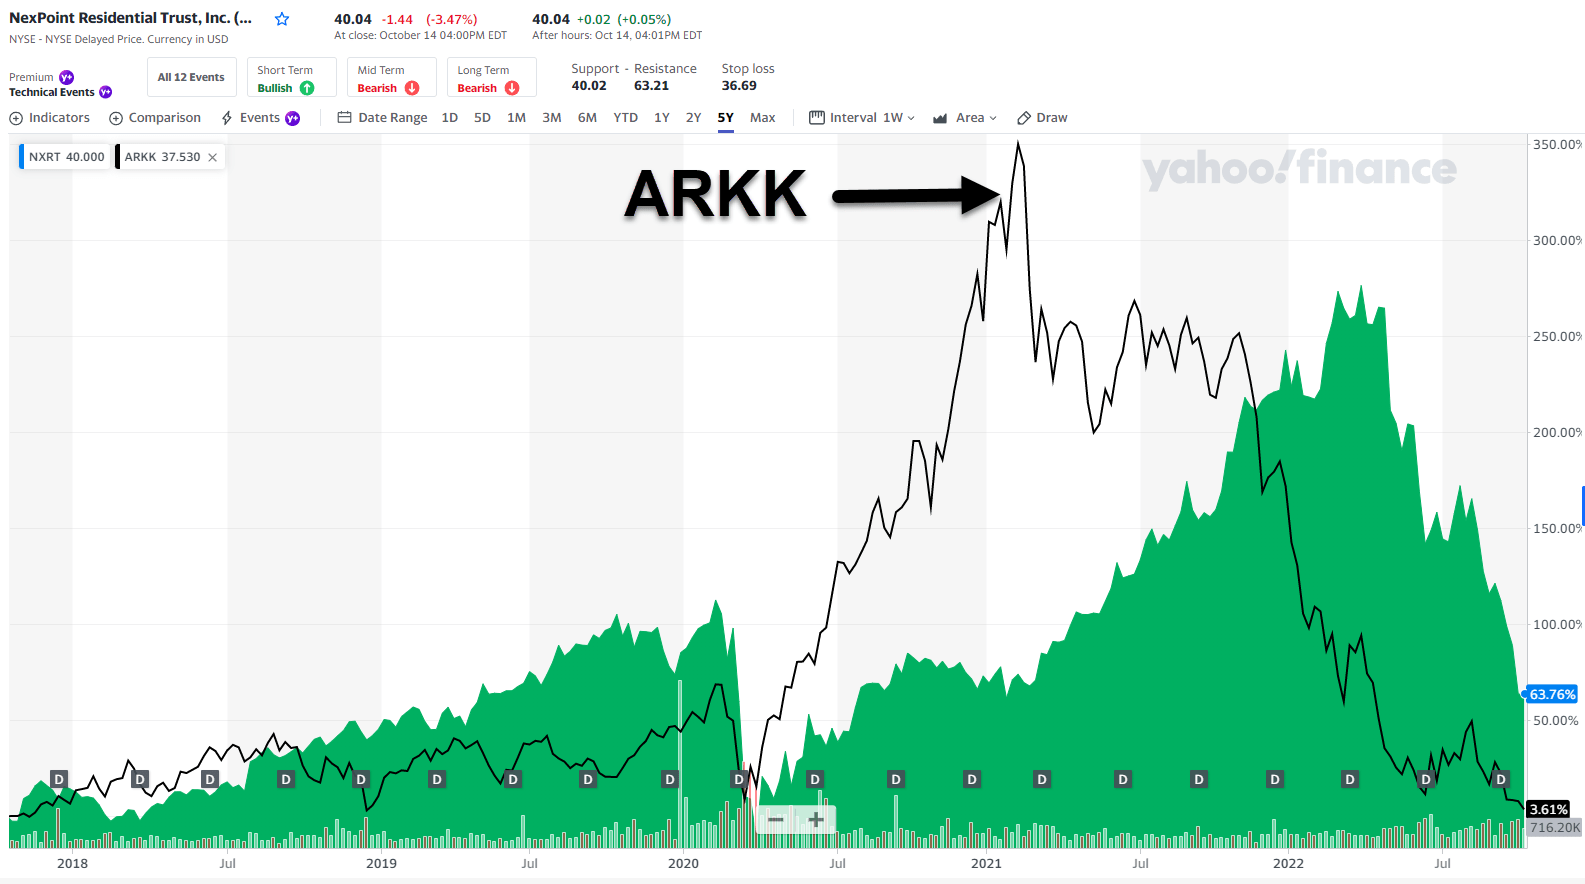
NexPoint Residential Balance Sheet
One other differentiator for NXRT is its balance sheet. Because the company is relatively small (just over $1 billion market cap), it must rely on variable rate secured debt. Take a look at the balance sheet that includes roughly $1.3 Billion in mortgage financing:
NXRT 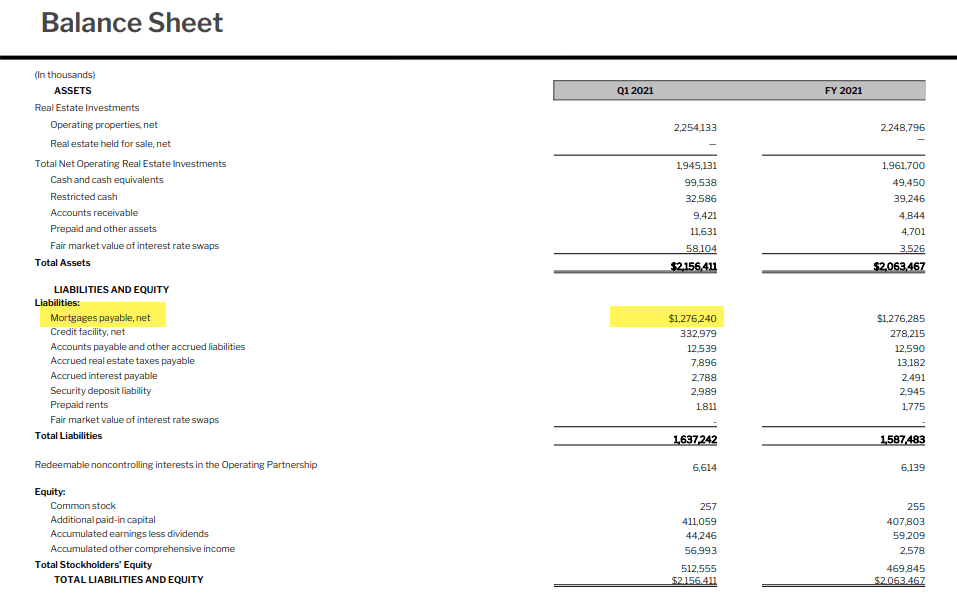
The leverage ratio as of Q2-22 was around 51%:
NXRT 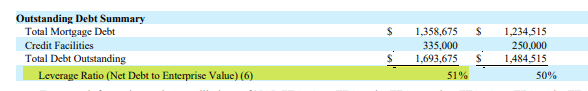
Most all of the secured debt is floating, and the earliest maturity date is July 2024:
NXRT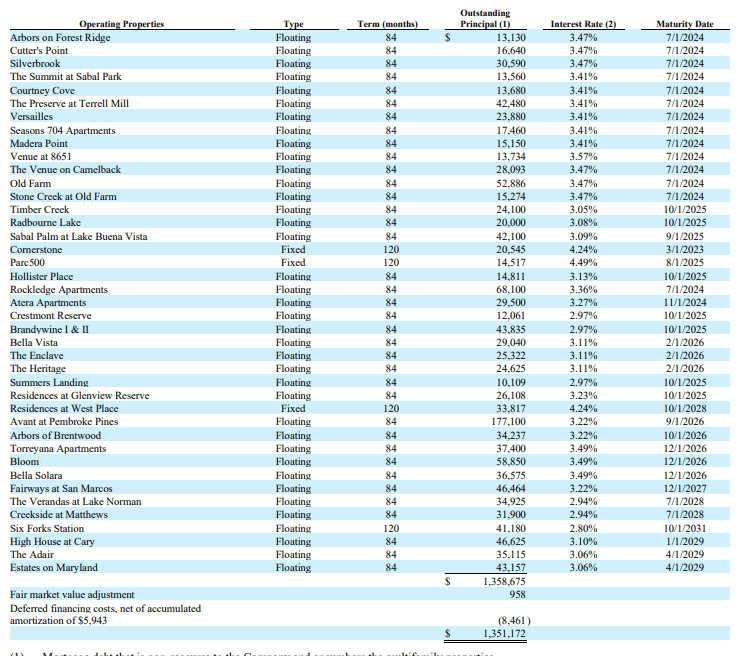
Given the fact that NXRT has extremely solid same store NOI growth, I’m not too concerned with the leverage. As seen below, NXRT has delivered impressive same store NOI growth:
NXRT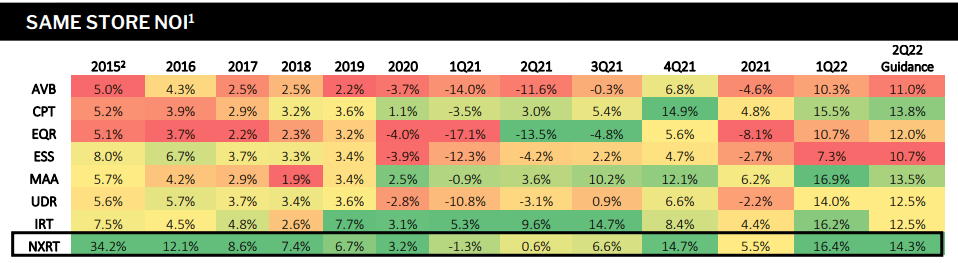
The company believes that middle market Class “B” affordable housing will outperform A & C in times of economic hardship:
67.5% of the total U.S. household population can afford to live in a NXRT community, as renters are fleeing higher rents and increasing housing prices in gateway and coastal markets and migrating to the Sunbelt.
NXRT Investor Presentation 
Job growth in nine of eleven NXRT markets outpaced the national average of 4.53%, according to the Bureau of Labor Statistics March 2022 employment report.
NXRT Investor Presentation 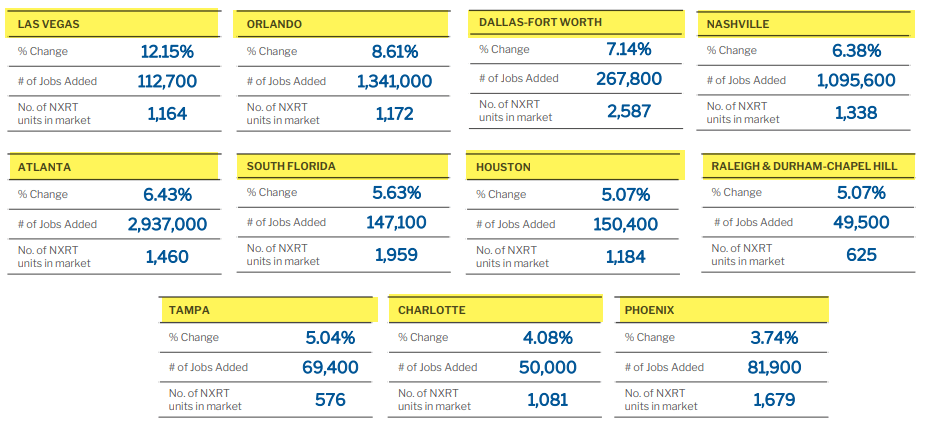
Follow the Money
In Q2-22 NXRT’s NOI was $38.8 million (on 41 properties), compared to $30.2 million for Q2-21 (on 39 properties), a 29% increase in NOI. For the quarter, year-over-year rent growth on renewals averaged 16.9% across the portfolio and year-over-year rent growth on new leases averaged 21.1%.
Q2-22 same store occupancy closed at over 94% despite a robust renovation output, and was 97.6% leased (at the end of July 2022).
NXRT Investor Presentation 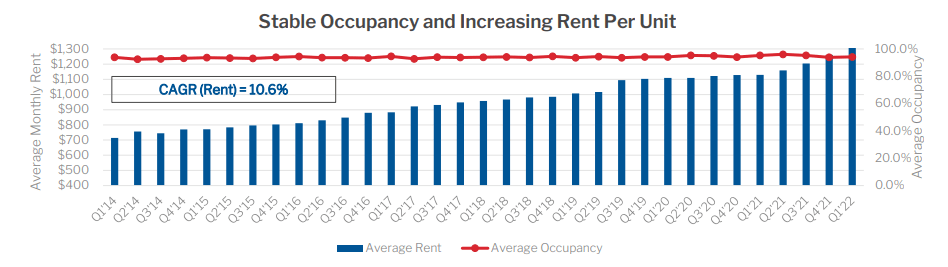
NXRT reported Q2-22 core FFO of $20.3 million or $0.79 per diluted share compared to $0.56 per diluted share in Q2-21, for an increase of 40% on a per share basis. For the quarter the company paid a dividend of $0.38 per share on June 30.
Since inception NXRT has increased its dividend to 84.5% and the dividend was 2.08x covered by core FFO with a payout ratio of 48% of core FFO in Q2-22.
FAST Graphs 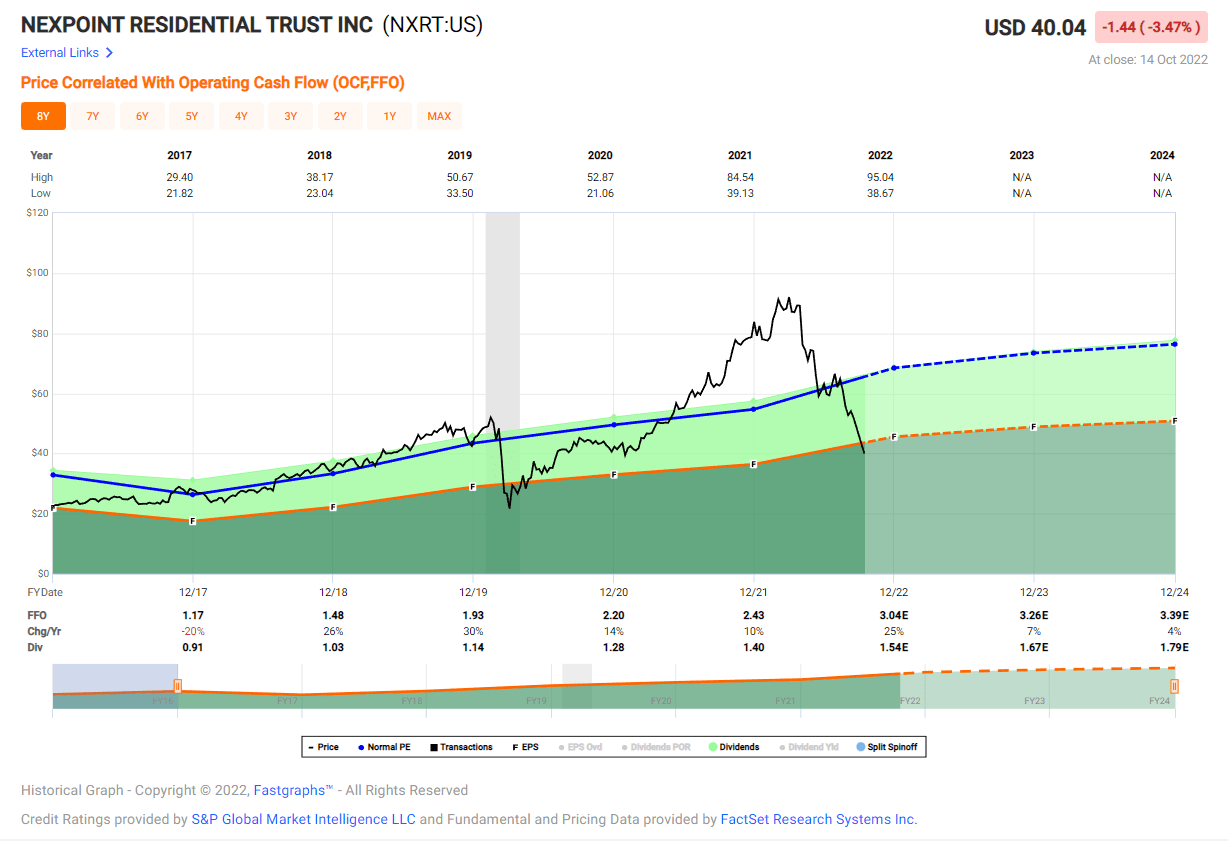
NXRT Stock Valuation
I have already pointed out how NXRT’s P/AFFO compares with the peers, however, since I also mentioned M&A, I thought it would be useful to compare NXRT’s Net Asset Value (or NAV). On the Q2-22 earnings call, the company said (emphasis added):
“Based on our current estimate of cap rates in our markets and forward NOI, we are reporting a NAV per share range as well as $80.70 per share on the low end, $96.27 per share on the high end and $88 to $0.48 per share at the mid-point. These are based on average cap rates ranging from 3.9% on the low end to 4.2% on the high end, which has increased approximately 48 basis points from last quarter to reflect a rise in interest rates and observable increases in cap rates in our markets.”
NXRT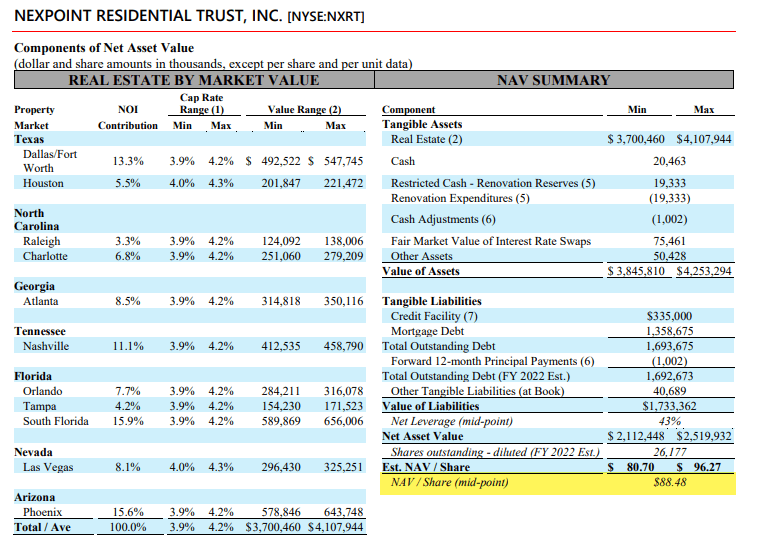
Normally I don’t get too fixated on NAV, which is somewhat of a liquidation value for the company, but in the case of NXRT, and my thesis that the company is likely an M&A target for Blackstone or others, I wanted to do so.
Assuming you bought shares today (which I did just before publishing this article), and to illustrate the point (using FAST Graphs), one could expect to just about double your money by the end of 2023 if NXRT is taken out at $88 per share.
Please recognize that I never consider M&A a catalyst, but given the overall cheapness of NXRT shares, this REIT is definitely positioned as a prime-time target…and I like my odds!
FAST Graphs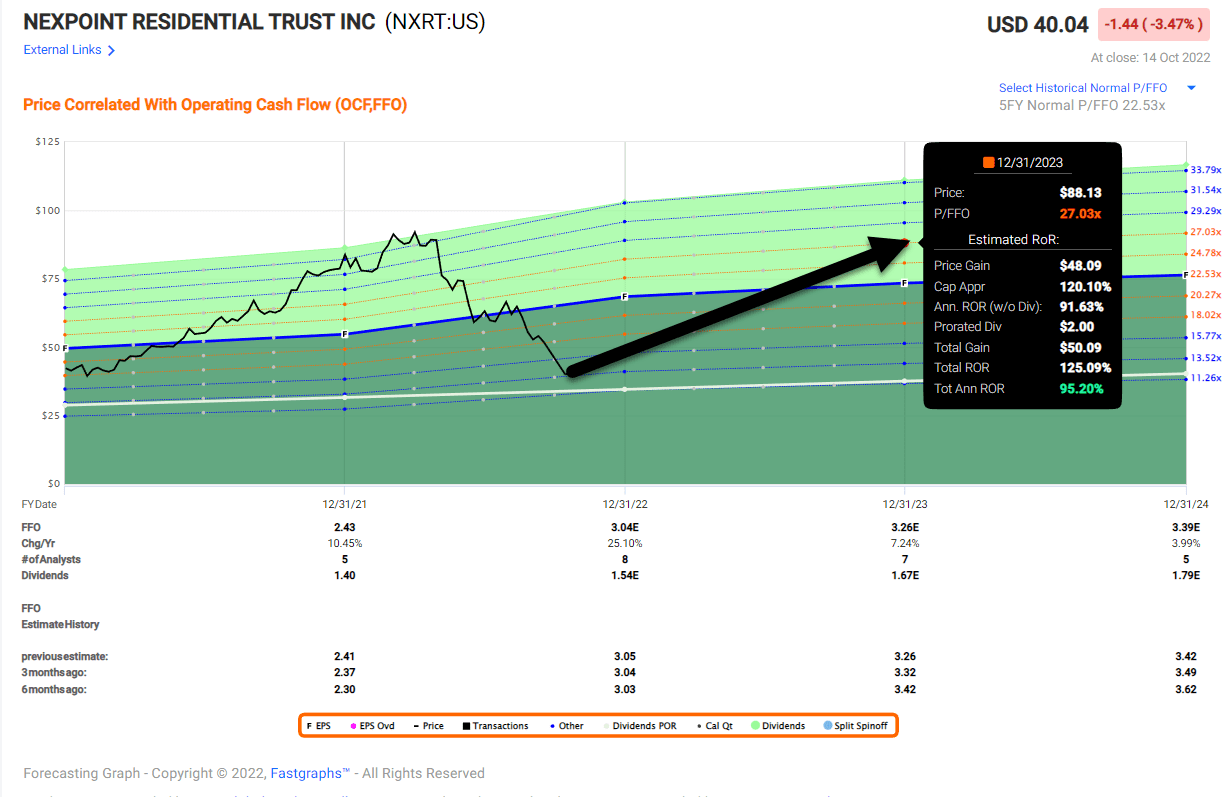
Please Note: NXRT is a small-cap REIT and is also externally managed. iREIT considers the company “speculative” and investors should consider all of the risks and determine his or her risk tolerance for making a selection.
Be the first to comment