


chonticha wat
Article Thesis
Inflation is running at a multi-decade high, but gold prices have not been overly strong in recent quarters. The profit outlook for gold miners, such as Newmont Corporation (NYSE:NEM), has thus worsened in recent months. That being said, the company offers a compelling dividend yield of 5% at current prices. Newmont has a strong balance sheet, which gives it some flexibility when it comes to employing cash for growth, buybacks, and dividends. With gold providing some insurance versus macro crises/unforeseen events, Newmont may have some merit at current prices.
How Is Newmont’s Short-Term Outlook?
Newmont’s profits and cash flows are naturally influenced by the price of gold, as well as by the price of some other commodities, such as oil, as it influences diesel prices and therefore Newmont’s input costs.
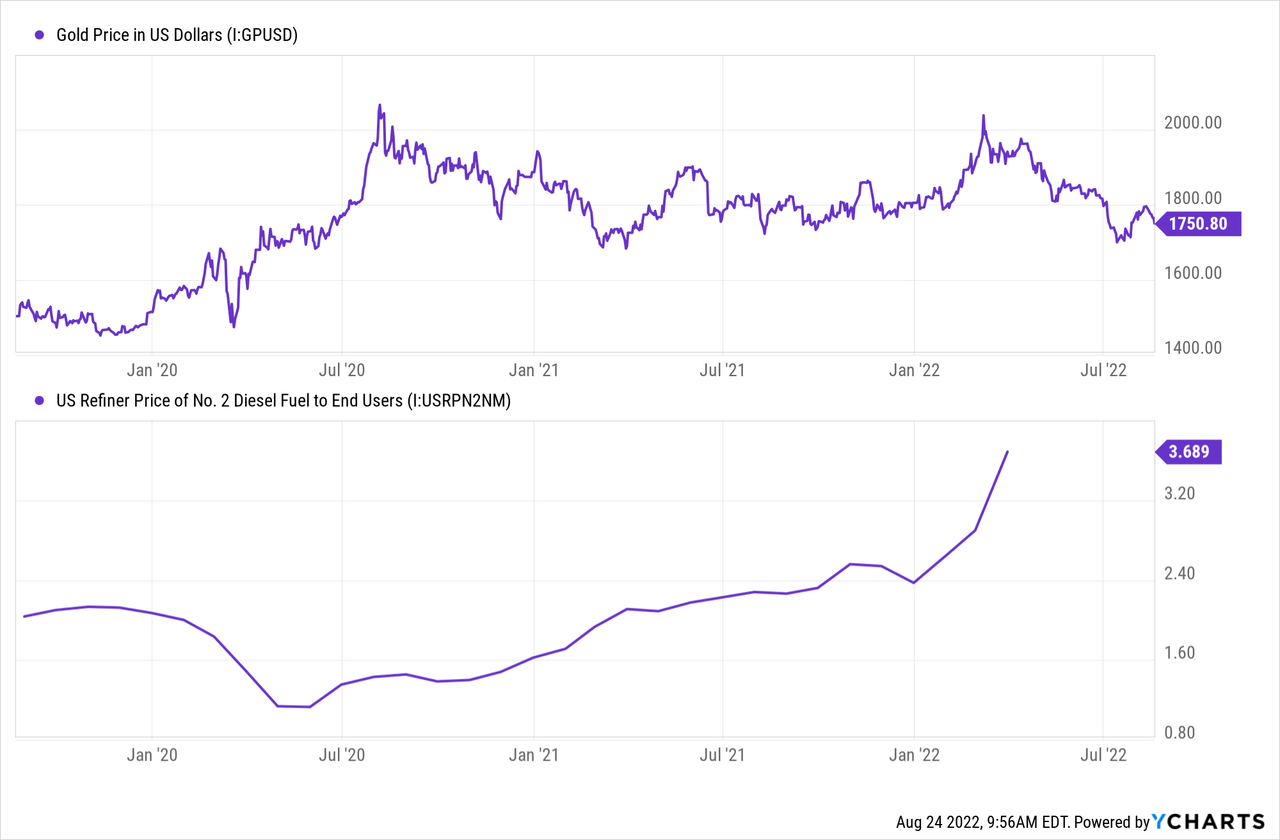
Over the last year, these commodities didn’t move in a direction that is beneficial for Newmont. Gold prices initially rose at the beginning of the pandemic in early 2020, but peaked in the summer months of 2020 and moved down/sideways since then. This year, gold prices have declined, although there was a short-term spike when the Russia-Ukraine war started.
At the same time, supply disruptions, a high oil price, and tight refining capacity around the world have made diesel more expensive — prices are up around 50% so far this year. Electricity and other input factors for Newmont have become more expensive as well, which puts some pressure on the company’s margins.
During the most recent earnings call, Newmont’s management stated that its all-in sustaining costs were $1,199 per ounce of gold during the second quarter. One year earlier, those costs were $1,035 per ounce, which shows the significant cost increases due to higher energy prices and higher labor costs.
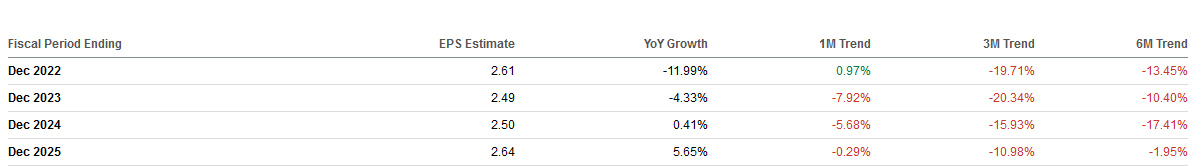
Oil prices are currently off their highs that were hit during the second quarter; thus Newmont’s expenses could decline during the current quarter (Q3). That being said, it is pretty clear that 2022 will be a less profitable year compared to 2021, which is why the analyst consensus estimate for Newmont’s earnings per share has been declining for some time:
Seeking Alpha
We see that earnings per share estimates for the current year have dropped by double-digits over the last six months, on the back of a pullback in gold prices and higher input costs. The same holds true for earnings per share estimates for 2023 and 2024, whereas 2025’s earnings per share estimates have remained relatively stable.
The near-term outlook for H2 2022 and beyond is thus not too positive, as Newmont will most likely be less profitable than previously thought. That being said, the company’s shares have pulled back from a 52-week high of $86 to just $44. When a stock gets almost cut in half, an earnings decline is not as disastrous compared to a scenario where a company’s shares are still trading close to highs while the profit outlook worsens. One could argue that, following a pullback of almost 50%, a profit decline is already fully factored into Newmont’s share price right here.
NEM Stock Key Metrics
Newmont had all-in sustaining costs of $1,199 per ounce in Q2, but believes that the average for the current year will be somewhat better. The company forecasts AISC of $1,150 for fiscal 2022, which would mean a ~4% improvement versus Q2. With better utilization rates expected in the second half, and with oil prices off their recent highs, that seems achievable.
The company has generated free cash flows of $514 million during the second quarter, and $760 million year-to-date. The Q2 free cash flow total was 10% below the previous year’s level — not a great result, but not a disaster, either. If Newmont were to generate free cash flows of around $500 million during the third and fourth quarter, respectively, the annual total would be in the $1.8 billion range. That makes for a free cash flow yield of 5.1% with Newmont trading with a market capitalization of $35 billion right now. That covers the current dividend, which yields 4.9% and which costs the company around $1.75 billion per year. But coverage is somewhat tight, as the dividend will likely eat up most of Newmont’s free cash flows this year.
It is worth noting that capital spending on growth projects is already accounted for in Newmont’s free cash flow generation; thus even if Newmont were to pay out 100% of its free cash flow in the form of dividends, it would still continue to pay for new projects organically. Newmont has been increasing its investments in new projects this year, as capital expenditures rose by 25% in Q2, relative to one year earlier. Current growth projects include Tanami Expansion 2 related to a gold mine in Australia that seeks to extend the life of the mine beyond 2040, but also other projects, such as Cerro Negro District Expansion 1 in Argentina.
Newmont has a $1 billion buyback program in place, which covers around 3% of the current market capitalization. It is unclear whether the company will spend meaningful amounts of cash on buybacks in H2, however, as surplus free cash flows after dividend payments will likely be pretty slim. From a timing perspective, buying back shares in the $40s seems like a way better idea than buying back stock in the $50s-$80s, of course.
Newmont luckily has a pretty strong balance sheet, which gives it some flexibility. Should the company decide to go for buybacks now, that wouldn’t be problematic, as net debt could easily be increased without endangering the company’s financial health. At the end of the second quarter, net debt totaled just $1.3 billion, equal to around 0.3x Newmont’s annual EBITDA. Adding another $1 billion in net debt would make the leverage ratio (net debt to EBITDA) climb to 0.5, which would still not be high at all. I’d say that everything below a 1x net debt to EBITDA multiple is reasonably healthy; thus Newmont could add several billion in net debt if it wanted to — e.g. for buybacks or for asset acquisitions, should attractive targets materialize. It’s of course possible that management decides to remain conservative with their balance sheet and that they keep net debt at the current, pretty low, level.
Looking at Newmont’s valuation, we see that the company currently trades at a discount relative to how the company used to be valued in the past:
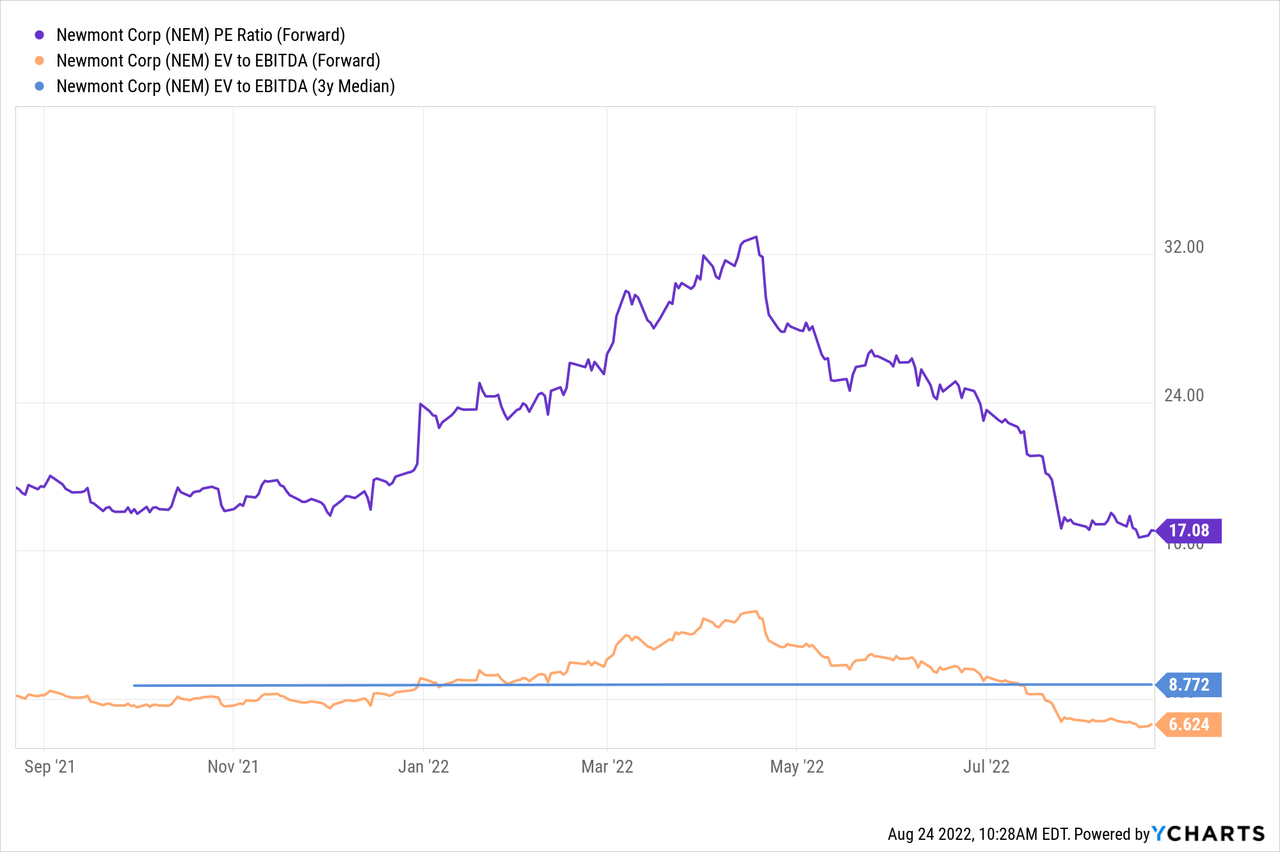
The forward earnings multiple of 17 is not really low in absolute terms, but still at the lowest level shares have traded at over the last year. Investors surprisingly were willing to pay as much as 25-30+ times net profits at some point earlier this year. Compared to that, Newmont is trading at a clear discount today.
Likewise, the current enterprise value to EBITDA multiple of 6.6 is the lowest so far this year, and clearly below the multi-year average. Newmont’s enterprise value (which is marginally higher than its market cap due to $1.3 billion in net debt) would need to climb by around 30% for the company to trade in line with the historic average. One could also argue that Newmont’s EBITDA could fall by around 25% from current levels and Newmont would still only trade in line with the historic average.
Where Is NEM Heading In 2025?
Newmont is highly dependent on gold prices, and those are hard to forecast. If Newmont hits the current consensus estimate for 2025, its shares could rise slightly over the next couple of years, while also offering a compelling dividend yield of around 5%.
The true value of an investment in a gold miner like Newmont is the fact that gold serves as a “store of value” in troubled times. If a major crisis emerges, gold prices generally rise, which is why Newmont can be seen as a type of hedge against major crises. During the initial phase of the Russia-Ukraine war, Newmont rose by around 30% in two months, for example. Since the current price is at the bottom of the trading range so far this year, investors may see this as a good time to load up on a “market hedge”.
I thus do not think that Newmont necessarily is a great long-term buy and hold investment, but the total return outlook over the coming years isn’t bad, and its crisis-hedging characteristics could make it interesting for investors.
Be the first to comment