

Moussa81
Introduction
On October 12, 2022, Canada-based New Gold Inc. (NYSE:NGD) released its third quarter 2022 operational results as of September 30, 2022.
Note: This article is an update of my article published on August 25, 2022. I have been following New Gold on Seeking Alpha since 2019.
1 – Third quarter production release commentary
Gold equivalent production has recovered from the disastrous second quarter. Many shareholders were delighted to learn that the company took the necessary steps to get back on track and expects a strong finish next quarter.
Renaud Adams, President & CEO, said in the press release:
At Rainy River, underground mining commenced during the quarter, and we continue to anticipate underground material to start feeding the mill beginning in the fourth quarter. With mining of the open pit main ODM zone continuing its ramp-up, I look forward to Rainy River finishing the year strong.
New Afton had solid production improvement over the second quarter with the continual ramp-up of B3. Last week we received the C-Zone permit, a significant milestone for the mine, and our priority at New Afton continues to be ramping up B3 production and advancing C-Zone development.
2 – Stock Performance
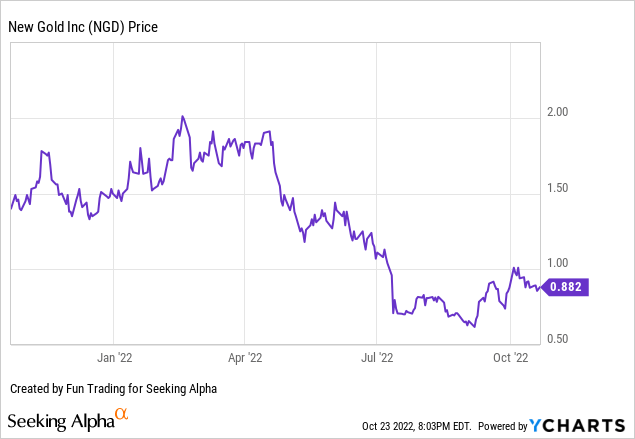
Despite a good production quarter, NGD is still struggling below $1. Two reasons could explain this slow recovery from the company stock’s record low.
First, the gold price has dropped significantly in the past few months and now trade around $1,660 per ounce. Second, many investors are still waiting for the 3Q22 results to decide whether to trust the company again or not.
3Q22 Gold production analysis
1 – The raw numbers
NGD Quarterly Oil equivalent history (Fun Trading)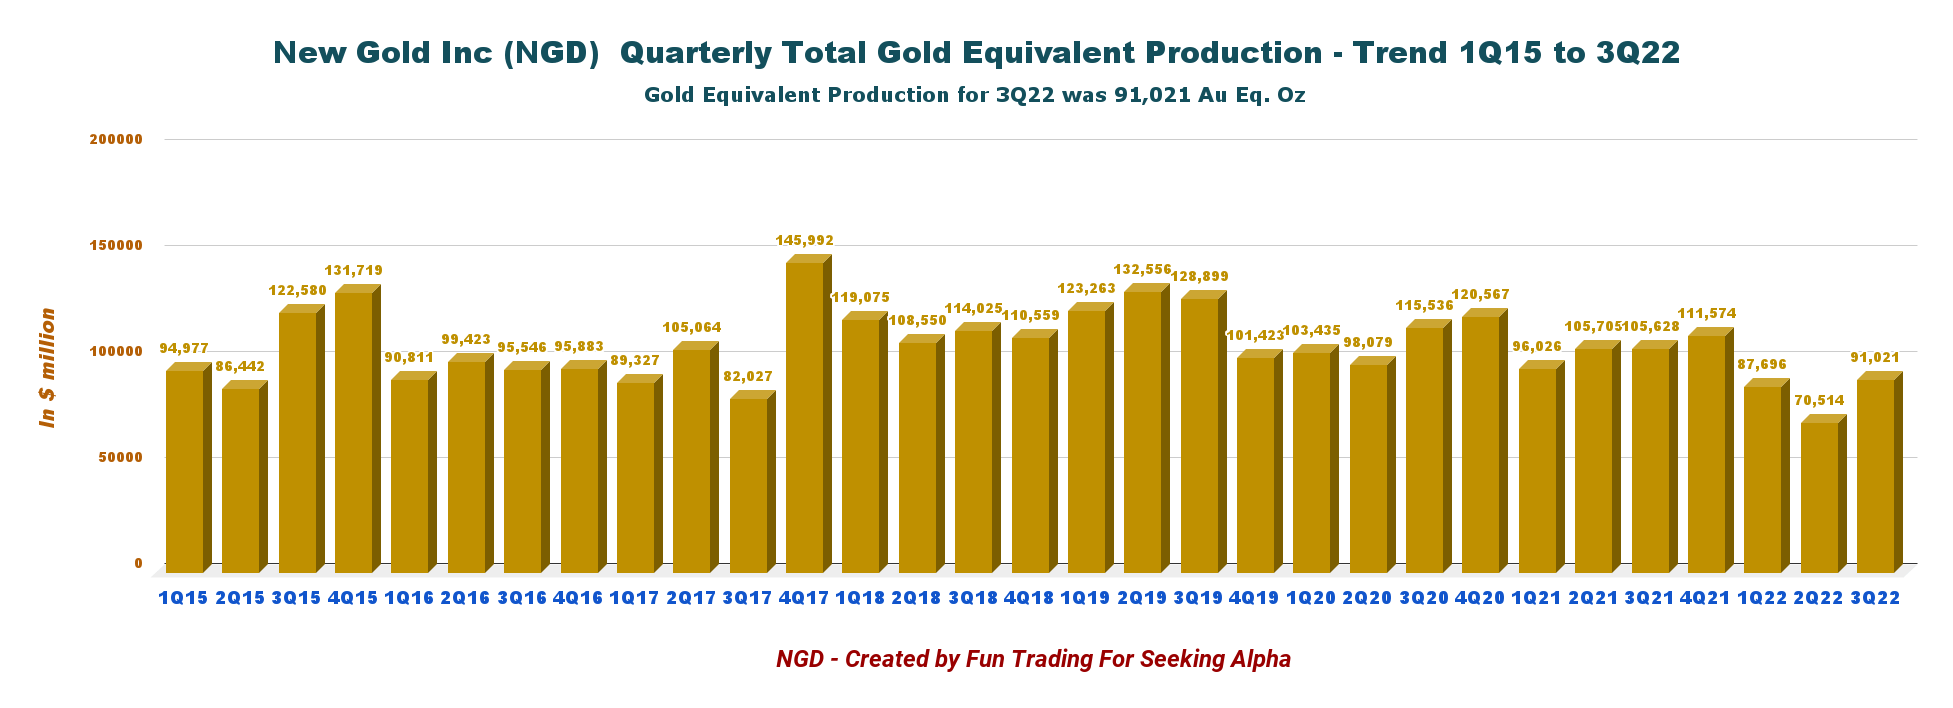
NGD announced on October 12, 2022, that it produced 91,021 GEOs during the third quarter. The production of gold equivalent ounces GEO includes gold, silver, and copper.
The company did not indicate the production sold in 3Q22, which is potentially a good sign. During the second quarter of 2022, New Gold sold 11.6% less than it produced due to unfortunate timing in sales. Thus, I expect a higher production sold in the third quarter.
Below is shown the production for the past three quarters and per metal:
NGD Production per metal from 1Q22 to 3Q22 (Fun Trading)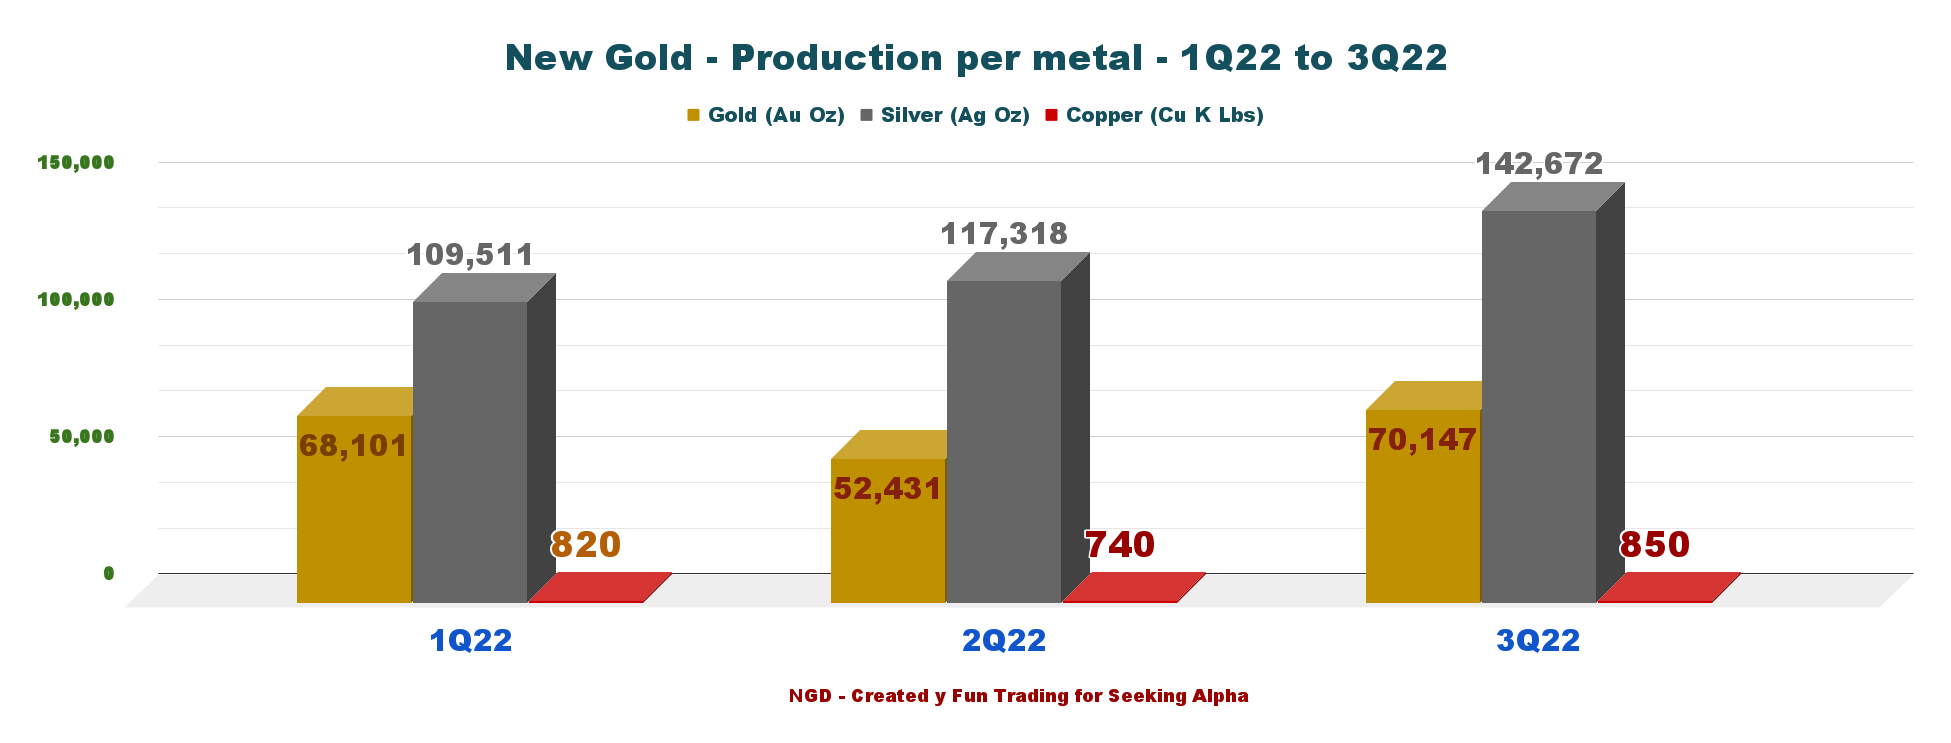
Gold production for the Rainy River mine was 70,147 Au ounces, and 11,427 Au ounces for the New Afton mine.
It was a good jump sequentially to a more average production for both mines. Shareholders are breathing a sigh of relief now that the storm has passed.
At Rainy River, underground mining commenced during the quarter, with underground material feeding the mill beginning in the fourth quarter. Mining of the open-pit main ODM zone continues its ramp-up.
At New Afton, NGD had solid production with the continued ramp-up of B3. Last week New Gold received the C-Zone permit, an essential milestone for the mine.
NGD Quarterly gold production history (Fun Trading)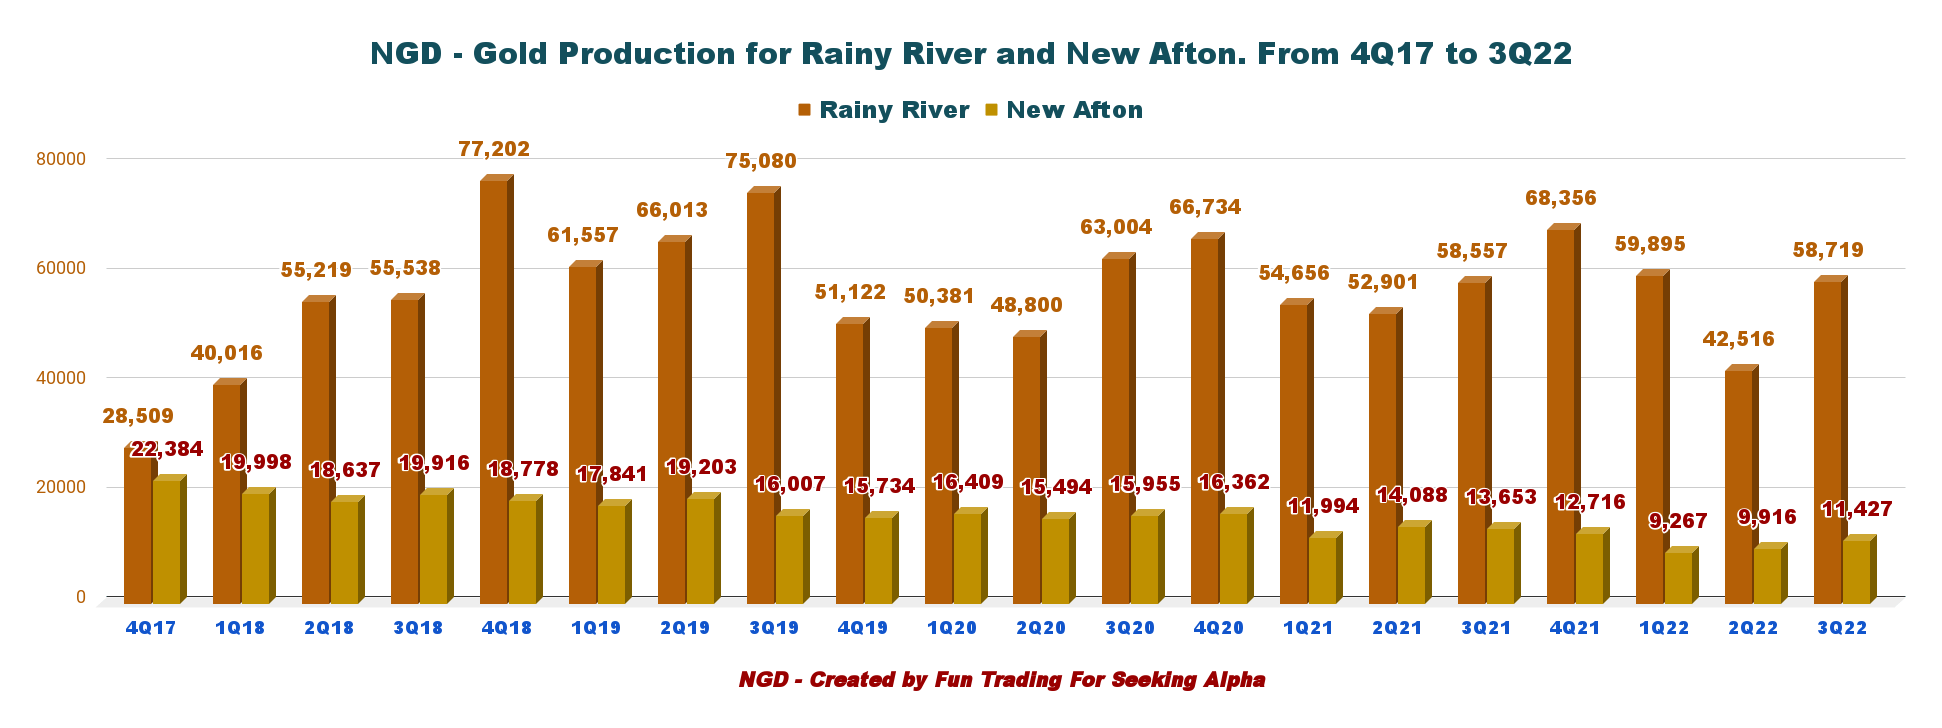
The gold production was 70,147 Au ounces, and I expect the gold sold this quarter to be higher by 10% due to timing sales experienced in the second quarter. Also, the grade per tone G/T recovered from the disastrous second quarter with a record high at New Afton and a good grade at Rainy River.
NGD Grade per ton per mine history (Fun Trading)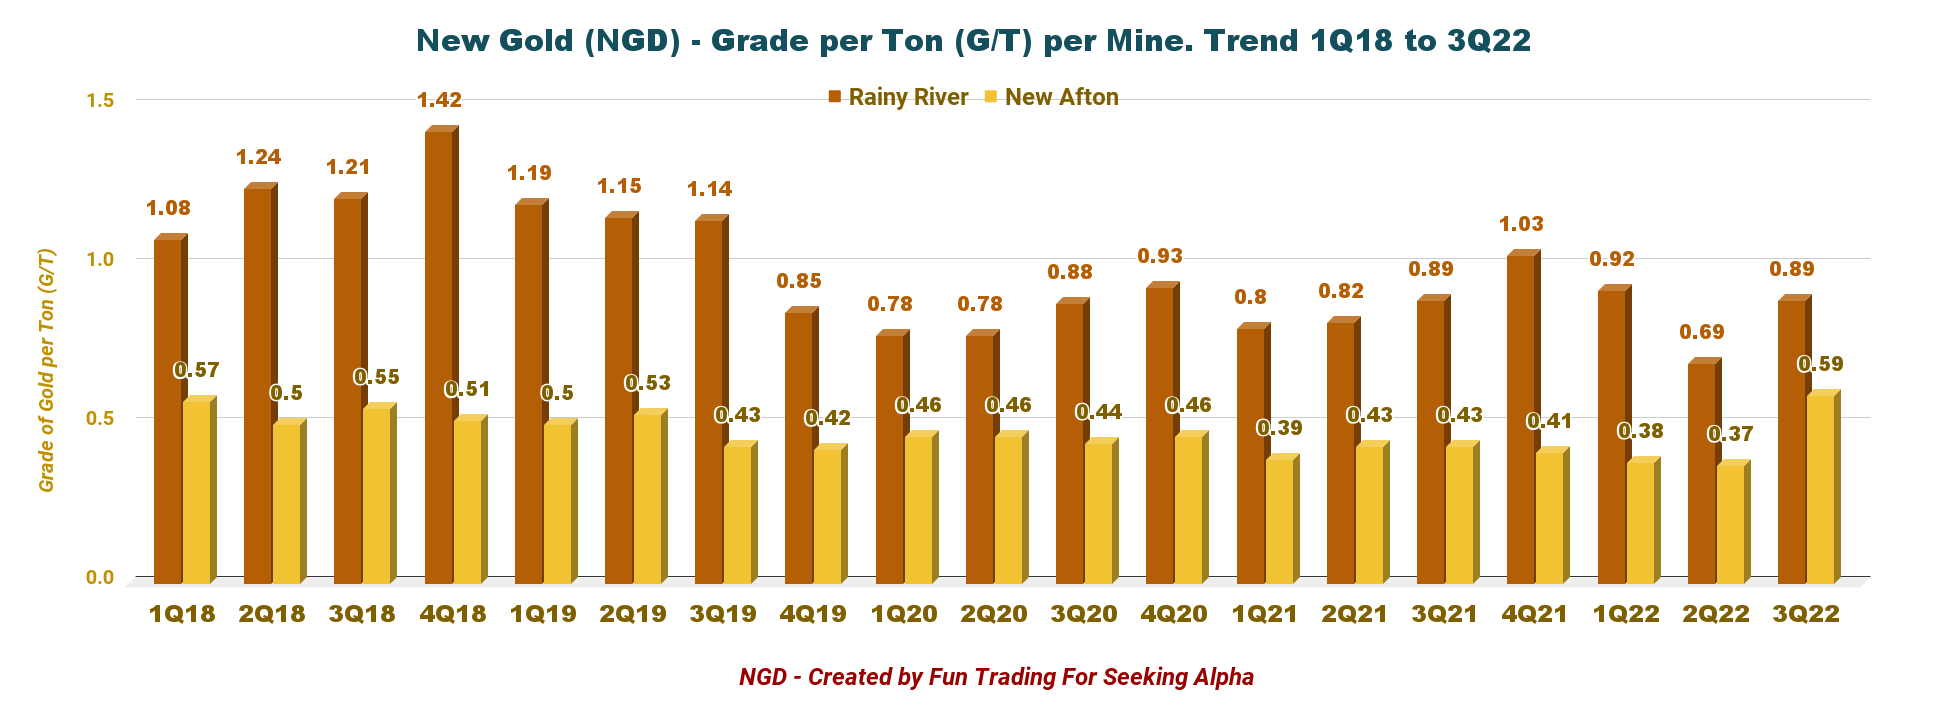
However, when we look at the tonnes mined per day, we notice a significant drop year over year. For Rainy River, the TPD dropped from 52,917 to 24,701; for New Afton, the TPD dropped from 13,068 to 7,764.
2 – NGD remains on track to deliver on its updated 2022 guidance
In the press release, Renaud Adams, President & CEO, said that the company remains on track to deliver on the updated guidance.
The company revised and lowered the Rainy River’s gold equivalent production for 2022 in 2Q22. It is now expected to be between 230K to 250K GEOs from 265K to 295K GEOs.
Moreover, operating expenses per GEO are forecasted to be between $960 to $1,040 per GEO, from $730 to $810 per GEO. The increase is due to lower gold production and current inflationary cost pressures.
Finally, all-in-sustaining-costs AISC are expected to be between $1,620 to $1,720 per GEO, from $1,270 to $1,370 per GEO.
NGD Updated guidance 2022 (NGD Presentation)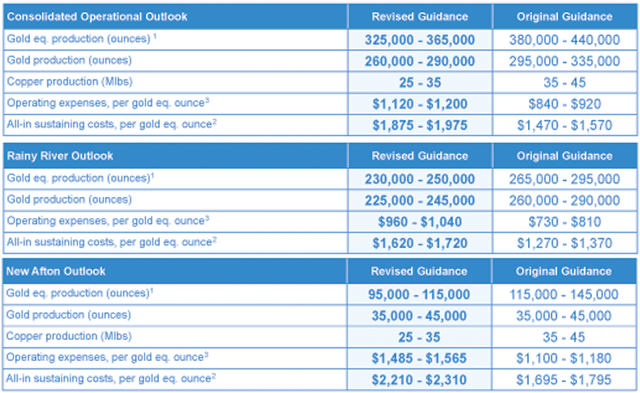
Technical analysis and commentary
NGD TA chart short-term (Fun Trading StockCharts)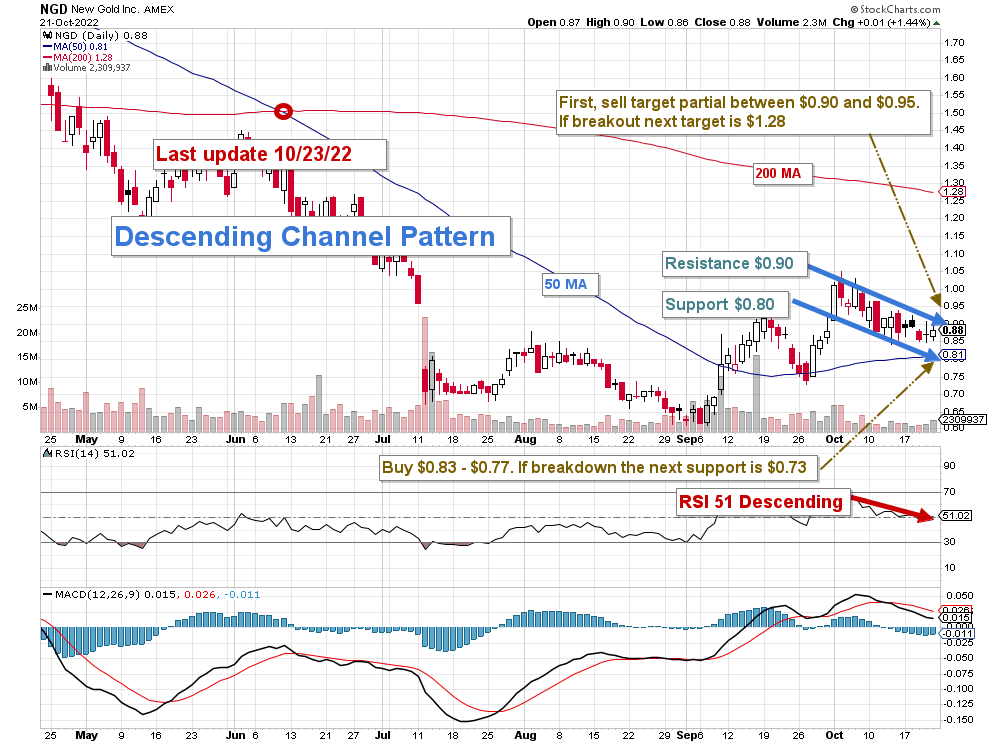
NGD forms a descending channel pattern with resistance at $0.90 and support at $0.80. Descending channels is often bullish in this case, but it will depend on the price of gold which has been weakening the past few weeks.
The strategy is to trade LIFO about 70% of your position and keep a small core long-term for a more outstanding payday.
I recommend accumulating between $0.83 and $0.77 with potential lower support at around $0.73. NGD will remain weak and could test $0.70 again if the FED hikes another 75-point in November, pushing the US economy closer to a recession.
Also, It is important to take profits between $0.90 and $1.10 with a potentially much higher stock price if the company can demonstrate a turnaround in production, especially at Rainy River.
Note: The LIFO method is prohibited under International Financial Reporting Standards (IFRS), though it is permitted in the United States to generally accepted accounting principles (GAAP). Therefore, only US traders can apply this method. Those who cannot trade LIFO can use an alternative by setting two different accounts for the same stocks, one for the long term and one for short-term trading.
Warning: The TA chart must be updated frequently to be relevant. It is what I am doing in my stock tracker. The chart above has a possible validity of about a week. Remember, the TA chart is a tool only to help you adopt the right strategy. It is not a way to foresee the future. No one and nothing can.
Author’s note: If you find value in this article and would like to encourage such continued efforts, please click the “Like” button below to vote of support. Thanks.
Be the first to comment