

ansonsaw
I made a mistake.
You can mark today, January 12th, as the day I acknowledged my first 2023-specific mistake made here on Seeking Alpha. Though, technically, I made the mistake right off the bat.
Like on New Year’s Day.
So there’s that.
It was in the article “5 REIT Resolutions for 2023,” where I listed the following goals for this new trip around the sun:
- Reduce leverage.
- Avoid sucker yields.
- Maintain sound diversification.
- Make my wife happy.
- Stay humble.
All of those were good – even great! – resolutions, if I do say so myself. And to those who would point out that some (or all) of them sound familiar…
So what? Stick with the classics, I say! They’re classic for a reason.
That’s not where my mistake was. My mistake was in writing only five real estate investment trust (“REIT”) resolutions for the year. I should have written six, with the last one looking like this:
Never forget that cash is king.
REITs Were Not Happy In 2020
For those of you who recognize the phrase – and how I built a portfolio around the concept after the 2020 shutdowns sent REITs into a pricing abyss – fear not. I’m not predicting another crash-and-burn session like we had back then.
Ultimately, who knows, of course. Anything goes in the 2020s! On the flipside, we might not even see a recession when the labor market is raging the way it is.
However, I’m pretty sure that’s around the bend. In which case, we want to limit our risk even more than usual by investing in quality companies that are prepared to handle less-than-stellar business conditions.
As I wrote in my 2020 “Cash Is King” article:
“I know you’ve heard that the No. 1 rule in real estate is ‘location, location, location.’ And perhaps it deserves that placement.
“But a very close second, at least when it comes to REITs, is ‘cash is king.’ In fact, you could even say that rule No. 1 doesn’t work long-term if it doesn’t automatically align itself with rule No. 2.”
At the time, I know I had a captive audience. It was March 19, and nobody knew when the market was going to bottom. Nobody knew how long the lockdowns were going to last. Nobody knew how devastating the virus was going to be.
Nobody knew much of anything.
So, yes, people were looking for answers. And “cash is king” was one of the best I could find since:
“… REITs pay out so much cash every year. It’s the main reason why investors buy into them in the first place: The dividends they’re designed to faithfully offer.
“In order to stay faithful though, they have to have enough cash on hand to cover those shareholders perks.”
This only makes sense.
More Cash-Is-King REIT Sense (And Cents) To Go Around
I continued with:
“They also need enough cash to cover everyday business expenses, such as salaries, utilities, taxes (although REITs do pay less in that regard by doling out more money to shareholders), and so many other expected or unexpected costs.”
By cash, I clarified, I didn’t “necessarily mean actual greenbacks being physically held in these companies’ hands. I mean money that’s not tied up in investments.”
This means “funds that are easily available.” And for those who were ready to weigh in right then and there, I added:
“It’s true that those funds aren’t growing over time, unlike so many other asset types. But it’s also true that, if things go bad, nothing else works quite as well.
“And guess what?
“Things have definitely gone bad.”
Here’s the thing, though: That “definitely gone bad” situation wasn’t the first time I mentioned the concept. The first time, REITs were emerging out of such a scenario.
You can actually go back all the way to June 11, 2012 title-wise – when we were still stagnating in so many economic ways after the crash.
Yet REITs were still doing pretty well in the stock market. Over the past year, they’d outpaced the S&P 500 Index (SP500) at 11.29% to 8.54%, respectively. They’d also spent that time raising a lot of cash and were champing at the bit to use it.
They’d thought ahead, you see. And their investors reaped some very nice rewards as a result.
Those rewards may or may not be so nice this year. Again, I can’t say. But give me a fortress REIT that can stand its dividend-paying ground regardless.
And if it’s raising that dividend regardless?
Well, I’ll like it even more.
Cash Is King
Simon Property Group, Inc. (SPG)
Simon Property is a REIT that primarily invests in mall properties. In the introduction, I explained that cash doesn’t just mean greenbacks held on hand, but rather cash that is not tied up in investments; funds that are easily available to the company. This describes a company’s total liquidity which typically consists of actual cash on hand and undrawn lines of credit.
SPG has an enormous amount of liquidity available to them. As of 9/30/2022, Simon had $1.2 billion cash on hand (including its share of joint venture cash) and $7.4 billion of available capacity under its revolving credit facilities, for a total liquidity amount of $8.6 billion.
SPG – Q322 Supplemental Information
Another important aspect of measuring the health of a company’s cash position is to evaluate its overall debt levels. This can be examined using several different leverage and / or coverage ratios. We can compare total debt to total assets, total debt to earnings, and earnings to annual interest payments due.
Simon provides the following debt metrics below. It’s important to note that the Total Assets used is the market value of their properties (NOI / cap rate) plus the value of other assets at cost.
SPG – 3Q22 Supplemental Information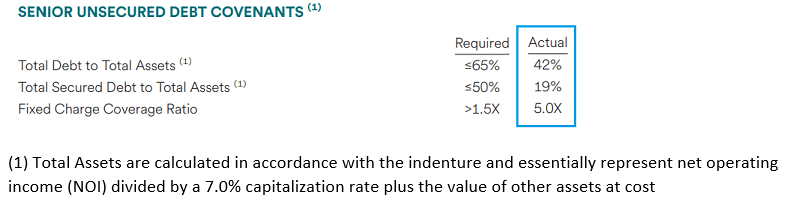
Simon’s total debt represents 42% of its total assets. For comparison, an individual that puts down 20% to buy a house with a 30-year mortgage would have a debt to asset ratio of 80% (i.e., borrowing $80,000 for a house with a market value of $100,000).
Simon has a Fixed Charge Coverage Ratio of 5.0x, meaning their earnings can cover their interest and preferred obligations five times over. Earnings, as it relates to leverage and coverage ratios, are conventionally measured using EBITDA (Earnings before Interest, Taxes, Depreciation & Amortization).
Total Debt to EBITDA measures the relationship between earnings and total debt outstanding. A good way to look at this ratio is how many years it would take a company to pay off all its debt, assuming all earnings were used for that purpose.
Simon does not explicitly list Total Debt / EBITDA, but by pulling the numbers from the 3Q22 10-Q report we get a rough estimate of 5.9x. This is in line with SPG’s historical Net Debt / EBITDA over the last several years.
Data from SPG 3rd quarter 10-Q (compiled and calculated by iREIT) REIT/BASE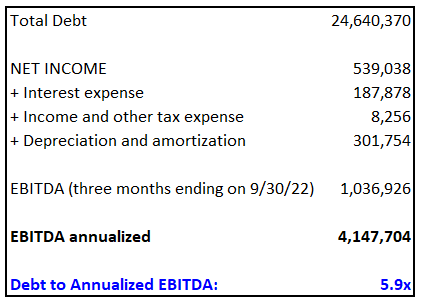

SPG’s Statement of Cash Flows from their most recent annual report (2021) shows positive cash flow from operations in each year, even in 2020 during the pandemic. The numbers are reported in thousands, so in 2021 Simon had positive cash flow from operations of $3.6 billion.
Operating cash flow is similar, but not identical to Funds from Operations (“FFO”). Both start with Net Income, add depreciation back, and adjust for gains / losses, but operating cash flow also adjusts for additional items such as changes in working capital.
SPG – 10-K, 2021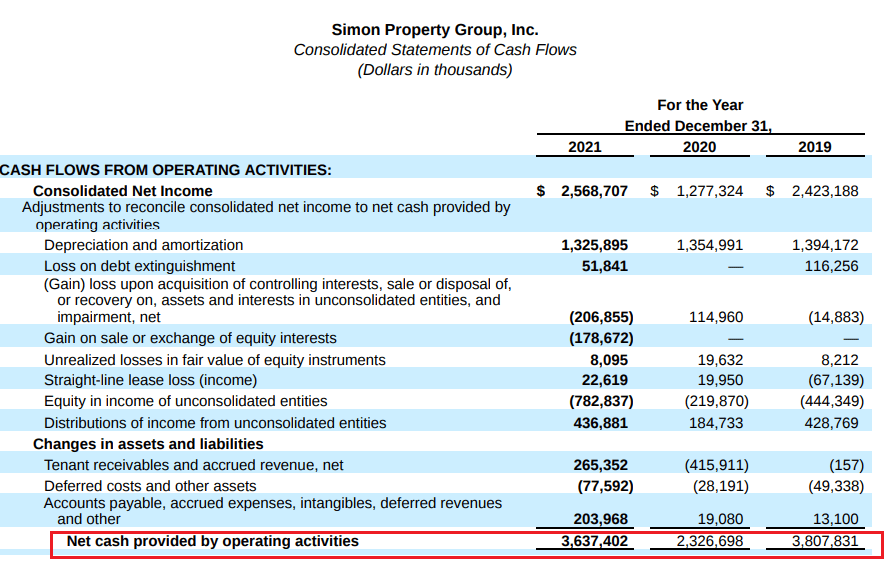
Free Cash Flow is operating cash flow minus capital expenditures (“CapEx”), more specifically capital expenditures required to maintain the operations of the business (rather than expenses capitalized to expand the business).
SPG reported $527 million in total CapEx in 2021, but the majority of that was used for new developments and expansions rather than money spent to maintain operations.
SPG – 10-K, 2021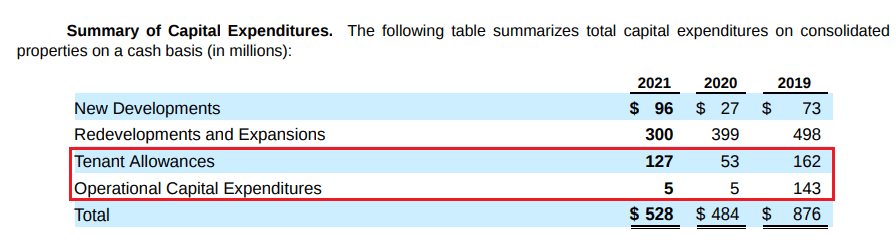
In the Cash Flows from Financing section, SPG has 3 line items listing the distributions paid: Preferred distributions of the Operating Partnership, distributions to stock holders and preferred dividends, and distributions to limited partners.
SPG – 10-K, 2021
Putting all this information together we can determine how much Free Cash Flow SPG is generating each year, if the FCF covers the dividend, and how much Free Cash Flow is left over after all distributions have been paid.
Payout ratios, whether based on Adjusted Funds from Operations (“AFFO”) or Free Cash Flow, are important both to make sure the dividend is covered and to show how much cash is retained for investment or for paying down any outstanding debt.
SPG – 10-K, 2021 (compiled and calculated by iREIT)
SPG was able to retain approximately $553 million in Free Cash Flow in 2019, $604 million in 2020, and $814 million in 2021. This works out to an average FCF payout of around 78% while retaining an average of 22% of Free Cash Flow over the last several years.
When looking at the payout ratio on Adjusted Funds from Operations, the metric looks even better. Since 2015, the average AFFO payout ratio is 67.53%, with 32.47% of AFFO retained for future investments or to pay down debt.
FAST Graphs (compiled and calculated by iREIT)
SPG has an A- credit rating, good debt metrics, and a massive amount of liquidity at its disposal. It has consistently generated cash flow and made distributions to shareholders with cash left over for investment. At iREIT we rate SPG a STRONG BUY.
iREIT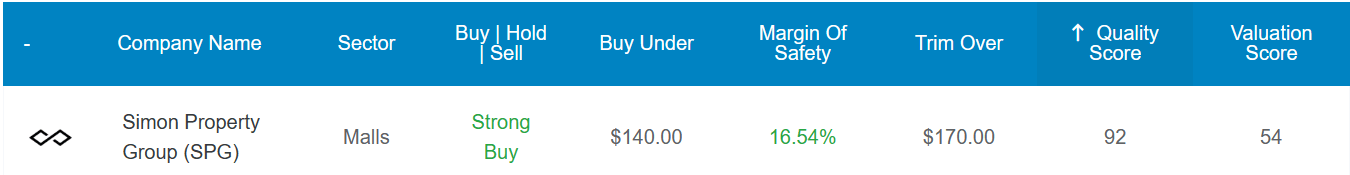
Boston Properties, Inc. (BXP)
Boston Properties is a REIT that invests primarily in office properties. BXP has 193 properties located in Los Angeles, Boston, New York, Seattle, San Francisco, and Washington, DC.
As of the 3rd quarter in 2022, BXP had $2.3 billion in liquidity. This includes cash and cash equivalents, cash held in escrow, and available capacity on their revolving line of credit.
BXP – Investor Presentation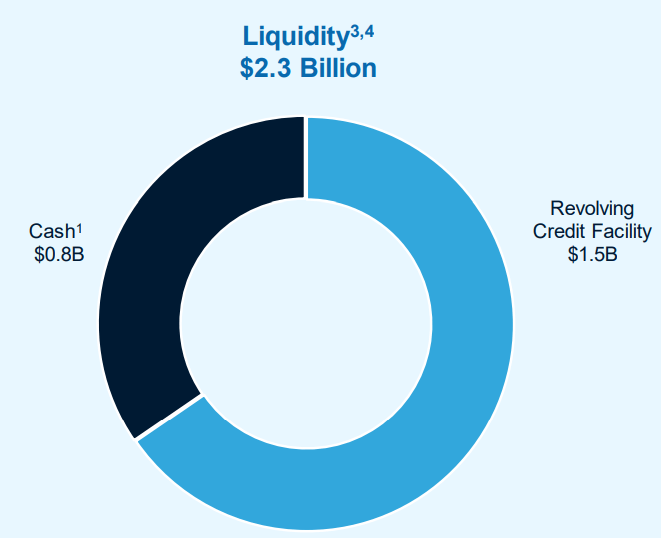
Boston Properties Net Debt to EBITDAre is 7.5x, which is a little higher than I’d like to see. From the chart below it looks like BXP was in the mid 6x range up until the pandemic, when it jumped to 7.4x. As the office sector works through this period of uncertainty, I’d like to see the Net Debt to EBITDAre come down to the 5-6x range.
BXP – Investor Presentation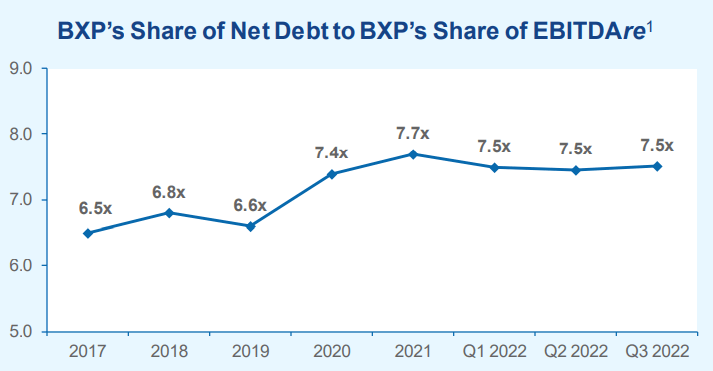
BXP had a Fixed Charge Coverage of 2.7x in 2Q22 and has a Fixed Charge Coverage of 3.0x as of 3Q22, meaning their EBITDA can cover all interest expenses and preferred obligations three times over. This is in line with their recent multiples.
REIT/BASE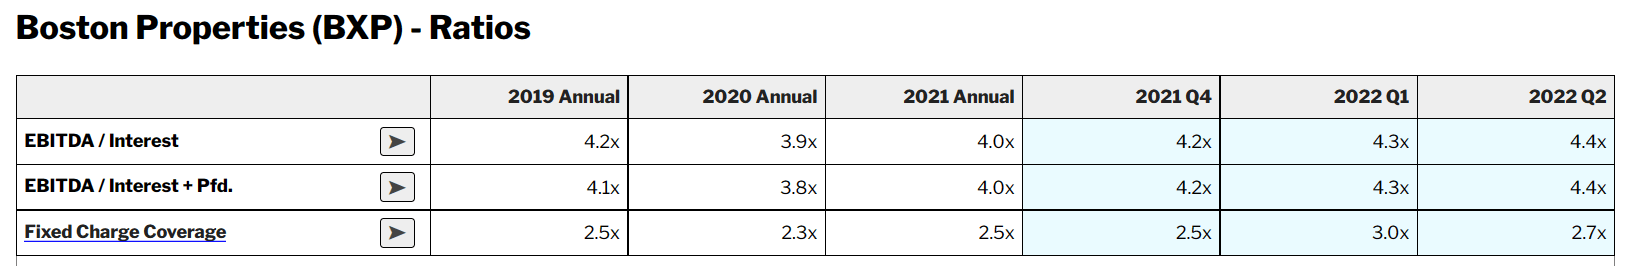
BXP does not list its total debt to total assets ratio, but as of 9/30/22 their total assets equal $23,726,691 (in thousands) while their total debt is $13,832,871 (in thousands), so their debt to assets ratio comes to 58.30%. Keep in mind here that I’m using assets at cost (rather than the property market value), so it’s likely the assets are somewhat understated.
BXP – 3Q22 Supplemental BXP 10-K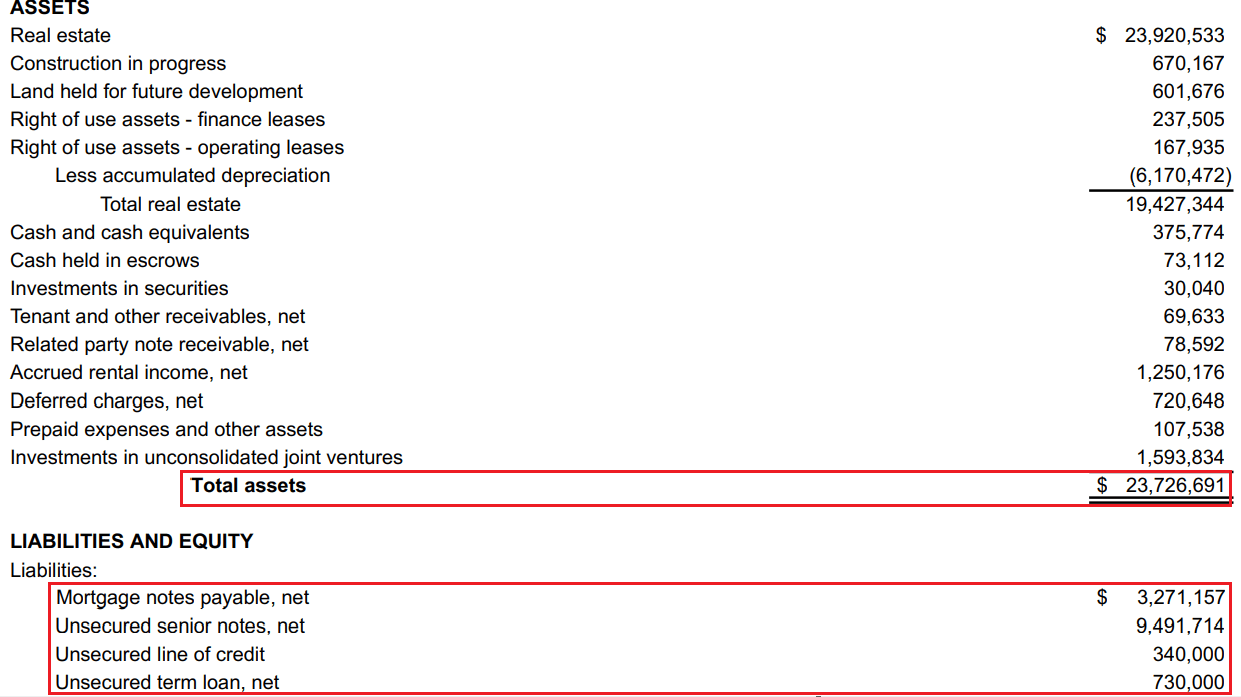
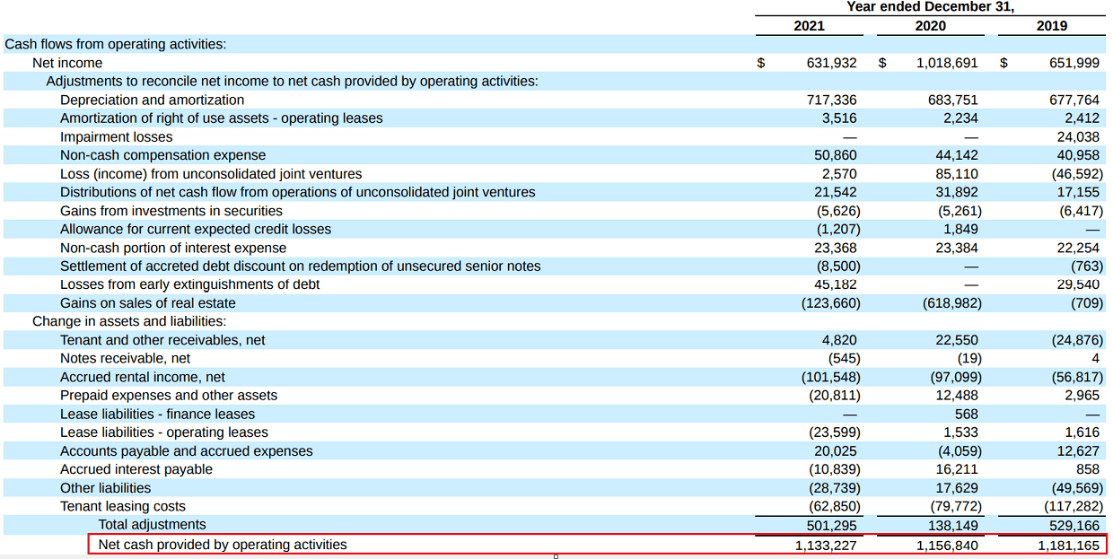
BXP’s Statement of Cash Flows from their 2021 annual report shows positive cash flow from operations in each year. The numbers are reported in thousands, so in 2021 BXP had positive cash flow from operations of $1.1 billion.
Capital Expenditures for BXP consist of Building / Capital Improvements and Tenant Improvements, which combined equals approximately $415 million in 2021.
BXP 10-K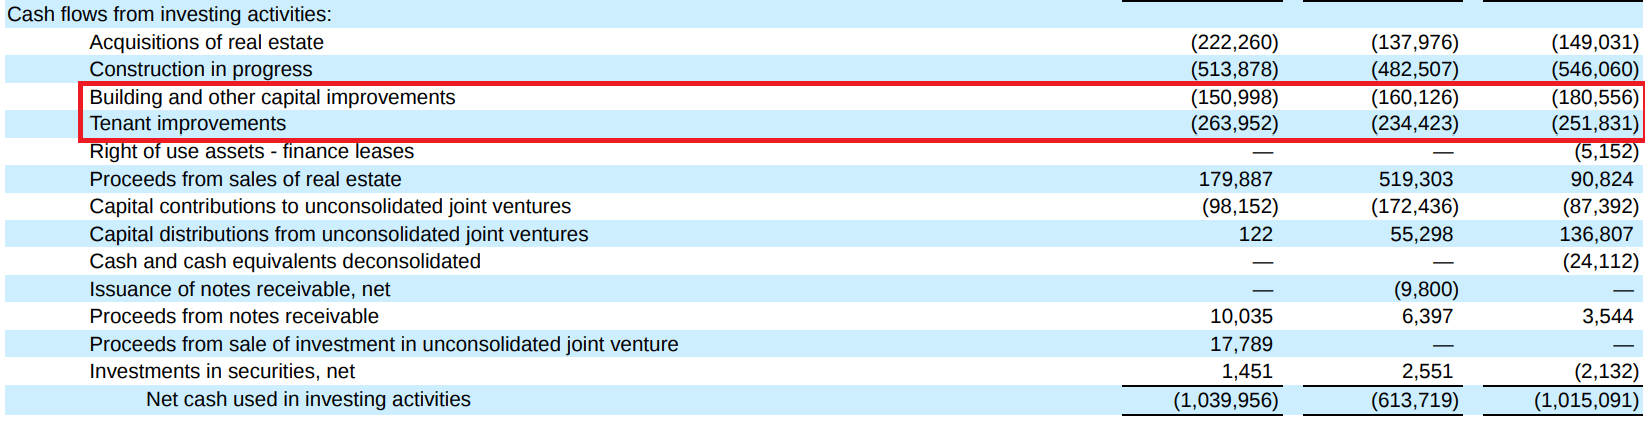
And finally, BXP dividends for years 2021, 2020, and 2019 are listed below:
BXP 10-K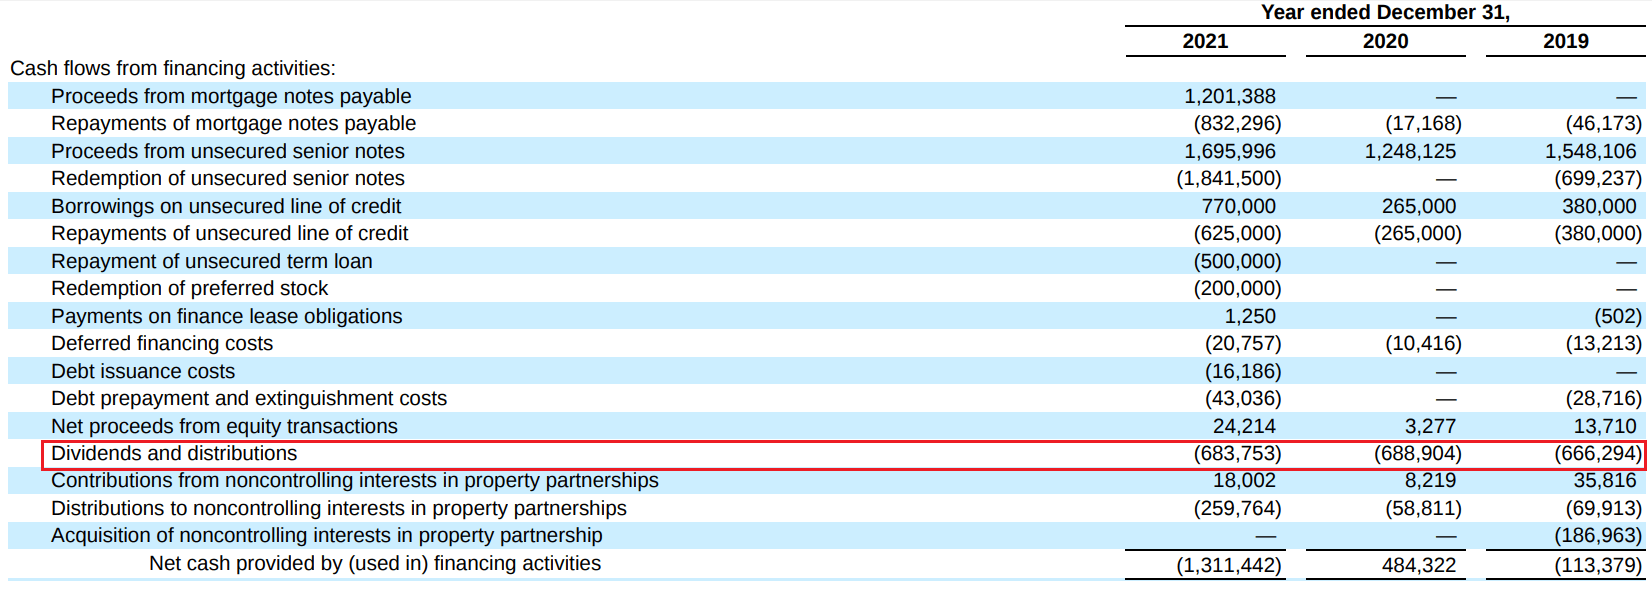
BXP’s Free Cash Flow was $263 million in 2021, $234 million in 2020 and $251 million in 2019. Their Free Cash Flow payout ratio was 95.19% in 2021, 90.37% in 2020 and 88.98% in 2019. With Free Cash Flow retained ranging from ~5% to 11%.
BXP 10-K, 2021 (compiled and calculated by iREIT)
Based on AFFO, their payout ratio for 2021 was 92.02%, 96.08% in 2020 and 88.86% in 2019. This metric has improved in 2022 with an AFFO payout ratio of 85.03%, leaving 14.97% of AFFO retained in 2022 for future investments.
FAST Graphs (compiled and calculated by iREIT)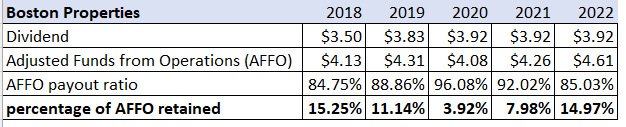
BXP has BBB+ credit rating, reasonable debt metrics and a good amount of liquidity at its disposal. It has consistently generated cash flow and made distributions to shareholders with cash left over for investment. At iREIT we rate BXP a STRONG BUY.
iREIT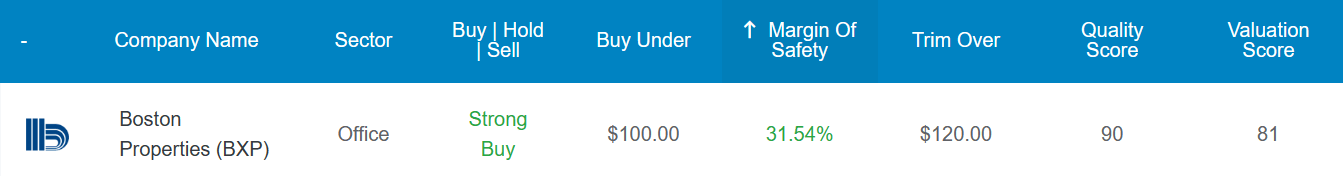
Equity Residential (EQR)
Equity Residential is a REIT focused on residential apartments. EQR has 308 properties that include 79,594 apartment units. They have a large presence in New York, Boston, Seattle, Washington DC, San Francisco and are expanding into Denver, Atlanta, Austin, and Dallas/Ft. Worth.
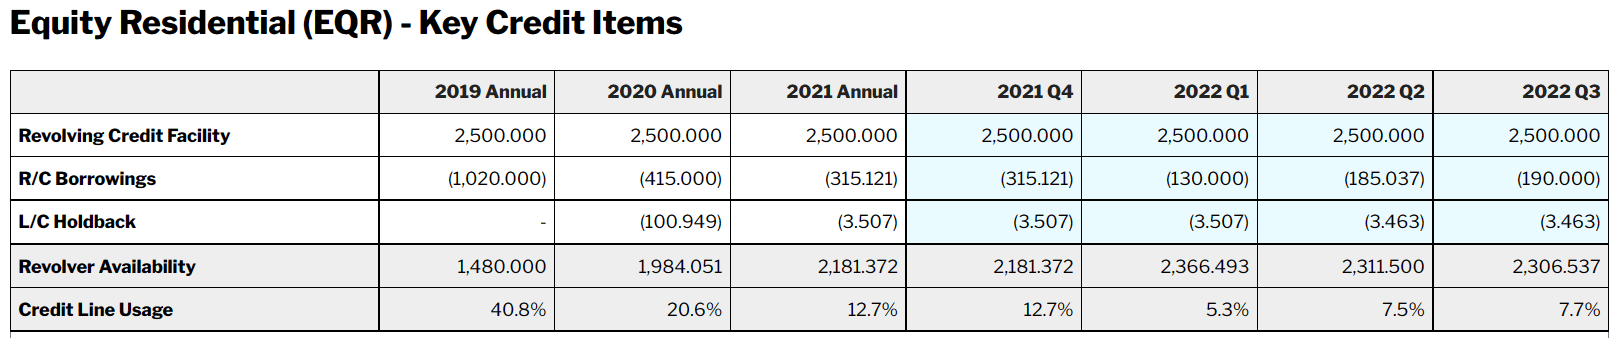
EQR has a large amount of liquidity. Its revolving credit facility has a total capacity of $2.5 billion, with $2.3 billion undrawn and available to them.
EQR Investor Presentation REIT/BASE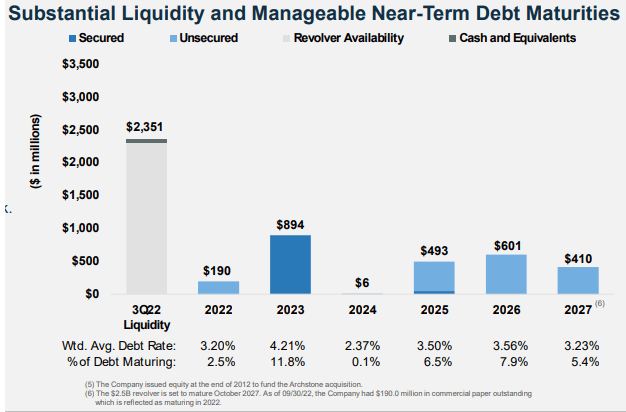
EQR has great credit and debt metrics with an investment grade rating of A-, a Net Debt to Normalized EBITDAre of 4.5x, a Fixed Charge Coverage of 6.2x, and a Debt to Total Assets of 28%.
EQR Investor Presentation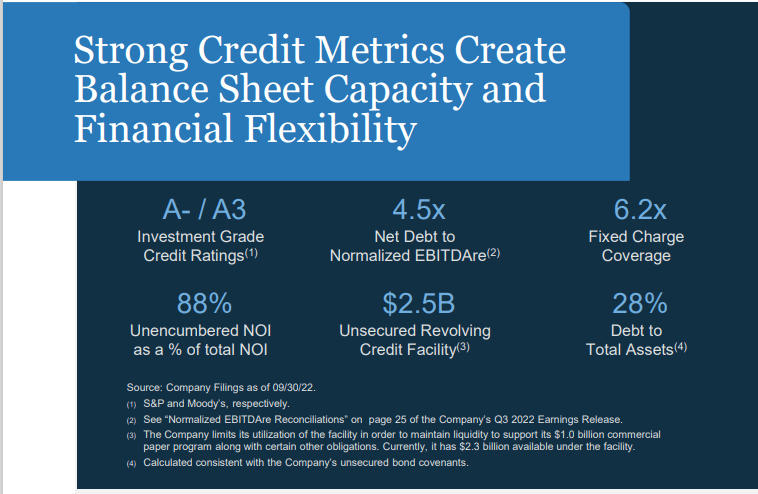
The debt metrics are good and have been trending in the right direction over the last decade. The chart below shows EQR’s leverage coming down from 7.9x in 2010 to 4.5x as of 3Q22. Likewise, their coverage ratio has been improving, with their Fixed Charge Coverage of 2.5x in 2010 significantly improving to its current level of 6.2x.
EQR Investor Presentation
EQR’s Statement of Cash Flows from their 2021 annual report shows positive cash flow from operations in each year. In 2021, EQR had positive cash flow from operations of $1.2 billion.
EQR 10-K 2021 EQR 10-K 2021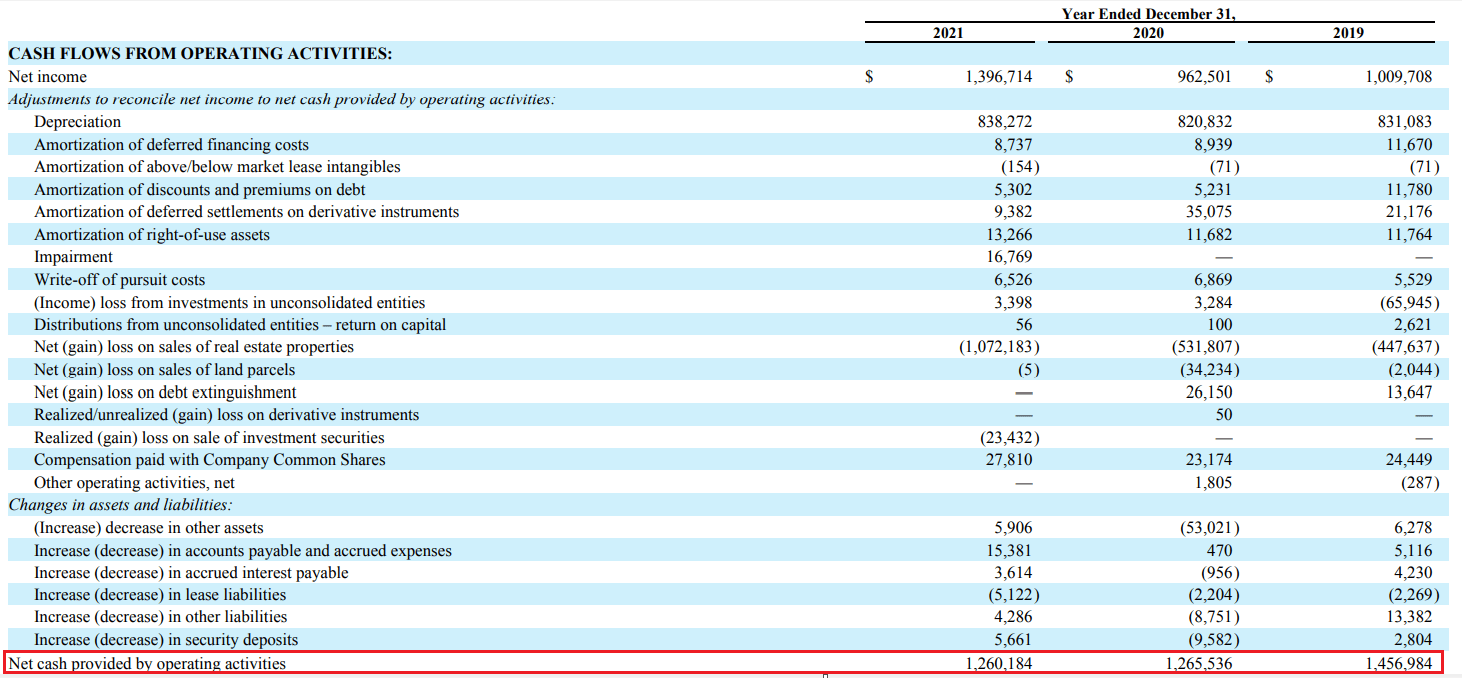

After subtracting Capital Expenditures from EQR’s Operating Cash Flow, it leaves the company with Free Cash Flow of $1.1 billion in the years 2021 and 2020 and $1.2 billion in 2019.
iREIT EQR 10-K 2021

EQR’s Free Cash Flow payout ratio was 84.81% in 2021, 82.43% in 2020 and 68.12% in 2019. With Free Cash Flow retained ranging from ~15% to 32%.
EQR 10-K 2021 (compiled and calculated by iREIT)
Based on AFFO, EQR’s payout ratio was 92.34% in 2021, 81.51% in 2020 and 72.03% in 2019. In 2022 the AFFO payout stands at 81.58%. Outside of 2021, EQR has been able to retain a good percentage of its AFFO, ranging from almost 20% to 28%.
FAST Graphs (compiled and calculated by iREIT)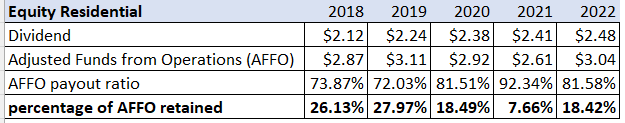
EQR has great credit and debt metrics and a large amount of liquidity available to them. It has steadily generated positive cash flow and made distributions to shareholders with cash left over for investment. At iREIT we rate EQR a STRONG BUY.
iREIT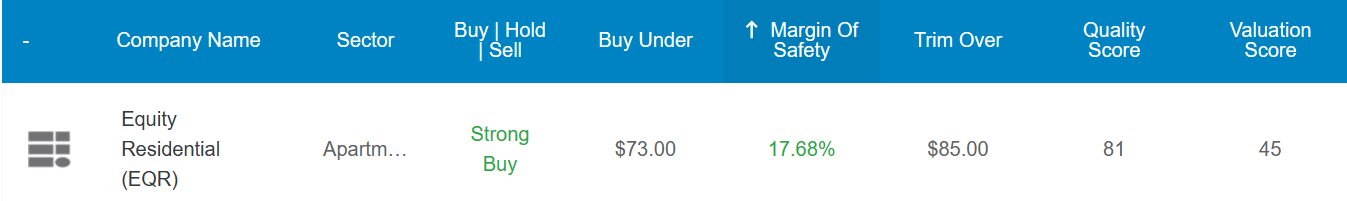
In Closing…
“Revenue is vanity, profit is sanity, but cash is king.” —Unknown.
The origin of this quote is unknown. The common consensus is that former Volvo CEO Pehr G. Gyllenhammar first used the expression in 1988 while discussing the global stock market crash of 1987.
During that time, companies with ample cash reserves weathered the markets better than those who had poor cash management.
What’s undebatable is that cash is king.
In college, I studied Peter Drucker, an influential Austrian-American author and consultant who is considered the father of modern business management. He sums up the point of this article nicely:
“Entrepreneurs believe that profit is what matters most in a new enterprise. But profit is secondary. Cash flow matters most.”
Be the first to comment