

stefanamer/iStock via Getty Images
A Quick Take On Neuraxis
Neuraxis, Inc. (NRXS) has filed proposed terms to raise $15 million in an IPO of its common stock, according to an amended S-1/A registration statement.
The firm is commercializing neuromodulation approaches to treating various health conditions in children.
Neuraxis is a tiny company that has produced contracting top line revenue from a small base, is generating increasing operating losses and wants investors to pay a high EV/Revenue multiple.
I’m on Hold for the IPO.
Neuraxis Overview
Carmel, Indiana-based Neuraxis was founded to develop its IB-Stim neuromodulation device for use in treating the following pediatric conditions:
-
Functional abdominal pain & irritable bowel syndrome
-
Chronic nausea
-
Post-concussion syndrome
-
Chemotherapy-induced nausea & vomiting
-
Cyclic vomiting syndrome.
A neuromodulation device can be used to alter the functioning of the nervous system. It typically involves the application of electrical, chemical or other forms of energy to specific parts of the body in order to stimulate or inhibit the activity of certain nerves and/or brain regions.
Common examples include deep brain stimulation, spinal cord stimulation, and vagus nerve stimulation. These devices are used for a variety of medical conditions, including Parkinson’s disease, chronic pain, depression, epilepsy and other neurological disorders.
Management is headed by President and CEO Brian Carrico, who has been with the firm since 2012 and was previously employed at Bard Medical and St. Jude Medical.
Below is the status of the firm’s FDA review pipeline:
Company Pipeline Status (SEC)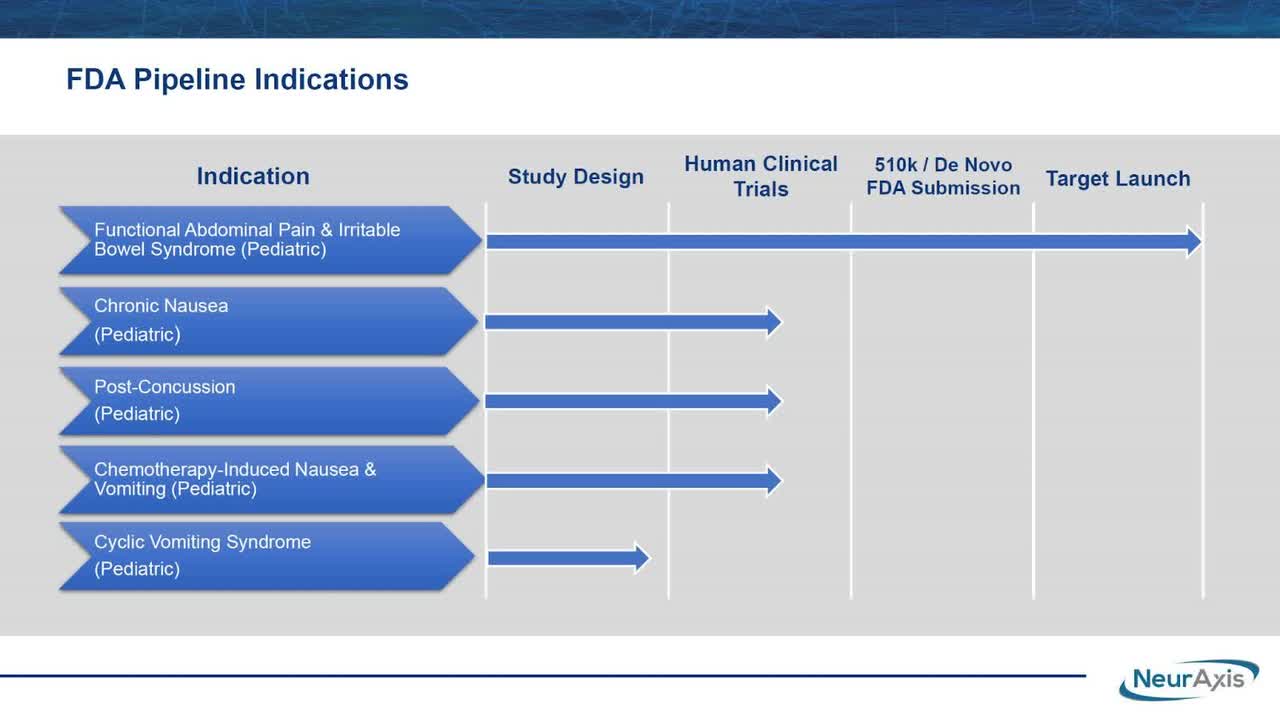
As of September 30, 2022, Neuraxis has booked fair market value investment of $28.4 million from investors including Masimo Corporation and Brian Hannasch.
Neuraxis – Customer Acquisition
Management has concentrated its marketing focus on 260 children’s hospitals in the U.S., of which 50 hospitals have acquired the firm’s IB-Stim product.
The company is developing its device for the treatment of additional related indications among persons 11 – 18 years of age.
Selling expenses as a percentage of total revenue have fallen as revenues have decreased, as the figures below indicate:
|
Selling |
Expenses vs. Revenue |
|
Period |
Percentage |
|
Nine Mos. Ended September 30, 2022 |
16.6% |
|
2021 |
16.8% |
|
2020 |
27.0% |
(Source – SEC.)
The Selling efficiency multiple, defined as how many dollars of additional new revenue are generated by each dollar of Selling spend, fell to negative (0.5x) in the most recent reporting period, as shown in the table below:
|
Selling |
Efficiency Rate |
|
Period |
Multiple |
|
Nine Mos. Ended September 30, 2022 |
-0.5 |
|
2021 |
1.7 |
(Source – SEC.)
Neuraxis’ Market & Competition
According to a 2019 market research report by Grand View Research, the global market for inflammatory bowel disease treatments is expected to reach $22 billion by 2026.
This represents a forecast CAGR (Compound Annual Growth Rate) of 4.4% from 2018 to 2026.
Key elements driving this expected growth are continued development of new products owing to a strong pipeline resulting in greater treatment options for patients.
Also, below is a chart showing the historical and forecast growth trajectory for various segments of the U.S. inflammatory bowel disease treatment market in the United States:
U.S. IBD Market (Grand View Research)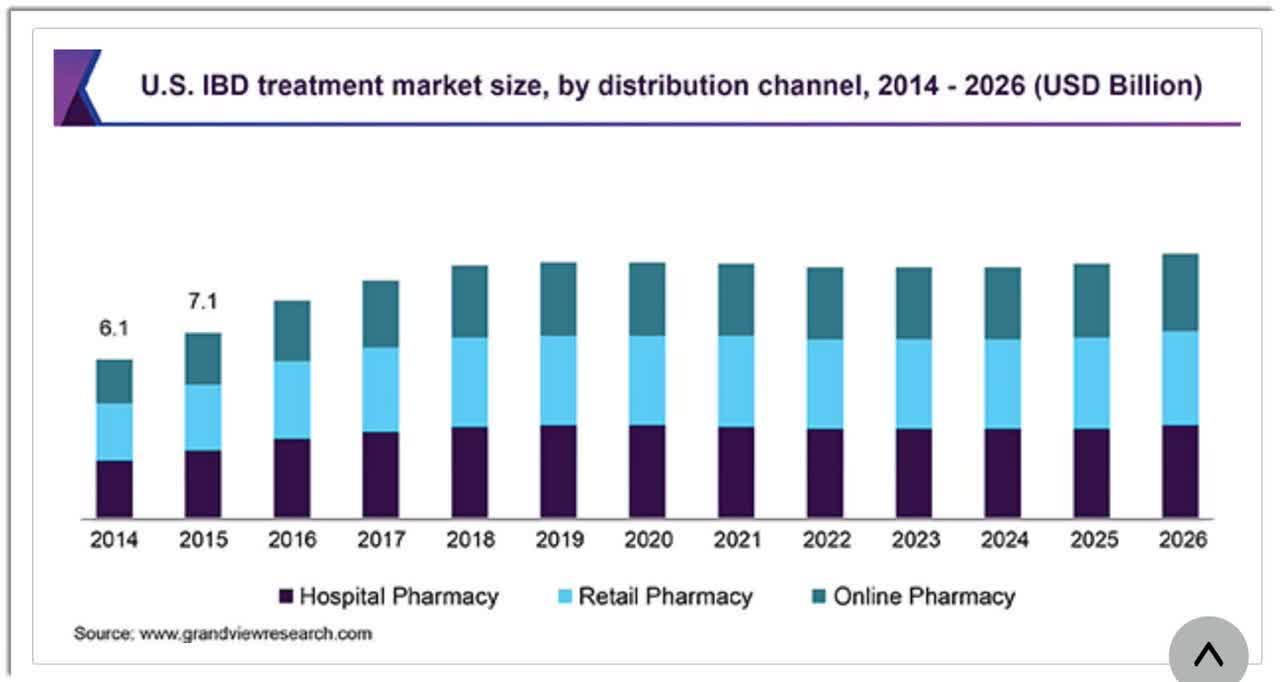
Major competitive vendors that provide or are developing related treatments include:
-
Takeda Pharmaceuticals
-
Abbvie
-
Janssen Pharmaceuticals
-
Pfizer
-
Bristol-Myers Squibb
-
Gilead Sciences
-
Abivax
-
Amgen
-
Arena Pharmaceuticals
-
Various medical device companies.
Neuraxis Financial Performance
The company’s recent financial results can be summarized as follows:
-
Dropping topline revenue, year-over-year
-
Lowered gross profit but higher gross margin
-
Higher operating losses
-
Increased cash used in operations.
Below are relevant financial results derived from the firm’s registration statement:
|
Total Revenue |
||
|
Period |
Total Revenue |
% Variance vs. Prior |
|
Nine Mos. Ended September 30, 2022 |
$ 2,071,653 |
-8.1% |
|
2021 |
$ 2,721,286 |
41.0% |
|
2020 |
$ 1,930,228 |
|
|
Gross Profit (Loss) |
||
|
Period |
Gross Profit (Loss) |
% Variance vs. Prior |
|
Nine Mos. Ended September 30, 2022 |
$ 1,849,807 |
-0.3% |
|
2021 |
$ 2,253,630 |
55.5% |
|
2020 |
$ 1,449,139 |
|
|
Gross Margin |
||
|
Period |
Gross Margin |
|
|
Nine Mos. Ended September 30, 2022 |
89.29% |
|
|
2021 |
82.81% |
|
|
2020 |
75.08% |
|
|
Operating Profit (Loss) |
||
|
Period |
Operating Profit (Loss) |
Operating Margin |
|
Nine Mos. Ended September 30, 2022 |
$ (2,386,012) |
-115.2% |
|
2021 |
$ (2,970,034) |
-109.1% |
|
2020 |
$ (4,120,738) |
-213.5% |
|
Net Income (Loss) |
||
|
Period |
Net Income (Loss) |
Net Margin |
|
Nine Mos. Ended September 30, 2022 |
$ (4,766,433) |
-230.1% |
|
2021 |
$ (3,028,032) |
-146.2% |
|
2020 |
$ (3,726,149) |
-179.9% |
|
Cash Flow From Operations |
||
|
Period |
Cash Flow From Operations |
|
|
Nine Mos. Ended September 30, 2022 |
$ (2,083,689) |
|
|
2021 |
$ (2,234,326) |
|
|
2020 |
$ (4,139,329) |
|
(Source – SEC.)
As of September 30, 2022, Neuraxis had $7,820 in cash and $6.9 million in total liabilities.
Free cash flow during the twelve months ended September 30, 2022, was negative ($2.3 million).
Neuraxis IPO Details
NRXS intends to sell 1.875 million shares of common stock at a proposed midpoint price of $8.00 per share for gross proceeds of approximately $15.0 million, not including the sale of customary underwriter options.
No existing or potentially new shareholders have indicated an interest in purchasing shares at the IPO price.
Assuming a successful IPO at the midpoint of the proposed price range, the company’s enterprise value at IPO (excluding underwriter options) would approximate $27.4 million.
The float to outstanding shares ratio (excluding underwriter options) will be approximately 36.9%. A figure under 10% is generally considered a ‘low float’ stock which can be subject to significant price volatility.
Per the firm’s most recent regulatory filing, it plans to use the net proceeds as follows:
Proposed Use Of Proceeds (SEC)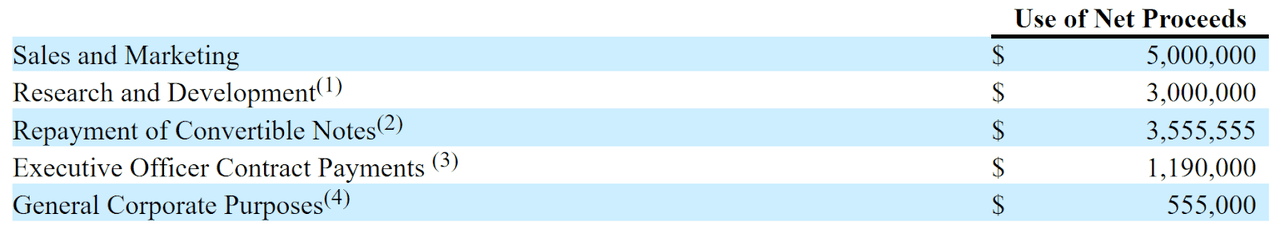
(Source – SEC.)
Management’s presentation of the company roadshow is available here until the IPO is completed.
Regarding outstanding legal proceedings, the firm is being sued for various damages in excess of $5 million, is defending itself and believes the charges are without merit.
The sole listed bookrunner of the IPO is Alexander Capital.
Valuation Metrics For Neuraxis
Below is a table of the firm’s relevant capitalization and valuation metrics at IPO, excluding the effects of underwriter options:
|
Measure [TTM] |
Amount |
|
Market Capitalization at IPO |
$40,660,392 |
|
Enterprise Value |
$27,352,572 |
|
Price / Sales |
16.02 |
|
EV / Revenue |
10.78 |
|
EV / EBITDA |
-8.48 |
|
Earnings Per Share |
-$1.05 |
|
Operating Margin |
-127.14% |
|
Net Margin |
-221.36% |
|
Float To Outstanding Shares Ratio |
36.89% |
|
Proposed IPO Midpoint Price per Share |
$8.00 |
|
Net Free Cash Flow |
-$2,292,088 |
|
Free Cash Flow Yield Per Share |
-5.64% |
|
CapEx Ratio |
-178.35 |
|
Revenue Growth Rate |
-8.11% |
(Source – SEC.)
Commentary About Neuraxis
NRXS is seeking U.S. public capital market funding to continue its R&D efforts and commercialization of its approved treatment indication.
Neuraxis’ financials have produced contracting topline revenue, year-over-year, reduced gross profit year-over-year but higher gross margin, increasing operating losses and rising cash used in operations.
Free cash flow for the twelve months ended September 30, 2022, was negative ($2.3 million).
Selling expenses as a percentage of total revenue have dropped as revenue has decreased; its Selling efficiency multiple was negative (0.5x) in the most recent reporting period.
The firm currently plans to pay no dividends on its common stock and to reinvest any future earnings back into the firm’s R&D and commercialization initiatives.
NRXS’ trailing twelve-month CapEx Ratio was high, which indicates it has spent lightly on capital expenditures despite operating cash use.
The market opportunity for treating IBS and related conditions is large and expected to grow at a moderate rate of growth through 2026.
Alexander Capital is the sole underwriter and the one IPO led by the firm over the last 12-month period generated a return of negative (43.8%) since its IPO. This is a lower-tier performance for all major underwriters during the period.
Risks to the company’s outlook as a public company include its tiny size, thin capitalization and contracting year-over-year revenue in the most recent period.
As for valuation, management is asking investors to pay an Enterprise Value / Revenue multiple of 10.8x on contracting topline revenue from a tiny base.
Neuraxis has produced contracting topline revenue from a tiny base, increasing operating losses and wants investors to pay a high EV/Revenue multiple.
So, I’ll pass on the IPO.
Expected IPO Pricing Date: To be announced.
Be the first to comment