

JasonDoiy
Netflix (NASDAQ:NFLX), one of the pioneers of the subscription-based model, has been on a roller coaster ride lately. During their latest earnings report, the big news stated that Netflix is back on track, growing its subscriber base and divesting into the high-margin advertising business. While this might be true, the fear persists that the high growth rates in their subscriber count have ended. Given its current price and the uncertainty around its future, Netflix needs to offer a larger margin of safety for my risk profile. Thus, I rate Netflix as “Hold”.
I still like the business; Netflix has the potential to become one of those famous “long-term compounders”. Its average revenue per user (ARPU) has been consistently increasing over the past few years, it produces one hit show after another, it is entering the highly profitable Ads business, and working on its gaming offering. Time will tell if Netflix can convert this potential into cash flows for its shareholders.
Total Addressable Market
According to CFO Spencer Adam Neumann, Netflix’s total addressable market is between 800 million to 900 million. Let’s do some quick math to see if those numbers are reasonable. Currently, the global population is sitting around 8 billion. More than 5 billion of them have access to the internet. Netflix operates in 190 countries, excluding China, Syria, North Korea, and Russia, which reduces the TAM by approximately 1.5 billion. Furthermore, most people live in an average household of nearly five people. With those assumptions, we reach a TAM of close to 700 million households. This number is lower than the expected TAM from management but still in the same ballpark.
According to management, most of Netflix’s revenues come from streaming services, representing a ~$300 billion industry. Recently, Netflix entered the branded advertising (~$180 billion) and gaming (~$130 billion) markets. Altogether, Netflix’s revenues represent roughly 5% of its TAM. If management’s stated numbers are accurate, there is potential for a lot of growth ahead.
The Hamster Wheel
For a long time, Netflix’s selling point to Wall Street has been its enormous subscriber growth. Netflix finished Q4’21 with 221.84 million paying subscribers. This ability to add subscribers at a fast pace pushed its stock price up to a staggering $700 per share in November 2021. This story changed in 2022. The headline of Netflix’s Q1’22 report was devastating: a loss of 0.2 million subscribers. Before the news came out, Netflix’s stock had already been hammered, falling approximately 50% from its peak. After the report, the stock continued to tumble and reached a low of ~$160. It took six painful months before some good news surfaced. In Netflix’s latest earnings report (Q3’22), they seemed to reverse the trend to subscriber growth, adding 2.41 million new subscribers. That news was well received by the market as the stock quickly shot up. This enormous volatility in the stock price shows how sensible Netflix is to its subscriber count. It seems like management has dug a hole on that metric and is not getting out of it.
In Netflix’s early days, when it was a high-growth and money-losing company, it was helpful to focus on its subscriber count. But today, with a wider range of income streams such as advertising and paid sharing, management is trying to shift its focus towards revenues as the primary top-line metric. This is a critical change in Netflix’s story, as the growth in subscriber numbers has slowed down and will probably continue to be flat in the coming quarters. Will Netflix succeed in shifting Wall Street’s focus from subscriber growth to top and bottom-line growth? This question will likely be answered over the next few quarters as we see Netflix’s investments in gaming and the high-margin ad business play out.
The Transition
To smoothen the transition away from subscriber growth, Netflix’s management wants to address account-sharing. Account-sharing has always been part of Netflix’s story. Early on, Netflix used it as a marketing tool and even promoted it; however, over the past few quarters, that stance has changed. In its Q1’22 letter to shareholders, management addressed the topic and stated that people who use Netflix’s services should pay their fair share. Netflix management estimates that ~100 million households use their service without paying. Of those 100 million, they estimate ~30 million are part of the highly profitable UCAN (United States, Canada, Australia, and New Zealand) region. In the past months, Netflix has come up with an approach to monetize these shared accounts. Accounts will be allowed to create a sub-account (extra member) for an additional charge. This enables users to own their personal sub-account, which comes with all the benefits that Netflix provides for its users (e.g., viewing history and recommendations). This could represent a profitable opportunity for Netflix: they earn additional revenue and collect more data to improve their recommendation algorithms. The roll-out will take place more broadly in early 2023.
Last but not least, Netflix’s entry into Ads could also present a huge opportunity. Netflix launched an ad-supported subscription, priced below the other subscription models. Subscribers are granted access to the basic plan at a lower price in exchange for a few minutes of advertising per hour. Those advertising minutes can be highly profitable for Netflix as the advertising business is known to be a capital-light and high-margin business. On the downside, this lower-priced subscription plan might lead some price-sensitive subscribers to trade down, especially during the current uncertain economic environment where inflation is high, and consumers are looking for ways to cut spending.
Regarding profitability, management does not expect this additional revenue to move the needle in the short term, but it could present a decent upside in the long term. In the Q3’22 earnings call, when asked about the CPM, Netflix Chief Product Officer Greg Peters, confirmed they were getting “a very attractive offering”. (There have been rumors that CPM was around $65.)
Doing some quick math, we can estimate what Netflix’s break-even CPM would be, using the U.S. numbers (Note that prices vary across regions, and implementing the Ad business will require investments in labor, R&D, and infrastructure):
Amount to break even: $9.99 – $6.99 = $3
Advertising time per hour = 4 to 5 minutes (240 to 300 seconds)
Ad Format: 15 or 30 seconds in length
Daily Netflix consumption assumption: 1 hour per day (I was not able to find a reliable source; estimates fluctuate between 1 and 3.2 hours per day)
(240 to 300) / (15 to 30)) = 8 to 20 ads per hour (and per day assuming 1 hr/day of consumption)
This would result in 240 to 600 Ads per month.
($3 * 1000) / (240 to 600) = $5 to $12.50
To break even, Netflix would need to charge between $5 and $12.50 per 1000 impressions. This number is way below the rumored $65, so we could make a case that the Ad business can be highly profitable once fully implemented.
The Competition
The streaming business is highly competitive. Companies are fighting for one of the most valuable goods: consumers’ time. When Netflix launched its streaming business in 2007, its main competitor was linear TV. Over the past few years, especially since the COVID pandemic, new companies began floating into the market. Well-funded companies began launching products like Disney+ (DIS) and Prime Video (AMZN) and started taking market share from Netflix. More minor streaming services did the same, like HBO (WBD), Pluto TV (PARA), and Hulu (DIS & CMCSA). Even YouTube (GOOG & GOOGL) and TikTok are now regarded as competitors.
One advantage that Netflix possesses over its competitors is that Netflix has already shown that it is profitable. In Netflix’s Q3’22 shareholder letter, management stated that they expect their competitors to have combined 2022 operating losses of well over $10 billion. Of course, such comments always need to be met with a certain amount of caution.
Engagement
TV Usage (Nielsen.com)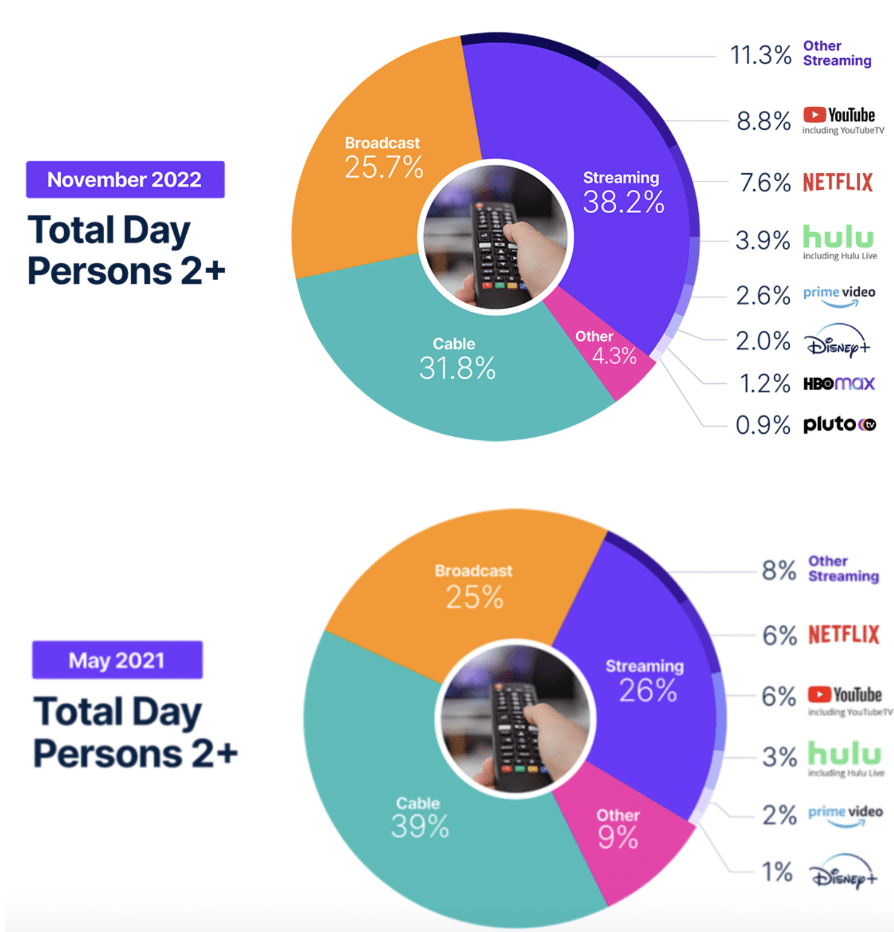
Research by Nielsen suggests a shift towards streaming services and a rise in competition in this area. While Netflix had to compete with four other “big” players in 2021, by 2022, there are already six. YouTube has surpassed Netflix, but its 8.8% share includes YouTube TV, the platform’s streaming cable subscription. Also, note that this graph only represents the time spent watching television and does not include mobile devices.
Another source provided by Netflix’s management to provide insights into the engagement the streaming businesses generate is BARB. According to BARB, in the UK, Netflix accounts for 8.2% of video viewing, 2.3x more than Amazon (3.6%) and 2.7x more than Disney+ (3.0%).
Content
Netflix Content Spending (Company Financials)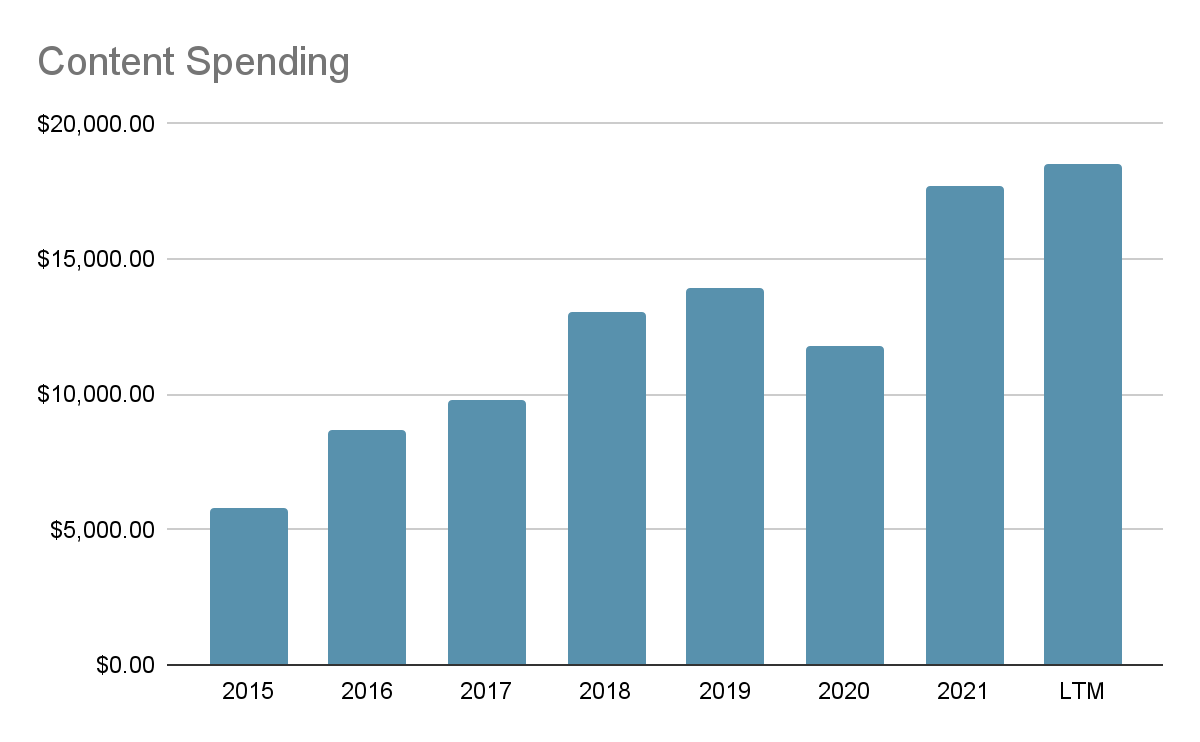
What drives user engagement is the quality of content. The streaming services mainly compete on two fronts: TV Series and Movies.
Over the past few years, Netflix has steadily increased its content spending, from $5.77 billion in 2015 to $17.7 billion over the last twelve months. This led to several significant additions to its series and movies library. According to data from Nielsen, in 2020, of the ten most-watched series (measured in terms of minutes streamed), nine were Netflix originals. However, Netflix looked weak compared to its competitors regarding movies. Only three top ten movies were from Netflix. Disney+ produced the other seven. Looking at data from 2021, Netflix again had a strong showing in the series category, owning 12 of the top 15, whereas Hulu, Apple TV, and Disney+ provided only one each. When looking at movies, only 3 of the top 15 were from Netflix, 11 came from Disney+, and one was from Amazon.
Netflix is well represented in both categories, making them a strong competitor. Netflix dominates the series category, while Disney+ is the dominant force in movies.
Valuation
Netflix’s Content Commitments
To produce content, Netflix typically enters multi-year contracts with studios and other content providers. When signing such agreements, Netflix enters contractual obligations for the future, and failing to meet these obligations could risk the firm’s survival. Currently, Netflix’s content commitments are considered operating expenses, and accountants treat them that way. One could make a case that Netflix’s content commitments could be considered as debt, as the essence of debt is a contractual obligation for the future, and a failure to meet this obligation can put the company’s survival at risk.
In the following approach, we treat Netflix’s content commitments as what they are, namely debt, and look at what effects this has on Netflix’s profitability, leverage and value compared to the accounting approach (treating content commitments as an operating expense). To convert content commitments to debt, we need to follow a few steps and collect data from Netflix’s earnings reports. (This idea is based on a paper written by Aswath Damodaran 2009)
In the first step, we list all of Netflix’s content commitments for the future. They can be found in Netflix’s 10-K:
Content Commitments (Company Financials)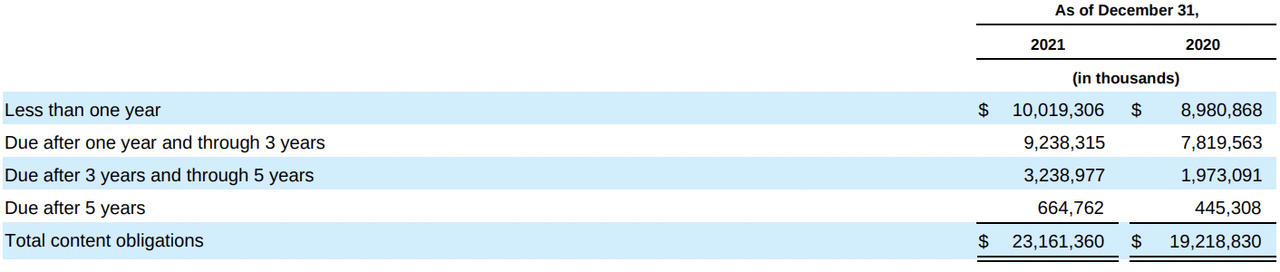
-
We also need the following accounting measures from Netflix (data is computed using LTM numbers):
- Stated Total Debt: $16,432.20
- Stated Operating Income: $5,714.70
In the second step, we calculate the present value of the content commitments. To come up with the present value, we need to compute the pre-tax cost of debt based on the firm’s default risk. We use the current 10-year U.S Treasury Bond yield as a risk-free rate. To come up with a default risk, we use Netflix’s BBB rating. (We use the pre-tax cost of debt because the content commitments are pre-tax commitments. We can get a tax benefit from it, but we haven’t subtracted it yet.)
- Pre-tax Cost of Debt = Risk Free Rate + Company Default Spread = 3.69% + 1.59% = 5.28%
We calculate the present value of content commitments using the pre-tax cost of debt as our discount rate. Since we do not have an accurate amount for every year, we use averages as an approximation (ex., $9,238.315 is due between years 1 to 3. So we divide the entire amount by three and get a commitment of $3,079.43 for each year.) We use a lump sum after year five because that is how it is reported.
To get to the present value, we use the following calculation:
- Commitment / (1 + Cost of debt)^Year
Present Value of Content Commitments (Google Sheets)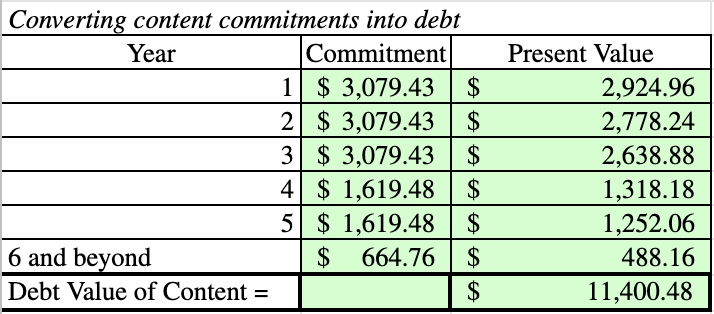
Since a balance sheet needs to balance and we just created more debt on the liability side of the balance sheet, we need to create an asset of exactly the same value. (Let’s call it “content commitments asset”)
- Adjusted Total Debt for Netflix = Present Value of Content Commitments + Stated Total Debt = $11,400.48 + $16,432.20 = $27,832.68
Once we convert content commitments into debt, the current operating income has to be adjusted to reflect the change. First, we need to add the content commitments back to the stated operating income since it should have never been subtracted. Second, the content commitments asset will now have to be depreciated, and the depreciation will reduce the operating income:
- Adjusted Operating Income = Stated Operating Income + Expected Content Commitments this Year – Depreciation on Content Commitments
To calculate the amount we are going to depreciate, we use straight-line depreciation (We use the average content commitment expense over the first five years to estimate the number of years of expenses in year 6):
- Depreciation = $11,400.48 / 5 = $2,280.10
- Adjusted Operating Income = $5,714.70 + $10,019.306 – $2,280.10 = $13,453.91
We also intend to compare the cost of capital in both approaches. To compute the cost of capital, we use the costs of debt and equity for the firm and weigh them based on market value. To compute the cost of equity, we start with an unlevered bottom-up beta. From there, we compute a levered beta using the market debt-to-equity ratio of the firm. Since we converted content commitments into debt, our debt ratio changes; hence we get different betas and different costs of equity. The cost of debt stays the same in both cases, as the risk-free rate and the company’s default rating do not change.
- Cost of Equity = Risk Free Rate + Beta * Equity Risk Premium
We also look at the reinvestment needs. To do this, we use a sales-to-capital ratio. This ratio connects the revenues to the total capital invested in a company. We use revenues as a nominator because revenues are a driver of growth. In the denominator, we use the firm’s invested capital (equity + debt) and subtract cash. This ratio shows how much output a company will generate with one dollar invested capital.
- Sales-to-capital Ratio = Revenues / (Equity + Debt – Cash)
The following table resumes all the effects the conversion has. It gives investors a different perspective on how Netflix’s operating income, operation margins, debt, cost of capital, and reinvestment needs look and compare it to the accounting view.
| Accounting View | Investor View |
| Stated operating income = $5,714.70 |
Adjusted operating income = $13,453.91 |
| Operating margin = stated operating income / revenues = $5,714.70 / $31,472.82 = 18.16% | Adjusted operating margin = adjusted operating income / revenues = $13,453.91 / $31,472.82 = 42.74% |
| Only the stated total debt of $16,432.20 will show up on the balance sheet. |
Adjusted debt for Netflix = $27,832.68Content commitments asset = $11,400.48
|
| Cost of capital = 13.60% * ($116,056.77 / $132,489) + 3.86% * ($16,432 / $132,489) = 12.39% | Cost of capital = 14.25% * ($116,056.77 / $143,889) + 3.86% * ($27,833 / $143,889) = 12.24% |
|
Return on capital = after tax operating income / invested capital = $5,714.70 * (1 – 0.1270) / ($20,528.14 + $16,432.20 – $6,113.73) = 16.17%
|
Return on capital = after tax operating income / invested capital = $13,453.91 * (1 – 0.1270) / ($20,528.14 + $27,832.68 – $6,113.73) = 27.80% |
| Sales-to-capital ratio = revenues / invested capital = $31,472.82 / ($20,528.14 + $16,432.20 – $6,113.73) = 1.02 | Sales-to-capital ratio = revenues / invested capital = $31,472.82 / ($20,528.14 + $27,832.68 – $6,113.73) = 0.75 |
When we treat the content commitments as debt and not as an operating expense, we move some expenses from above the operating income line to below. As a result, Netflix’s operating income will increase from $5,714.70 to $13,453.91, making Netflix look more profitable on an operating income base. Not only will the operating income increase, but the operating margin also increases substantially from 18.16% to 42.74%, stating that Netflix is very profitable on its marginal dollar of revenue. The bottom line should stay the same as interest expense will rise to reflect that Netflix’s debt has gone up. Looking at the balance sheet, we notice that the debt has ballooned from $16,432.20 to $27,832.68, reflecting Netflix’s increased leverage. This gives us a better sense of what the firm really owes. When the company’s debt level goes up, the cost of capital usually goes down, as it is cheaper to raise debt than to raise equity. This can also be seen in Netflix’s case, as the cost of capital decreases from 12.39% to 12.24%.
Not only has the cost of capital decreased, but the return on invested capital has increased substantially from 16.17% to 27.80%. This shows that Netflix is way more efficient in allocating capital than the accounting numbers state. On the downside, Netflix has to reinvest a lot more to get its revenues, as converting content commitments into debt decreases the sales-to-capital ratio from 1.02 to 0.75.
Converting Netflix’s content commitments into debt gives us a different perspective on its financials: On the one hand, operating income, operating margins, and ROIC increase while the cost of capital decreases. On the other hand, its debt will increase substantially, making it a riskier company, and Netflix will need to reinvest more to get its revenues.
Effect on Value
To see the effect on the value, we use a DCF model. We will value Netflix twice. First, we treat its content commitments as an operating expense, like Netflix’s financials report. Afterward, we’ll convert the content commitments into debt and value the company again, using the higher operating income, higher operating margins, and lower discount rate but increasing the reinvestment needs.
In both cases, we will keep the growth rates at 10%, giving Netflix revenues of around $72 billion in year 10. The steady-state growth rate will equal the economy’s growth rate (we use the 10-year U.S. T.Bond rate as a proxy). In both cases operating margins will increase as the Ad business is a high-margin opportunity, and we assume that over time Netflix will become more cost-efficient. (In the first case, margins will increase more than in the second, coming from the fact that in the second case, margins are already high.)
| Content commitments treated as an operating expense | Content commitments treated as debt. | |
| Revenue growth in year 1 to 5. Afterward it slowly decreases to the growth rate of the economy. | 10% | 10% |
| Basic operating income | $5,714.70 | $13,453.91 |
| Operating margin | 18.16% | 42.83% |
| Target operating margins in year 10 | 25% | 44% |
| Cost of capital | 12.39% | 12.24% |
| Sales-to-capital ratio | 1.02 | 0.75 |
- Value if we treat content commitments as an operating expense: ~$210
- Value if we convert content commitments into debt: ~$330
The effects of a higher operating income, higher operating margin, and a lower cost of capital can clearly be seen, as it pushes the company’s value up by 57%.
Risks
Apart from the sensitivity to subscriber growth, rising competition, and low flexibility in their cost structure due to high fixed costs, Netflix also faces headwinds from the current uncertain economic environment.
Unpredictable events such as the war in Ukraine have already impacted Netflix’s subscriber base (Netflix stopped its service in Russia, leading to a loss of 700.000 paid subscribers). The raging inflation poses another problem, pushing the FED to raise interest rates. As a reaction, consumers might cut down on discretionary spending (canceling their Netflix subscription or trading down to the lower-priced Ad-based subscription), and businesses might cut their spending on advertising, making the Ad-based subscription less profitable.
A more concerning problem is the increase in U.S. dollar strength. A big chunk of Netflix’s revenues comes from outside the U.S., while most of their costs are dollar-denominated. This will probably cause a future drag on their revenues and margins. Management attributes most of Netflix’s headwinds to the strengthening dollar, as in their last earnings call, they stated that FX headwinds cause ~$1 billion of revenue drag.
Conclusion
Regarding user engagement and content quality, Netflix has established itself as a dominant player in the market. Its experience and the years of collecting user data for its recommendation algorithm are paying off. In the long term, Netflix shows a lot of potential, especially when their divestitures in the Ad and gaming business succeed, as those markets offer a lot of growth. There is also some money to be made from signing new members from their shared account offering.
In the short term, there might be some pain ahead. The rising competition, especially from the likes of the deep-pocketed players Disney and Amazon, will continue to take market share from Netflix. Moreover, the transition from Wall Street’s focus on subscriber growth to top and bottom-line revenue growth will take some time. The stock will probably undergo several up-and-down swings during this transition, presenting trading opportunities.
We can take two different perspectives when looking at the value that Netflix currently offers. The stock is overvalued when we treat Netflix’s content commitments as an operating expense. When we convert Netflix’s content commitments into debt, Netflix looks undervalued.
Regarding a final decision, I’d consider Netflix a “hold ” due to the current price and the economic uncertainty.
Be the first to comment