

RiverNorthPhotography/iStock Unreleased via Getty Images
National Retail Properties (NYSE:NNN) is a REIT that invests primarily in high-quality properties subject to long-term net leases. Their tenant-mix is highly diversified with no single tenant accounting for over 5% of total base rent. In addition, their real estate portfolio is consistently near 100% occupancy and collections are nearly 100% as well.
The simple business model of the company generates stable and predictable income for the business. The income generated is then used to fund future acquisitions and shareholder payouts. In 2021, NNN increased their dividend for the 32nd consecutive year. In addition to a fully covered dividend, the company had +$171M in cash on hand, +$1.1B available on their credit facility, and no near-term debt maturities.
Despite their fundamental strengths, the stock has yet to recover to pre-pandemic pricing and is currently underperforming compared to the broader market. At current pricing, shares in the stock offer new and existing shareholders a dividend yield of 4.6% and upside potential in excess of 10%.
Business
NNN is a publicly traded REIT that owns a diversified portfolio of freestanding retail stores across the United States. The properties are leased primarily to retail tenants under long-term net leases.
In 2021, the company reported +$726M in total revenues. Of this total, automotive services and convenience stores accounted for approximately 30% of total base rent, as shown in the summary below from the annual 10-K filing. Aside from these two lines of trade, no other group accounted for more than 10% of total rent.
Tenant Mix – Form 10-K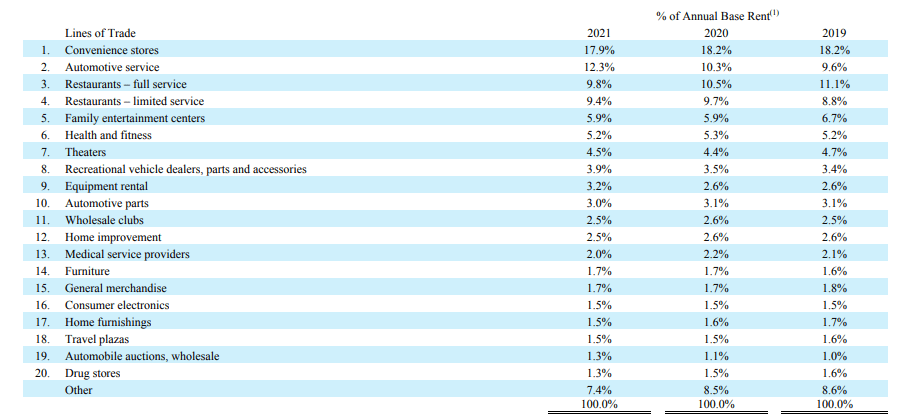
Drilling into specific tenants, the top five accounted for approximately 20% of total base rent. As shown below, 7-Eleven is their largest tenant, and they accounted for 4.9% of total base rent.
Top Tenants – Investor Presentation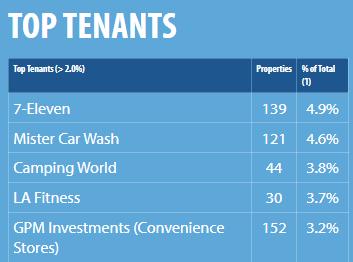
From a geographical standpoint, the company is diversified across the U.S., but they do have a heavy presence in Texas and Florida, who together account for about 25% of total base rent.
Geographical Exposure – Form 10-K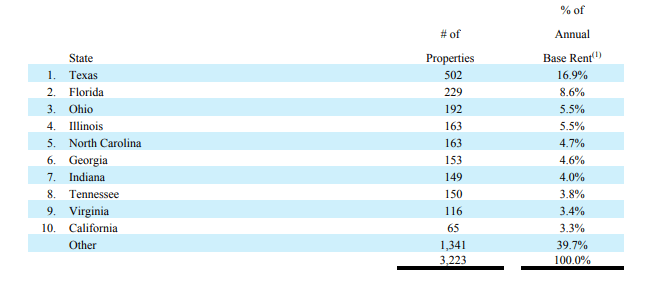
Overall, the REIT owned over 3,200 total properties in 48 states with a weighted average remaining lease term of 10.6 years. Additionally, 99% of the properties were leased as of year-end.
Competition
NNN competes against many other companies for net-lease investment opportunities in commercial properties. The commercial real estate market in general is large with many companies, both private and public, competing for new tenants. Additionally, the barriers to entry are low, which further increases competition in the sector.
Below are the characteristics of several peers within the industry, available within Seeking Alpha’s Peer Comparison Tool. NNN’s market cap is under +$10B, which is similar to most other peers except Realty Income (O) and W. P. Carey (WPC). NNN does have fewer employees than most, however. Competition with larger peers is a challenge for the company because their competition will likely have greater financial and operational resources to capture new market share.
Seeking Alpha Peer Comparison Tool – Market Cap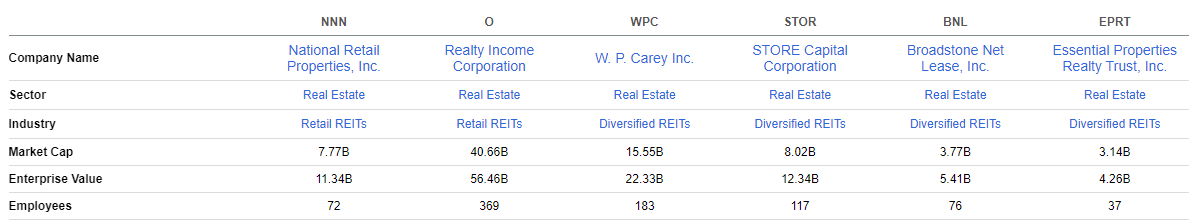
Total returns over the past month are comparable to the industry but have lagged for the past year. Four of the listed peers are up double-digits over the past year, while NNN is up only 5%. The results are still better than STOR, however, who seems to be greatly underperforming. From a broader market standpoint, the S&P is down 3% YTD and up 7% for the month. This is in comparison to NNN, who is down 6% YTD and up only 4% for the month. Overall, NNN is underperforming both the market and their peers.
Seeking Alpha Peer Comparison Tool – Total Returns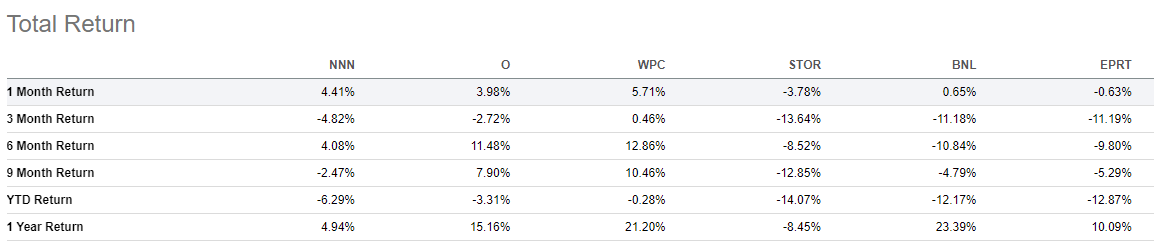
On valuation, NNN appears to be undervalued when considering several pricing multiples. For example, NNN’s forward P/E multiple of 25x is lower than all their peers. In addition, it is lower than their five-year average of 31x. Furthermore, their EV/EBITDA multiple is also lower than their five-year average of 19x and better or comparable to most of their competition.
Seeking Alpha Peer Comparison Tool – Valuation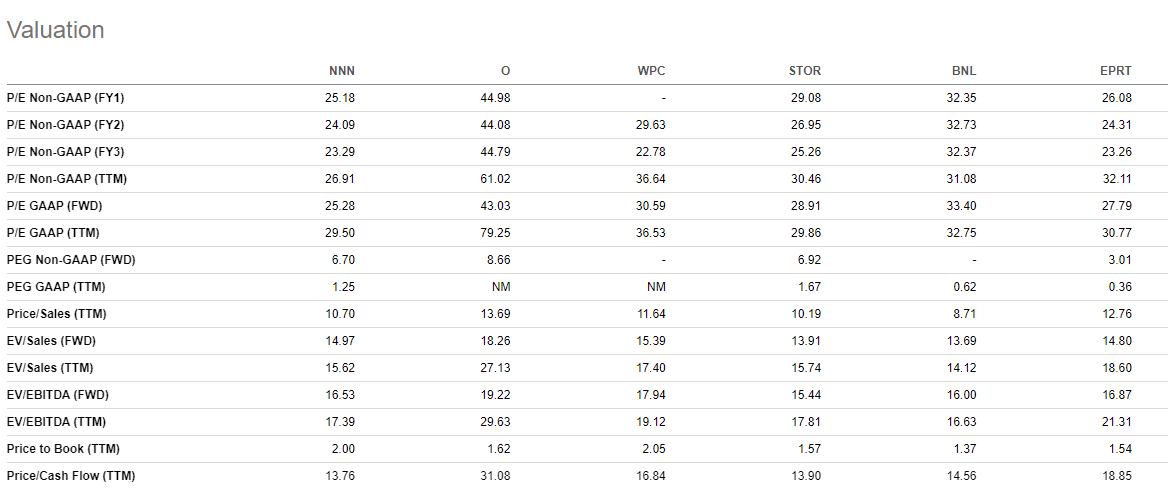
NNN is smaller than some other names, such as Realty Income, and this is a disadvantage to the company. In addition, over the past month, they are underperforming their peers and the broader market in general. This underperformance, however, has presented an opening, as indicated by the relative value reflected in various GAAP-related pricing multiples. An earnings review and further fundamental analysis, however, is needed to provide further confirmation on value prospects.
Earnings and Outlook
In 2021, total revenues and core funds from operations (FFO) were up 10% over 2020. In addition, adjusted funds from operations (AFFO) came in at $3.06 for the year, which was up 22% from the prior year. However, included within AFFO were positive COVID related rent repayments of +$25K. Excluding this one-off, AFFO would have been $2.92, which is still up 16% from 2020.
Portfolio occupancy also remained strong at 99% for the year, with a weighted average remaining lease term of 10.6 years at year-end. In addition, the company’s +$550M acquisition activity during the year consisted of the purchase of 156 properties at an initial cap rate of 6.5% with an average lease duration of over 18 years. Rent collections on existing properties remained strong in the fourth quarter with collections at 99.4%, which is near pre-pandemic levels.
During the year, the dividend was increased to $2.10 per share, which represented the 32nd consecutive year that the dividend was increased. In addition, the company ended the year with +$171M of cash on hand and +$1.1B available on their bank credit facility. Moreover, the weighted average debt maturity on existing debt was approximately 14.7 years, which the company believes is among the longest in the industry.
Looking ahead, NNN expects core FFO in 2022 to be between $2.93 and $3.00 per share and AFFO to be between $3.01 and $3.07 per share. Additionally, the company is expecting G&A expenses of +$42M to +$44M. As a percentage of sales, G&A is expected to be 5.8% of revenues, which would be on the lower end compared to historical averages. The savings should contribute favorably to net operating income for the year. Lastly, net acquisitions are projected to be between +$550M to +$650M with dispositions of up to +$100M.
Balance Sheet
Author’s Assessment of Balance Sheet Strength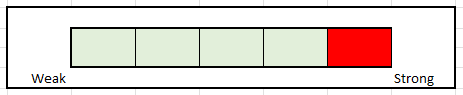
At the end of December 31, 2021, NNN reported total assets of +$7.8B and total liabilities of +$3.9B. Total assets are principally comprised of the company’s +$7.4B real estate portfolio and cash on hand of +$171M, while total liabilities consist almost entirely of long-term notes payable. Of the total, only +$10.7M is secured. Thus, 99.8% of the company’s total assets are unencumbered.
Total Assets and Liabilities – Form 10-K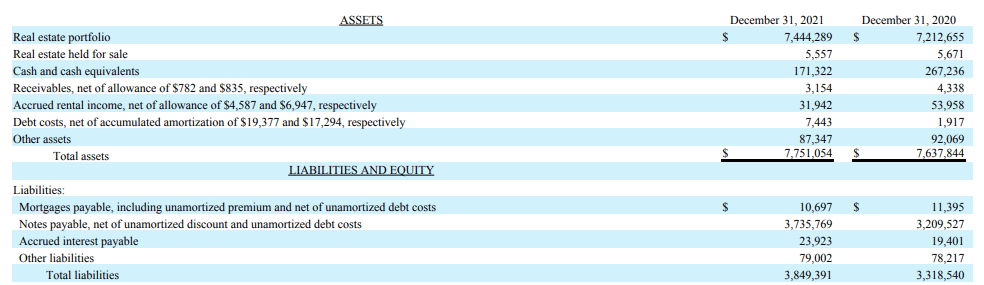
As it is, the company’s total assets are 2x total liabilities. Note, however, that the real estate portfolio is reported at cost, less accumulated depreciation in accordance with GAAP. In actuality, the fair value of the real estate holdings is presumed to be greater than their carrying value. For reporting purposes, companies are required to book impairment charges when the fair value of their assets are lower than their carrying value. As shown below, in 2021, NNN reported +$22M in impairment charges, which was lower than the prior two years and, essentially, immaterial to the overall portfolio balance. The lack of impairments supports the ability of the company’s assets to continue generating consistent revenues in future periods.
Impairment Summary – Form 10-K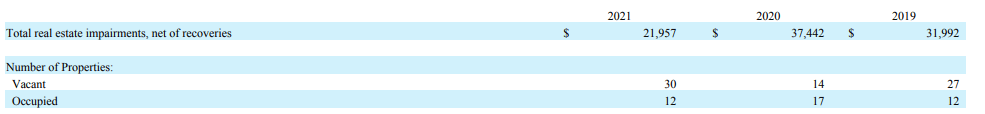
Below are the maturities of the company’s contractual obligations, which have a weighted average debt maturity of 14.7 years. As can be seen, nearly 70% of the total obligations are due after 2026, and the amounts due prior to then appear manageable, given the company’s sizeable cash balance. Therefore, there are no concerns regarding repayment risk.
Contractual Obligations – Form 10-K
The various coverage ratios below provide an indication of NNN’s degree of leverage over the past several years and their ability to cover their interest obligations with earnings. Though there was an increase in net debt in 2021, the interest and fixed charges ratios remained consistent or better than prior years. Additionally, overall debt to assets is below 50%, and there doesn’t appear to be any negative indicators based on current leverage levels.
Leverage Metrics – Investor Presentation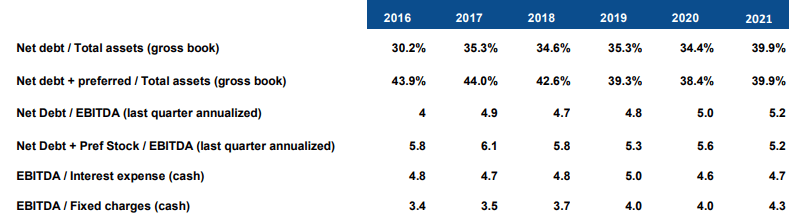
Since nearly 100% of debt is unsecured, compliance with certain debt covenants is critical for the company. At the end of 2021, NNN was compliant with all requirements, and they had ample cushion on all metrics. For example, the minimum fixed charge ratio is 1.51x. NNN’s ratio is 4.48x. Furthermore, total debt is limited at 60%. NNN is only at 40%. Therefore, there are no concerns regarding any violations of existing covenants.
Key Covenants – Investor Presentation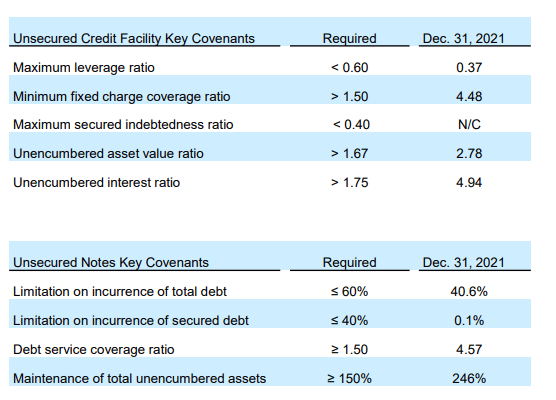
Overall, NNN’s balance sheet is strong. The company has an investment grade debt rating with quality assets that exceed the value of their debt. Since most of the debt is fixed rate with an average maturity in excess of 10 years, the risk of rising interest rates is negligible. Additionally, there are no concerns regarding repayment risk, given the company’s strong earnings potential and ability to remain in compliance with all debt covenants. As such, it is appropriate to apply a strong rating to the balance sheet.
Income Statement
Author’s Assessment of Strength of Income Statement
Aside from 2020, NNN’s revenue and NOI have grown consistently each year at a CAGR of nearly 10%. Growth, however, has slowed since 2017. Though the company reported revenue growth of 9.89% and NOI growth of 10.33% in 2021, it was still lower than the double-digit growth reported prior to 2017. Additionally, rental revenue is not expected to be significantly higher in 2022, either. In their 2022 guidance, management estimated G&A expenses to be about +$42M-+$44M, which they disclosed would be about 5.8% of revenues. If so, that would imply total rental revenues of between +$724M – +$759M. That would indicate flat to mid-single digit revenue growth for the year, a level similar to 2016. Despite the slowing growth, cap rates have remained consistent at about 6.25%, which is an indicator of the quality of the real estate portfolio.
Author’s Summary of Historical Revenues, NOI, and Cap Rate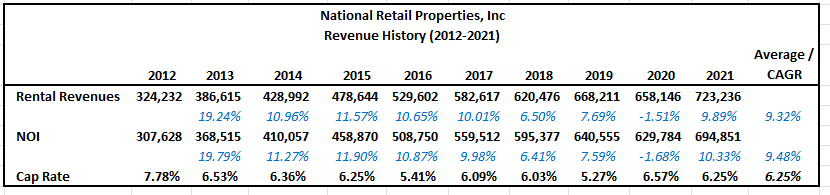
Similar to revenues and NOI, FFO and AFFO also have grown every year except for 2020. The CAGR growth rate is approximately 5% for FFO and 6% for AFFO over the past ten years. Unlike revenues, growth has consistently been in the mid-single digits over the ten-year duration.
2022 guidance is calling for FFO/Share of $2.93 at the low end and AFFO/Share of $3.01 at the low end. At the lower bound, FFO would be up 9% but AFFO would be down. The high-end estimate for AFFO is at $3.07, which is still flat. It is worth noting, however, that AFFO in 2021 included straight-line rent adjustments of +$30K from COVID-19 related net rent repayments. Without the impact of this adjustment AFFO would have been $2.68 for the year. Factoring that into the guidance for 2022 would yield growth of 12% at the low-end and 14.6% at the high-end.
Author’s Summary of Historical FFO/Share and AFFO/Share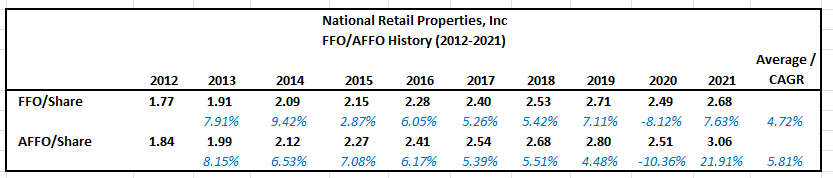
Below are comparisons of the revenue growth rate of NNN compared to their peers in the industry. The mid-single digit growth rate of NNN does appear to lag their competitors both in the near term and over a five-year timespan. Tenant mix is one factor, but size is another. Most of the competitors listed are larger and have greater financial and operational resources. For example, O and WPC each have 369 and 183 employees, respectively, versus 72 for NNN. In this regard, size could certainly be a factor in some respects. BNL and EPRT, however, are both closely similar to NNN in size and each are outperforming.
Seeking Alpha Peer Comparison Tool – Growth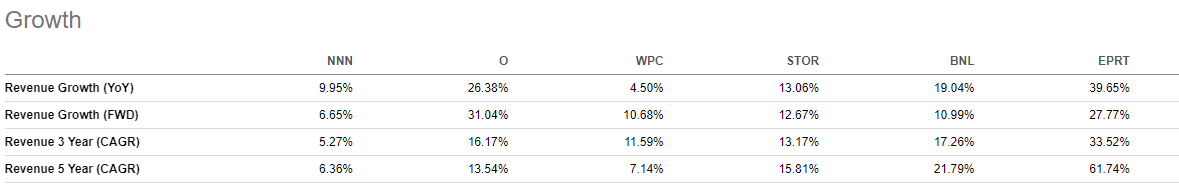
With the exception of 2020, NNN consistently generates stable revenues and earnings from year-to-year. In addition, their cap rate has remained at about 6.25% through the years despite slowing revenue growth. Compared to their competitors, however, much is left to be desired. Though stable, revenues are growing in the mid-single digits versus double digits for most of their peers. At one point, NNN was reporting greater than 10% growth each year, but that has since fallen. A return to previous levels is unlikely as well. For these reasons, it’s best to remain neutral on the strength of the income statement.
Cash Flows and Dividend Safety
Author’s Assessment of Cash Flow Strength and Dividend Safety
In 2021, NNN reported +$568M in cash from operations, which was 26% greater than 2020 and 13% greater than 2019. Net income was lower in 2021 than in 2019, but depreciation was also higher by +$16M, which resulted in a positive adjustment in the current year. Additionally, NNN collected on COVID-related rent deferrals in 2021, which resulted in a net positive adjustment to working capital of +$21M. Other than these adjustments, there weren’t any other stand-out adjustments to net income in deriving cash from operations.
Cash Flow Statement – Form 10-K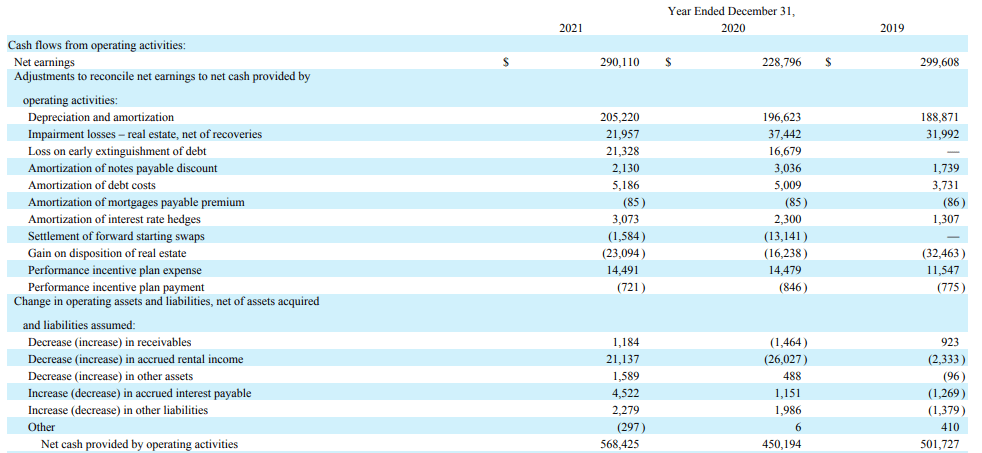
The figures below were derived from the cash flow statement to present changes in cash in a more summarized format. At the end of 2020, NNN had +$267M in cash on hand and ended 2021 with +$171M. As stated earlier, the company generated +$568M in cash from operations. Cash was then spent on investing activities consisting of net real estate acquisitions of +$430M. Free cash flow remaining for the year was thus +$138M. Finally, the company spent +$232M in financing activities, consisting of net debt activity and common dividend payments of +$367M.
For the year, operating cash flow covered the total dividend payments by 1.5x, and that is consistent with prior years. FCF generated during the year, however, was not enough to cover the dividend in its entirety. From a FCF standpoint, coverage was only 40%. The remaining coverage was from existing cash on hand, not debt, so that is a net positive.
Author’s Summary of Cash Flow Statement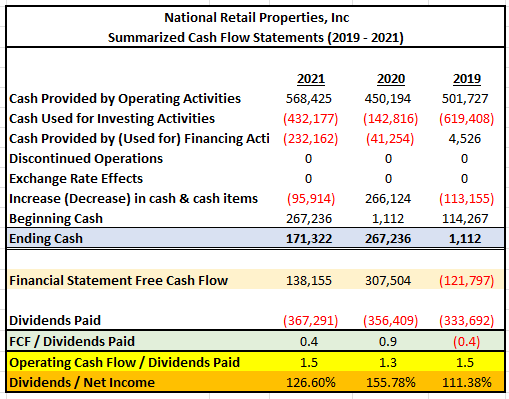
Below are historical dividend coverage levels for the past ten years. The most pertinent ratio is dividends/FFO. Net income and EPS related figures are misleading for REITs because of the significant amount of depreciation expense being recorded by these entities. Since these companies own assets that tend to appreciate, depreciation is not relevant other than for uniform GAAP reporting purposes. AFFO is useful, but the results yield higher figures because of add-backs relating to straight-line rent and other company-specific adjustments. For a more conservative approach, the use of FFO/share is preferable. At any rate, coverage appears strong every year and the results are consistent from year-to-year.
Author’s Dividend Payout Calculations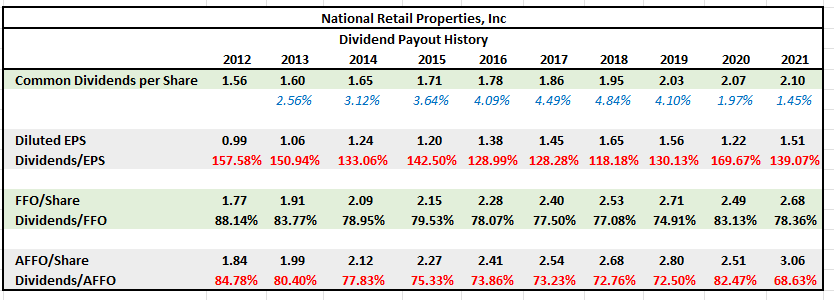
NNN is generating strong cash flows from operations and using the funds for strategic acquisitions and shareholder payouts. The company has ample cash on hand to cover their dividend payouts, and their investment grade credit rating is a benefit when issuing new debt. In addition, the dividend is growing every year and appears well-covered. Therefore, it is safe to apply an above average rating to cash flow and dividend safety.
Target Share Price
The application of an average FFO/AFFO multiple and the use of a dividend discount model yields a target share price of approximately +$52.
The historical data below provides NNN’s closing share price at the end of each year for the last ten years and ending FFO/AFFO per share. On average, the company’s price/FFO multiple is about 18x and the price/AFFO multiple is approximately 17x.
Author’s Calculations of Average FFO/Share and AFFO/Share Multiples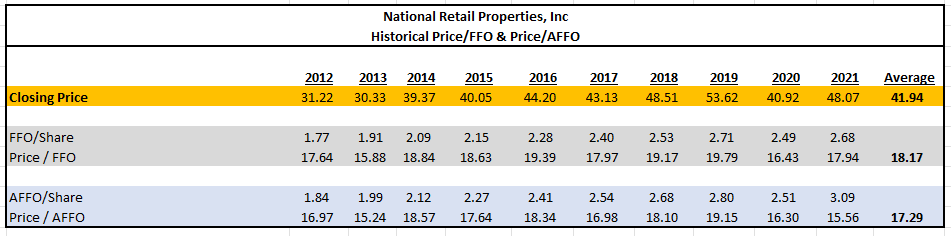
The summary below lists the guidance provided by management for both FFO and AFFO. The current multiple was calculated for each point using the current share of $45. At present, the multiple is about 15x. Historical averages, however, would indicate a share price between $50-$55, as shown below.
Author’s Summary of Valuation Methods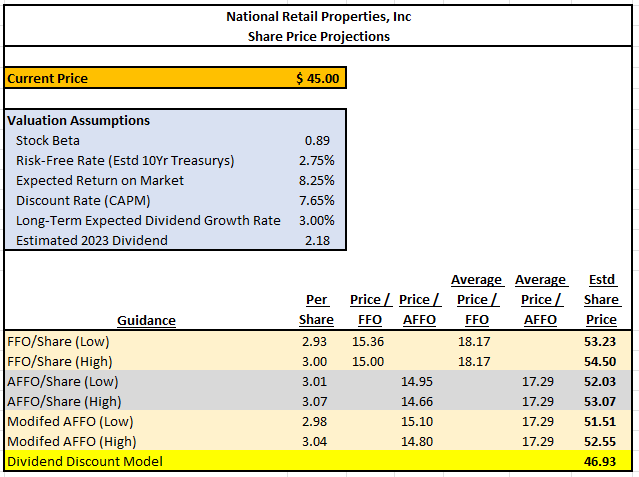
The use of a dividend discount model (DDM) yields a share price of $46.93, as explained below.
The first step in the model was to obtain the expected future dividend payment. For this, the expected 2023 dividend was used. According to consensus estimates, the 2023 dividend is expected to be $2.18.
The next step was to calculate the cost of equity capital. To derive this rate, use of the CAPM formula was preferable. The key inputs into this model are the RF rate, which is typically the yield on 10-YR U.S. Treasurys, the stock beta, and a risk premium. The current yield on 10-YR Treasurys is 2.4%, as reported in The Wall Street Journal. However, 2.75% was used in anticipation of higher rates in 2022. The beta of NNN is 0.89, as reported in Morningstar. Finally, the historical risk premium is 5.5%. Thus, the expected return on the market is 8.25%. Upon inputting these variables into the CAPM formula, a discount rate of 7.65% was obtained.
The final input into the DDM was the expected long-term dividend growth rate. For this, 3% was used because that is historically the rate of dividend increases per year.
Results of DDM Calculation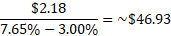
Upon inputting all variables into the DDM, a result of $46.93 was obtained, as shown above. Taken together with the multiples approach, an average price target of $52 is appropriate.
Primary Risks
NNN’s success as a business is highly dependent on the economic health of their tenants. As mentioned earlier, the top five tenants of NNN accounted for approximately 20% of total base rent. An inability of these tenants to continue paying rent or a substantial deterioration in the health of any one of these tenants would adversely affect the results of operations of the company.
Additionally, vacant properties could adversely affect NNN’s business or financial condition. As of December 31, 2021, NNN owned 32 vacant, un-leased properties, which accounted for approximately one percent of the company’s total portfolio. NNN is actively marketing these properties for sale or lease but may not be able to sell or lease these properties on favorable terms or at all.
As of December 31, 2021, NNN had outstanding debt of +$3.9B and no outstanding balance on the credit facility. At present, there are no issues or concerns regarding repayment risk. If NNN incurs additional debt, however, debt service requirements would increase and could adversely affect NNN’s financial condition and results of operations, as well as NNN’s ability to pay principal and interest on the outstanding debt or cash dividends to its stockholders. Operating on a high degree of leverage may force NNN to dedicate a substantial portion of its cash flow from operations to payments on its debt, thereby reducing funds available for operations, real estate investments, and other business opportunities that may arise in the future. Additionally, NNN is obligated to comply with financial and other covenants in its debt instruments that could restrict its operating activities, and the failure to comply with such covenants could result in defaults that accelerate the payment of existing debt.
Conclusion
NNN has a simple strategy of operating as long-term investors of single tenant, freestanding properties with no exposure to malls or strip centers. In addition, the net lease model generates reliable income with low volatility and relieves the company of the burden of tax, maintenance, and insurance expenses. Furthermore, at year-end, nearly 100% of the real estate portfolio was occupied and nearly all rent due has been collected. The long-term nature of the leases adds further stability and predictability to the company’s results of operations.
NNN is currently underperforming against related peers and the broader market in general. Their fundamentals, however, are strong and there are no indications of impairment in the business model. At present, the company’s FFO/AFFO multiples are at a discount to historical averages, and, all considered, new and existing shareholders of the stock will benefit from the 4.6% yielding dividend that has been growing for 32 consecutive years and the upside potential of approximately 15%.
Be the first to comment