

ktsimage
Investment Thesis
The biotech sector is often considered to be one of the riskiest sectors of all, which is why many investors consistently avoid this sector. Indeed, single investments especially in the small/micro-cap sector are often highly speculative, but the opportunities of the sector should not be underestimated. As technology advances, the methods of disease are also becoming better and more effective.
The iShares Nasdaq Biotechnology ETF (NASDAQ:IBB) offers an excellent opportunity to participate in the chances of the sector even as a more conservative investor through broad diversification. The correction of recent months has not left this sector unscathed, although most companies have hardly been affected by the crises. This industry has a historically low valuation and, also given some technical indicators, offers an attractive entry point at the current level.
Sector Overview
When it comes to future topics of the next couple of years and decades, the term biotechnology usually comes up quite quickly. Companies like BioNTech (BNTX) and Moderna (MRNA) have recently shown what is possible in this field with vaccines based on mRNA technology developed in record time. Yet this trend is still in its infancy. However, not only mRNA technology still holds enormous potential, but also several other innovations such as gene editing, gene sequencing, biomanufacturing or bio-printing.
The problem is that the development and application of these methods are extremely costly and successes are therefore very difficult to estimate in terms of time. After the preclinical stage, new active substances must go through three phases before they can be submitted for approval. This process alone takes many years and at no time is there a guarantee of success.
If a product fails in the late phases 2/3, millions or even billions have already been spent on research & development, which often causes massive financial difficulties for smaller companies in particular. The risks in this sector should not be underestimated, but on the other hand, it also offers high return opportunities.
For many investors, however, the risk/return profile is not so attractive, which is why a broadly diversified ETF is a good choice. Here, diversification ensures that the risk of individual companies with research failures is minimized and that investors benefit from the long-term growth of the sector.
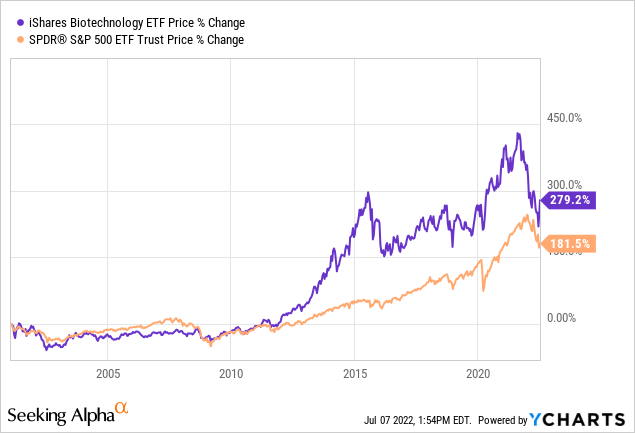
Over 20 years, the ETF has significantly outperformed the S&P 500 (SPY) by almost 100 percentage points. In the meantime, the outperformance was significantly higher when, for example, there was a real hype on biotech stocks in the period of 2010-2015 which led to a bubble-like development in the middle of 2015.
This is the reason the index ran volatile sideways until 2020. This movement was followed by a breakout attempt, which abruptly stopped by a general pullback from growth and risk stocks in the last couple of months.
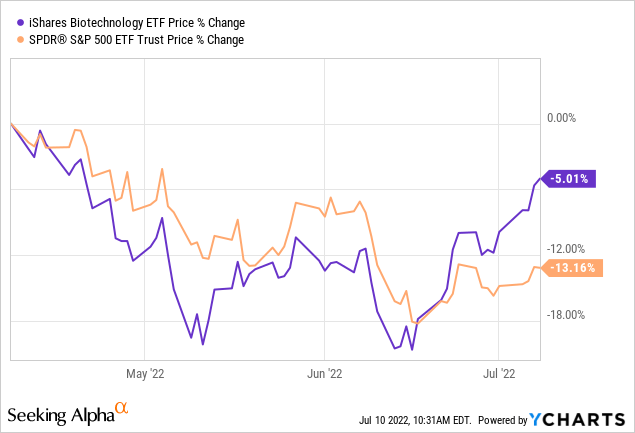
In recent weeks, however, Nasdaq Biotechnology ETF has been able to rebuild relative strength against the S&P 500 and rally much stronger. The question, of course, is whether this relative strength will continue going forward, which of course cannot be said with certainty. However, there is some data to suggest that Nasdaq Biotechnology ETF is not a poor choice as an investment.
Cheap Valuation
The healthcare sector is traditionally considered to be more defensive, but with somewhat weaker growth than the S&P 500. For this reason, the industry is typically valued the same or slightly lower than the benchmark index.
Biotechnology as part of the healthcare sector has higher risk discounts, but also higher growth, which made this industry traded for many years even above the sector valuation and the overall market. This can be well observed in the historical development of the expected P/E ratios.
Yardeni Research, Illustration by author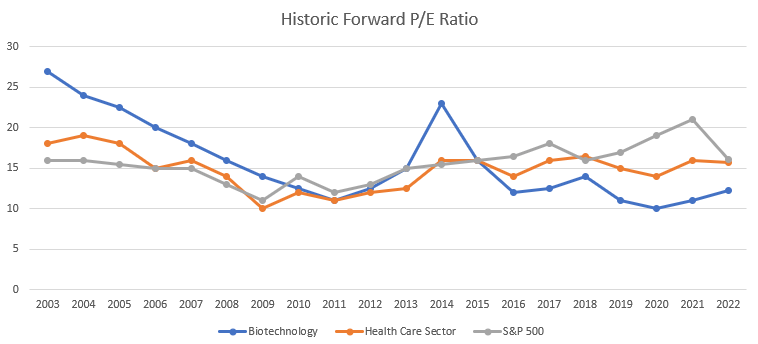
Since the peak in 2014, the P/E ratio has been well below the benchmarks. In 2020, the expected P/E ratio fell below 10 for the first time, which was lower than the low point of the financial crisis.
Since then, there has been a slight recovery, but the sector continues to trade well below its historical average of 16.5 with a P/E ratio of 12. However, that alone is only part of the valuation.
For a better overview, I look at the metrics of the ETF’s largest ten holdings, which together account for 50% of the total portfolio:
| Ticker | Weight | |
| Vertex | (VRTX) | 7,24% |
| Gilead | (GILD) | 7,13% |
| Amgen | (AMGN) | 7,13% |
| Regeneron | (REGN) | 6,32% |
| Moderna | (MRNA) | 5,85% |
| IQVIA | (IQV) | 3,75% |
| BioNTech | (BNTX) | 3,17% |
| Seagen* | (SGEN) | 3,12% |
| Biogen | (BIIB) | 3,09% |
| Illumina | (ILMN) | 2,98% |
| Mettler-Toledo | (MTD) | 2,64% |
*Seagen price action is strongly affected by rumours of a potential takeover from Merck (MRK) which is why it is not considered in the following.
Source: iShares.com
| Valuation | Market cap. | EV/S TTM | EV/S FWD | P/E TTM | P/E FWD | PEG FWD | P/FCF FWD |
| Vertex | 75.27 | 8.54 | 7.91 | 21.7 | 20.7 | 0.61 | 17.95 |
| Gilead | 78.82 | 2.87 | 3.21 | 8.57 | 9.55 | neg. | 8.06 |
| Amgen | 132.74 | 6.2 | 6.22 | 14.07 | 14.23 | 2.31 | 13.37 |
| Regeneron | 66.97 | 3.99 | 4.72 | 8.14 | 14.41 | neg. | 9.38 |
| Moderna | 70.1 | 2.29 | 2.34 | 5.18 | 6.35 | neg. | 8.84 |
| IQVIA | 41.52 | 3.78 | 3.62 | 23.53 | 21.62 | 1.39 | 15.39 |
| BioNTech | 41.34 | 1.34 | 2.04 | 3.06 | 4.66 | neg. | 2.43 |
| Biogen | 32.04 | 3.22 | 3.55 | 12.53 | 14.17 | neg. | 11.39 |
| Illumina | 30.95 | 6.91 | 6.18 | 38.33 | 47.61 | 6.74 | 30.27 |
| Mettler-Toledo | 27.70 | 7.73 | 7.48 | 34.68 | 31.7 | 1.68 | 30.08 |
| Average | 59.74 | 4.68 | 4.73 | 16.9 | 18.5 | – | 14.72 |
Source: Seeking Alpha, Author’s calculations
With an average market capitalization of just under $60 billion, large caps are dominating, which provides a certain safety buffer. Also, all companies are profitable without exception, which means that various products have already been approved and the future of the companies is not directly dependent on future research results.
However, one major problem stands out: P/E ratios are declining while PEGs are mostly negative. The earnings development of the large biotech giants does not seem to be in such good shape at the moment, which means that a certain degree of caution is warranted. This also explains the other rather low ratios.
I consider an average price/free cash flow ratio to be a fair number, as well as a P/E ratio of 17. Amgen, Gilead and Biogen in particular are in a kind of transition phase, where expiring blockbuster products have to be compensated for by new active ingredients. Of course, this does not always succeed seamlessly, due to research setbacks, postponements or simply a weak pipeline.
As a result, operational development sometimes comes to a standstill, which leads to great uncertainty among investors. These companies can be expected to recover thanks to their pipelines and continue to grow. In case of doubt, the large corporations will make use of acquisitions of small promising companies to strengthen their pipelines and gain access to novel treatments.
These takeover waves are often viewed with scepticism by investors due to high premiums, but they usually lead to substantial increases in value in the medium term. Examples include AbbVie (ABBV) and Bristol Myers Squibb (BMY). Recently, rumours also intensified that Merck would be interested in Seagen.
Such developments should make the operating situation of the large companies look better again in the medium term. But there is one category where the companies can still shine, despite stagnating profits: profitability.
| Profitability | Gross Margin TTM | EBIT-Margin TTM | FCF Margin TTM | ROCE |
| Vertex | 88% | 37% | 24% | 25% |
| Gilead | 80% | 41% | 32% | 23% |
| Amgen | 75% | 37% | 28% | 112% |
| Regeneron | 66% | 55% | 35% | 50% |
| Moderna | 75% | 72% | 38% | 140% |
| IQVIA | 34% | 11% | 12% | 18% |
| BioNTech | 83% | 76% | 13% | 140% |
| Biogen | 78% | 29% | 19% | 13% |
| Illumina | 71% | 14% | 28% | 9% |
| Mettler-Toledo | 58% | 27% | 16% | 552% |
| Average | 69% | 40% | 25% | 108% |
Source: Seeking Alpha, Author’s calculations
With an average gross margin of 70%, an EBIT margin of 40% and a free cash flow margin of 25%, the top 10 companies have an unusually high level of profitability that is hard to find in any other industry. In addition, the profits generated are extremely crisis-resistant and independent of the economic cycle.
Especially because a coming recession is not unlikely, companies with stable profits are in great demand. This does not mean that companies cannot also drop along with the market, but there is a certain safety factor involved.
Regarding rising interest rates, attention must also be paid to corporate debt, as the burden of interest costs in such times should not be underestimated. Especially since there are many takeovers in the sector.
| Financials | Total Cash | Net Debt | Gearing | Net Debt/EBITDA | Debt /Free CF | Interest Expense | % Of EBIT |
| Vertex | 8.24 | -7.37 | -0.67 | -2.4 | 1.78 | 55 | 1.87% |
| Gilead | 6.02 | 18.76 | 0,94 | 1.42 | 4.96 | 982 | 8.8% |
| Amgen | 6.54 | 30.31 | 33.74 | 2.35 | 7.83 | 1207 | 12.5% |
| Regeneron | 7.05 | -11.43 | -0,57 | -1,21 | 1.11 | 56.3 | 0.6% |
| Moderna | 10.12 | -18.34 | -1.07 | -1.11 | 1.23 | 8 | 0% |
| IQVIA | 1.49 | 11.46 | 1.94 | 4.42 | 11.18 | 362 | 23% |
| BioNTech | 6.82 | -6.61 | -0.29 | -0.34 | 1.5 | 9.7 | 0% |
| Biogen | 3.75 | 2.83 | 0.12 | 0.78 | 5.93 | 255 | 0.82% |
| Illumina | 1.42 | 1.2 | 0.11 | 1.28 | 3.39 | 49 | 7.6% |
| Mettler-Toledo | 0.12 | 1.87 | 0.56 | 1.71 | 5.32 | 45 | 4.4% |
Source: Seeking Alpha, Author’s calculations
Overall, the financial stability of these companies is extremely solid. Four companies even have negative net debt, i.e. more cash than interest-bearing liabilities. There are only some warning signs at Amgen and IQVIA, where the interest costs are already quite noticeable in the operating activities. Here, further, development should be scrutinized a bit more strictly.
Price Action
Last but not least, I take a look at the chart of the ETF. Technical analysis is only a tiny tool for me to look for an attractive entry point. Since the September high, a clean five-wave impulse down can be counted ready. At the July low, there was a bullish divergence in the RSI next to the long-term uptrend line.
Since then, the ETF has been able to rise impulsively and overcome the downtrend. Most recently, this trend was tested once again in an exemplary manner before it was able to turn upwards again on Friday. I like the current technical price action very much and estimate the current level as a compelling entry point.
TradingView, Chart created by Author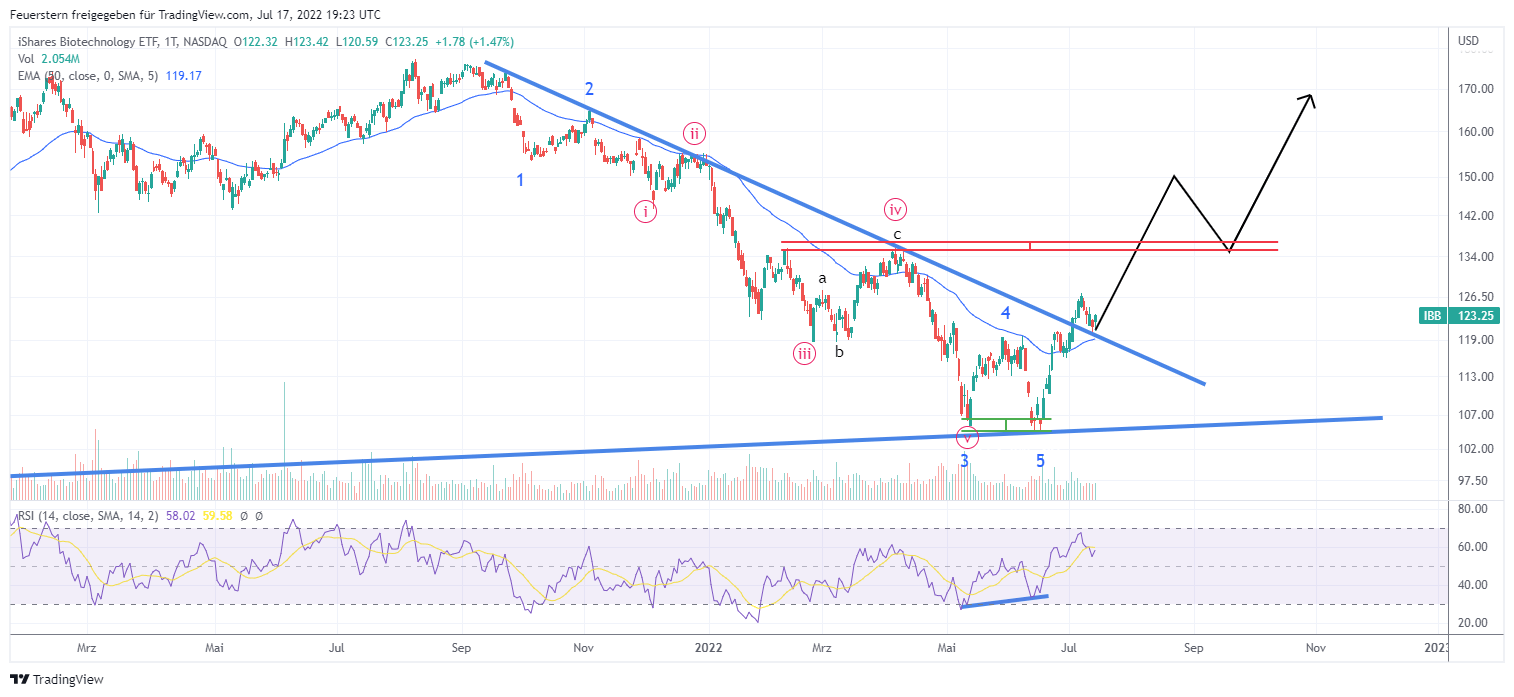
Summary
The Nasdaq Biotechnology ETF is one of the best ways to profit from the numerous opportunities in the biotech sector without accepting the most crucial risks. This does not mean that there are no risks, but in my eyes, the risk-reward ratio is very attractive at the moment.
The sector has come back strongly in recent months, although it has hardly been affected by global problems. This results in a historically low valuation with very appealing profitability. The portfolio is also very compelling as well as promising. Along with a strong chart picture, the Nasdaq Biotechnology ETF is currently a look for me.
Be the first to comment