

US STOCKS OUTLOOK:
- Nasdaq 100 soars and reclaims its 200-day simple moving average
- The Russell 2000 surges and breaks above key technical resistance, confirming a bullish double bottom pattern
- News that Russia has decided to scale back some military operations in Ukraine appears to be one of the main bullish catalysts for price action
Most read:Gold Price Forecast – Fresh March Lows Arrive, Double Top Forms. Now What?
U.S. stocks pushed higher on Tuesday on broad-based positive sentiment after Russia announced it will substantially scale back military operations in two cities in Ukraine (Kiev and Chernigiv) to increase trust and give ongoing peace talks a chance of success.
At the market close, the S&P 500 jumped 1.23% to 4,631, rising for the fourth consecutive session and reaching its best level in eight weeks. The Dow Jones, for its part, climbed 0.97% to 35,294, lifted by strong gains in Boeing and Visa share prices. Meanwhile, the Nasdaq 100 soared 1.68% to 15,239, a rally that allowed the tech index to recapture its 200-day simple moving average. Last but not least, the Russell 2000 surged 2.65% to 2,120, breaking above a key resistance area and validating a double bottom pattern.
Reports that Russia has decided to reduce some combat operations are certainly encouraging, but the news must be taken with a grain of salt and skepticism. At this point, it is impossible to say with certainty whether Moscow is truly interested in reaching a ceasefire or whether it is using the negotiations as a smokescreen to replenish exhausted forces ahead of the next offensive maneuvers.
There will be more information in the coming days and weeks, but traders should be prepared for all scenarios, including one in which the geopolitical landscape deteriorates further and certain commodities resume their ascent. Needless to say, any escalatory action will act as a negative catalyst, dampening risk appetite and quenching bullish momentum on Wall Street.
On a different front, the U.S. economic calendar is packed this week with high-impact events, but the main focus will be on the March employment report and wage data to be released on Friday.
Strong labor market results will bolster the case for aggressive central bank tightening and front-loading rate increases to restore price stability and ensure inflation expectations do not become unanchored. Hawkish repricing of Fed monetary policy outlook may push short-term yields higher than they are, paving the way for further compression of credit spreads, an ominous sign for economic growth. In this regard, if the 2s10s curve inverts, recession talk is likely to increase and become a favorite topic of discussion in the financial media, a situation that can fuel volatility and impede sustained gains in the equity space.
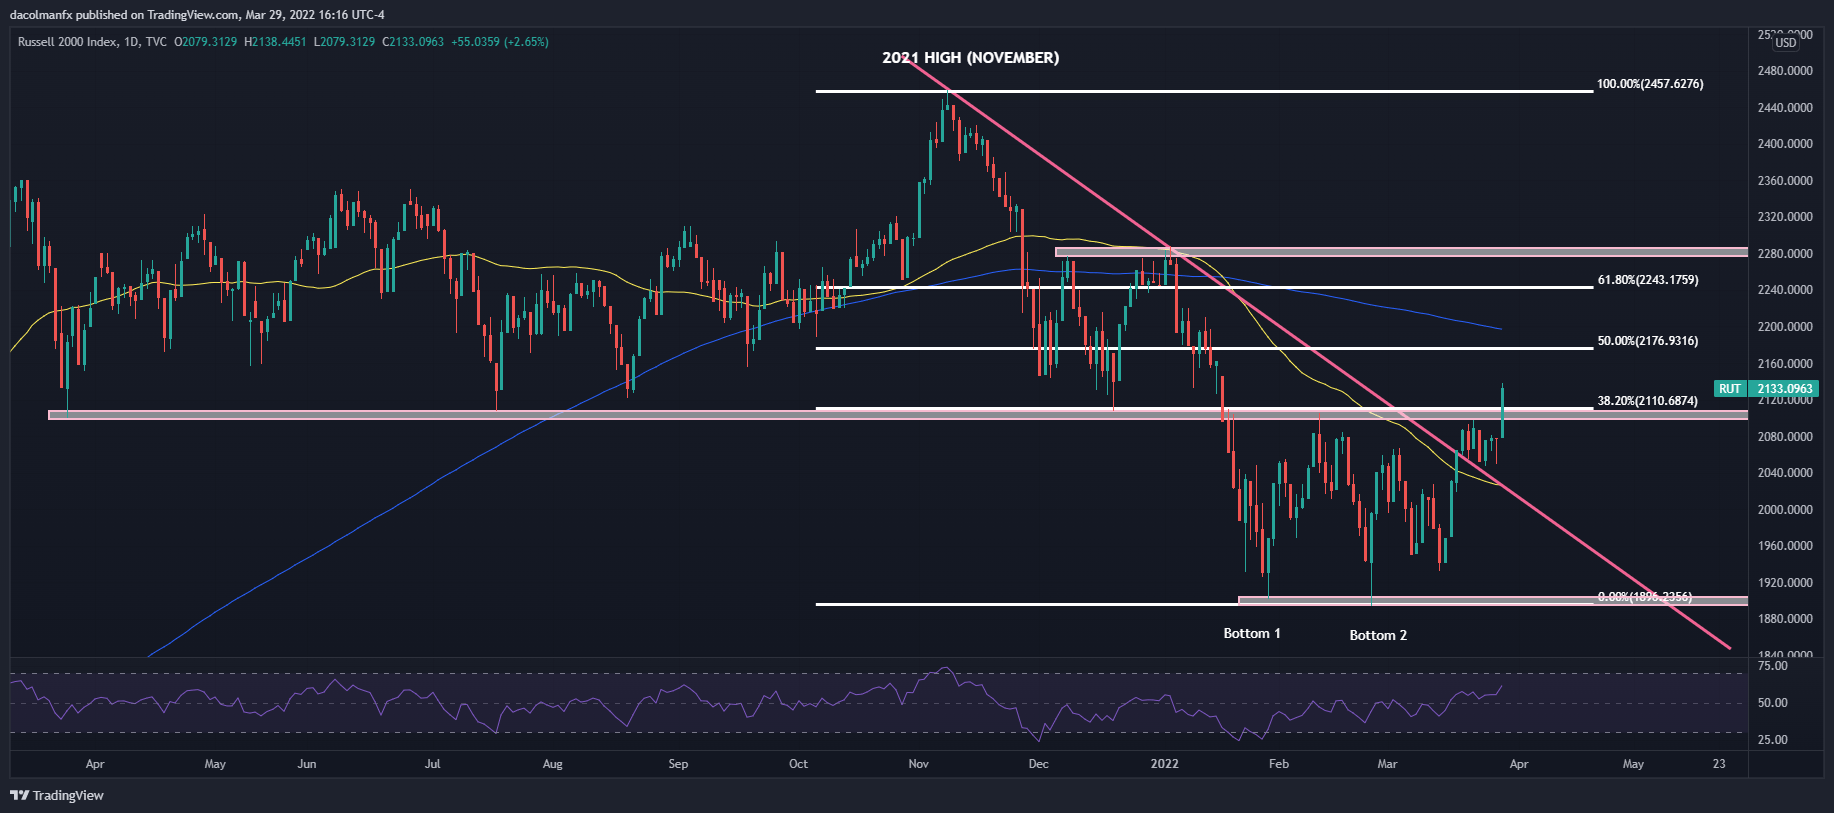
RUSSELL 2000 TECHNICAL ANALYSIS
The Russell 2000 soared and broke above a key resistance in the 2,110 area on Tuesday, confirming a bullish double bottom pattern in gestation since January. If there’s follow-through on the topside in the coming days, the small cap index may set out to challenge the 50% Fibonacci retracement of the November 2021/March 2022 selloff near 2,175. On further strength, the focus shifts up to the 200-day simple moving average, followed by the 61.8% Fib level. In the event of a bearish reversal, support rests at 2,110 and 2,025 thereafter.
Russell 2000 Chart prepared using TradingView
NASDAQ 100 TECHNICAL ANALYSIS
The Nasdaq 100 has performed remarkably over the past two weeks, rallying roughly 17% from the March low. With recent gains, the tech index has reclaimed its 200-day simple moving average and could now challenge the 15,345 area, a technical resistance created by the 61.8% Fibonacci retracement of the November 2021/March 2022 decline. If the bulls manage to push the price above this barrier, the next upside target lies at 15,530, followed by 15,720 (September 2021 high). On the other hand, if bears re-emerge and regain decisive control of the market, support lies at 15,130 (200-day SMA), while on further weakness, 14,900 would become the next floor.
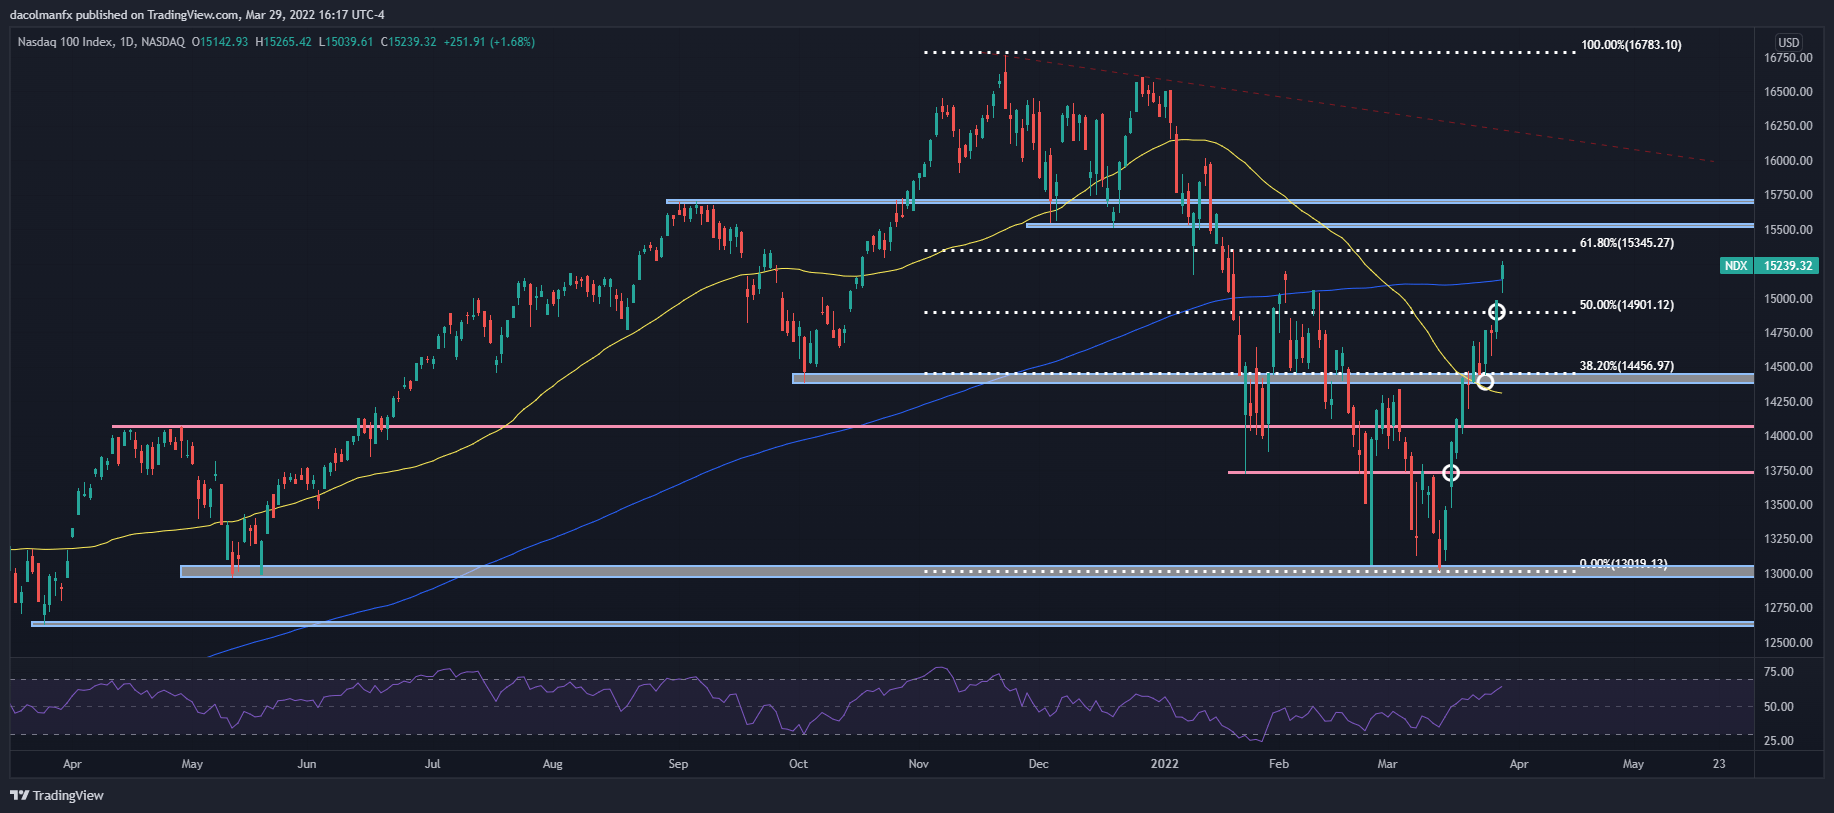
Nasdaq 100 (NDX) chart prepared in TradingView
EDUCATION TOOLS FOR TRADERS
- Are you just getting started? Download the beginners’ guide for FX traders
- Would you like to know more about your trading personality? Take the DailyFX quiz and find out
- IG’s client positioning data provides valuable information on market sentiment. Get your free guide on how to use this powerful trading indicator here.
—Written by Diego Colman, Contributor
Be the first to comment