

NASDAQ 100, HANG SENG, ASX 200, ASIA-PACIFIC MARKET OUTLOOK:
- US equity indexes had a whipsaw session and closed marginally higher; small-tech outperformed
- Hang Seng Index surged to a 12-month high with financial and telco giants leading the gains
- Falling USD and yields underpinned commodity prices, WTI crude oil hit US$ 53.3

Recommended by Margaret Yang, CFA
Get Your Free Equities Forecast
USD, Hang Seng, Nasdaq 100, ASX 200, Asia-Pacific Stocks at Open:
The US Dollar retreated from a two-week high and the Treasury yieldcurve flattened slightly overnight, offering a relief rebound to stock markets. All three major US indices ended slightly higher after a choppy session, and small-cap tech stocks enjoyed a decent rally. The Russell 2000 index jumped 1.77% to a fresh record high.
A weakening USD underpinned commodity prices, sending WTI crude oil prices to 11-month highs. Gold and silver prices also rebounded alongside base metals such as iron ore, copper and nickel. Asia-Pacific stocks look set to open mixed, with energy, mining and material sectors outperforming.
South Korea’s Kospi index may face headwind from the latest unemployment rate print, which came in at a 10-year high of 4.6% in the wake of coronavirus outbreak. The reading is far above economists’ forecast of 4.1%, reflecting that the labor market is deteriorating at a faster-than-expected pace. Malaysia has declared a state of emergency on Tuesday after imposing a 14-day lockdown on its capital city and several states. This may undermine the performance of aviation, tourism, travel, F&Band consumer discretionary sectors as they are most vulnerable to lockdowns and the pandemic’s impact.
Australia’s ASX 200 index opened mildly lower and may trade in a tight range-bound condition today. Material and energy stocks were higher, while technology and bank shares were lagging. The Australian Dollar rebounded to 0.7778 against the Greenback, looking set to resume its upward trajectory after a brief pullback.
Hong Kong’s Hang Seng Index jumped 1.35% and closed at 28,276 points on Tuesday, breaking above a key chart resistance and may have opened the door for further upside potential. The index has reached its highest level seen since January 2020, propelled by a rally in financial and telco stocks (chart below).
Hang Seng Top 10 Stock Performance 12-01-2021
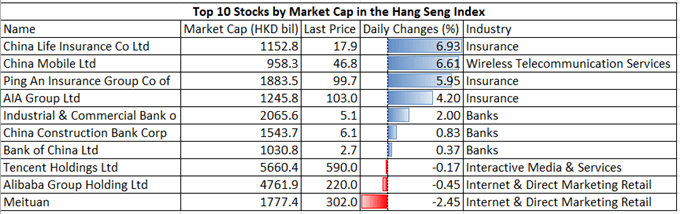
Source: Bloomberg, DailyFX
On the macro front, a speech from ECB President Christine Lagarde will be closely watched by currency traders later today. US core inflation and EIA crude oil inventory data are among the top events too. Find out more from DailyFX calendar.

Recommended by Margaret Yang, CFA
Improve your trading with IG Client Sentiment Data
Sectoralpatterns were pretty mixed overnight: 6 out of 11 S&P 500 sectors ended higher, with 62.4% of the index’s constituents closing in the green. Energy (+3.50%), materials (+1.34%) and consumer discretionary (+1.31%) were among the best performers, whereas communication services (-1.50%) and healthcare (-1.07%) were lagging.
S&P 500 Sector Performance 13-01-2021
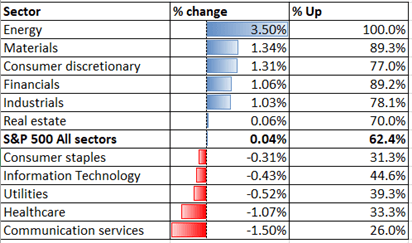
Source: Bloomberg, DailyFX
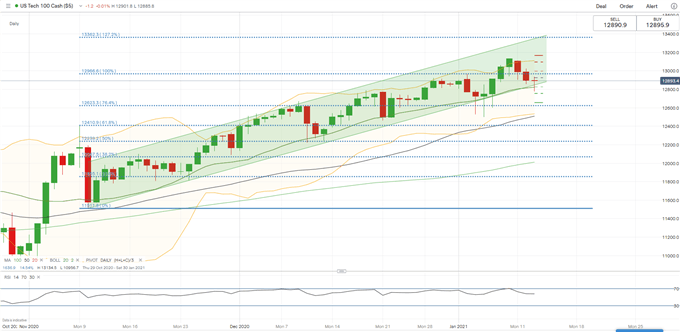
Nasdaq 100 Index Technical Analysis:
Technically, the Nasdaq 100 index is edging higher within an “Ascending Channel” as highlighted in the chart below. The index reached the lower bound of the channel and has since rebounded. The uptrend is also well-supported by its 20-Day Simple Moving Average (SMA) line, which is at 12,830 now. Immediate support and resistance levels can be found at 12,623 (76.4% Fibonacci extension) and 13,360 (127.2% Fibonacci extension) respectively.
Nasdaq 100 Index – Daily Chart
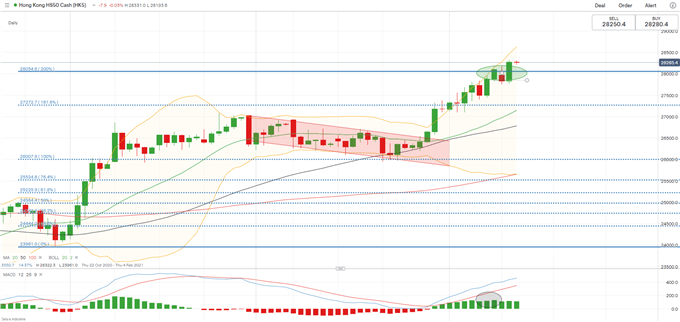
Hang Seng Index Technical Analysis:
The Hang Seng Index (HSI) has likely breached the 200% Fibonacci extension level of 28,050 and may have opened the door for further upside potential. The price has reached its highest level since January 2020. Overall momentum remains bullish biased, as suggested by the MACD indicator and widening Bollinger Band width. 28,050 has now become an immediate support should there be a technical pullback.
Hang Seng Index – Daily Chart
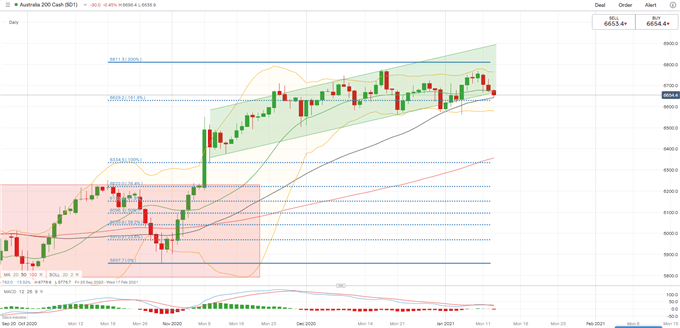
ASX 200 Index Technical Analysis:
The ASX 200 index retraced to the lower bound of the “Ascending Channel” looking for support. Immediate support and resistance levels can be found at 6,630 (the 161.8% Fibonacci extension) and 6,810 (the 100% Fibonacci extension) respectively. Overall momentum tilts slightly towards the downside as suggested by a bearish MACD indicator. A range-bound condition is likely to dominate trading in the days to come.
ASX 200 Index – Daily Chart

Recommended by Margaret Yang, CFA
Building Confidence in Trading
— Written by Margaret Yang, Strategist for DailyFX.com
To contact Margaret, use the Comments section below or @margaretyjy on Twitter
Be the first to comment