

Funtay
Introduction
Nabors Industries (NYSE:NBR) released its third quarter of 2022 results on October 25, 2022, and Helmerich & Payne (HP) released its third quarter results (fiscal fourth quarter) on November 6, 2022. I recommend reading my article on HP by clicking here.
This article looks at the company’s recent fundamental history, including the third quarter earnings. It also compares NBR with HP fundamentals to draw credible conclusions about what to expect in 2023 and how to navigate the industry successfully.
Undoubtedly, 2022 was an exceptional year for onshore drilling. Still, this remarkable accomplishment may have ended, and the drilling business may face strong headwinds in 2023 with a possible painful recession and subsequent diminishing demand.
1 – NBR’s 3Q22 results snapshot
Revenues were $698.95 million in the third quarter of 2022, up from $524.37 million a year ago.
NBR reported a third quarter 2022 loss of $13.78 million, or $1.80 per share. The figures beat analysts’ expectations.
Nabors’ adjusted EBITDA increased from $125.2 million to $190.8 million year over year.
Nabors Industries exited 3Q22 with 94 rigs running in the US. The daily margin increased to $13,232 per day, up slightly year over year in the third quarter. For the International segment, NBR exited 3Q22 with 75 rigs with a daily margin stable at $14,589 per day.
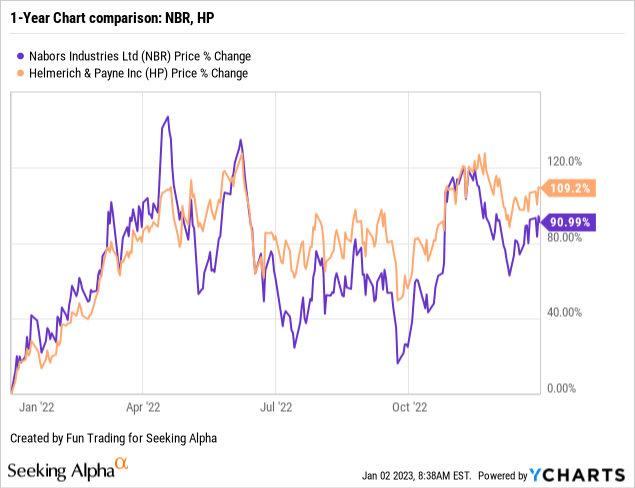
2 – Stock performance
Nabors Industries has done very well on a one-year basis and is up 91%. However, HP is outperforming NBR and is up 109%. Both companies did very well in 2022, despite some steep retracement in July and October. I am expecting the same volatility in 2023.
3 – Investment thesis
As we enter 2023, the investment thesis is a challenging exercise for these onshore drilling companies. On the one hand, the situation has improved significantly in the past two quarters. On the other side, we may have reached a plateau, and 2023 may turn bearish if the global economy enters a painful recession.
As I said in my preceding article, because those companies are highly associated with oil prices, I suggest trading LIFO about 50%-60% (even more for NBR) of your long-term position to compensate for the adverse effects of any fluctuations and reduce the overall risk attached to this volatile sector.
This dual strategy is what I am suggesting in my marketplace and forms the backbone of my Gold and Oil marketplace.
I believe NBR is less attractive than HP because of its more robust US revenue segment and dividend policy. However, NBR looks potentially more attractive for full-time traders due to expected higher volatility.
3.1 Nabors and H&P Fleet Status Snapshot 3Q22
3.1.1 – Nabors Industries
The total working rigs increased to 177 rigs from 173 in 2Q22. Nabors’ average Lower 48 working rig count was 94 in 3Q22. For the International segment, it was 75. The utilization average is 54%, up from 52% the preceding quarter.
NBR Fleet Status 9/30/22 (NBR Presentation)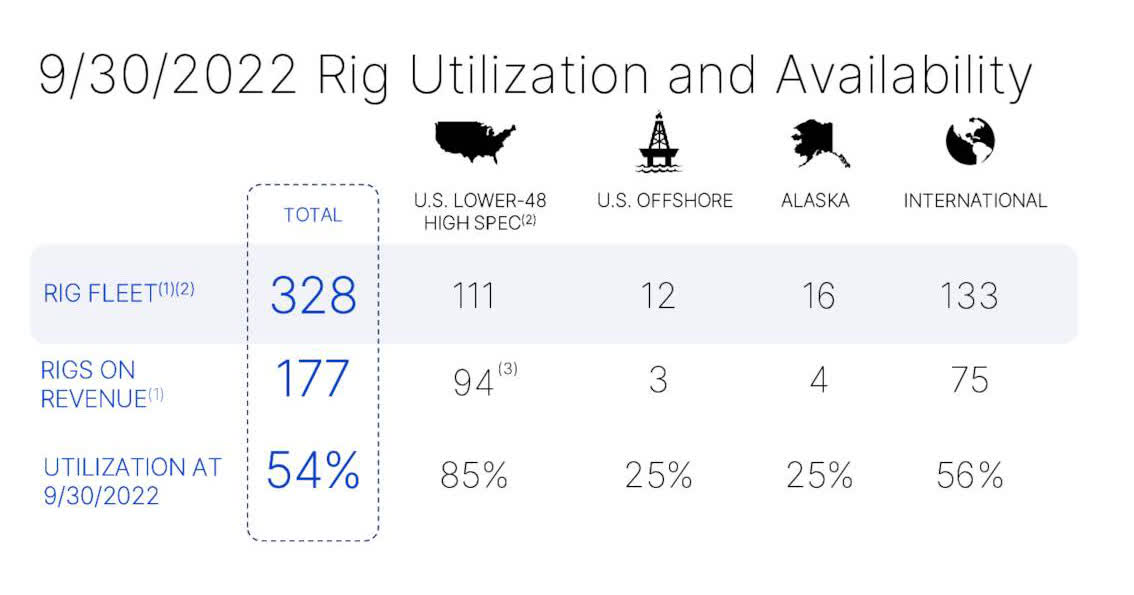
3.1.2 – Helmerich & Payne
NBR H&P Fleet status (H&P Presentation)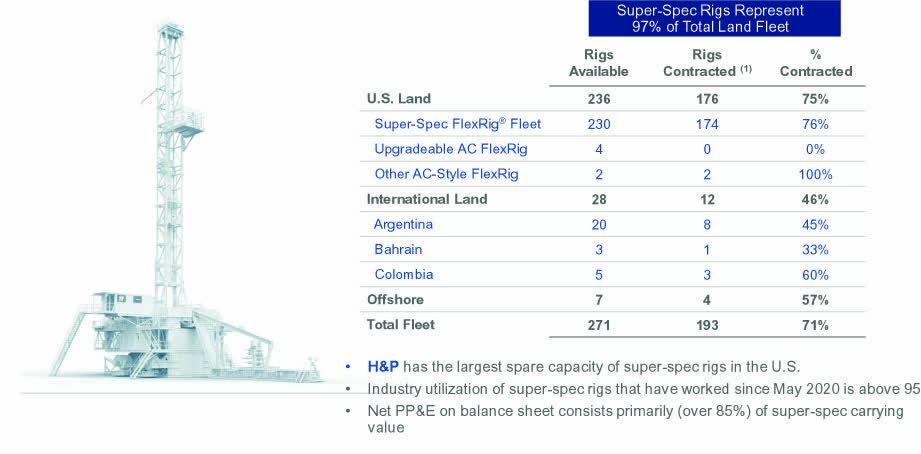
H&P had basically the same number of rigs contracted as NBR in the US but had much fewer rigs contracted in its International segment, making H&P more oriented and sensitive to the US market.
Nabors Industries – Balance Sheet In 3Q22: The Raw Numbers
| Nabors Industries | 3Q21 | 4Q21 | 1Q22 | 2Q22 | 3Q22 |
| Total Revenues and other income in $ Million | 524.17 | 543.54 | 568.64 | 630.94 | 694.14 |
| Net income in $ Million | -122.50 | -113.68 | -184.50 | -82.92 | -13.78 |
| EBITDA $ Million | 102.57 | 121.64 | 50.27 | 144.33 | 221.59 |
| EPS diluted in $/share | -15.79 | -14.60 | -22.51 | -9.41 | -1.80 |
| Operating cash flow in $ Million | 113.28 | 102.29 | 41.35 | 120.80 | 138.95 |
| CapEx in $ Million | 65.72 | 54.14 | 84.26 | 76.63 | 111.19 |
| Free Cash Flow in $ Million | 47.56 | 48.16 | -42.90 | 44.16 | 27.76 |
| Total cash $ Million | 771.88 | 991.49 | 394.04 | 417.98 | 425.07 |
| Long-term debt in $ Million | 3,075.5 | 3,262.8 | 2,610.1 | 2601.5 | 2,585.5 |
| Shares outstanding (Basic) in Million | 7.91 | 7.95 | 8.31 | 9.08 | 9.10 |
Courtesy: NBR PR
*Estimated by Fun Trading.
Balance Sheet Snapshot
1 – Revenues and other income were $694.14 million in 3Q22
NBR Quarterly Revenues history (Fun Trading)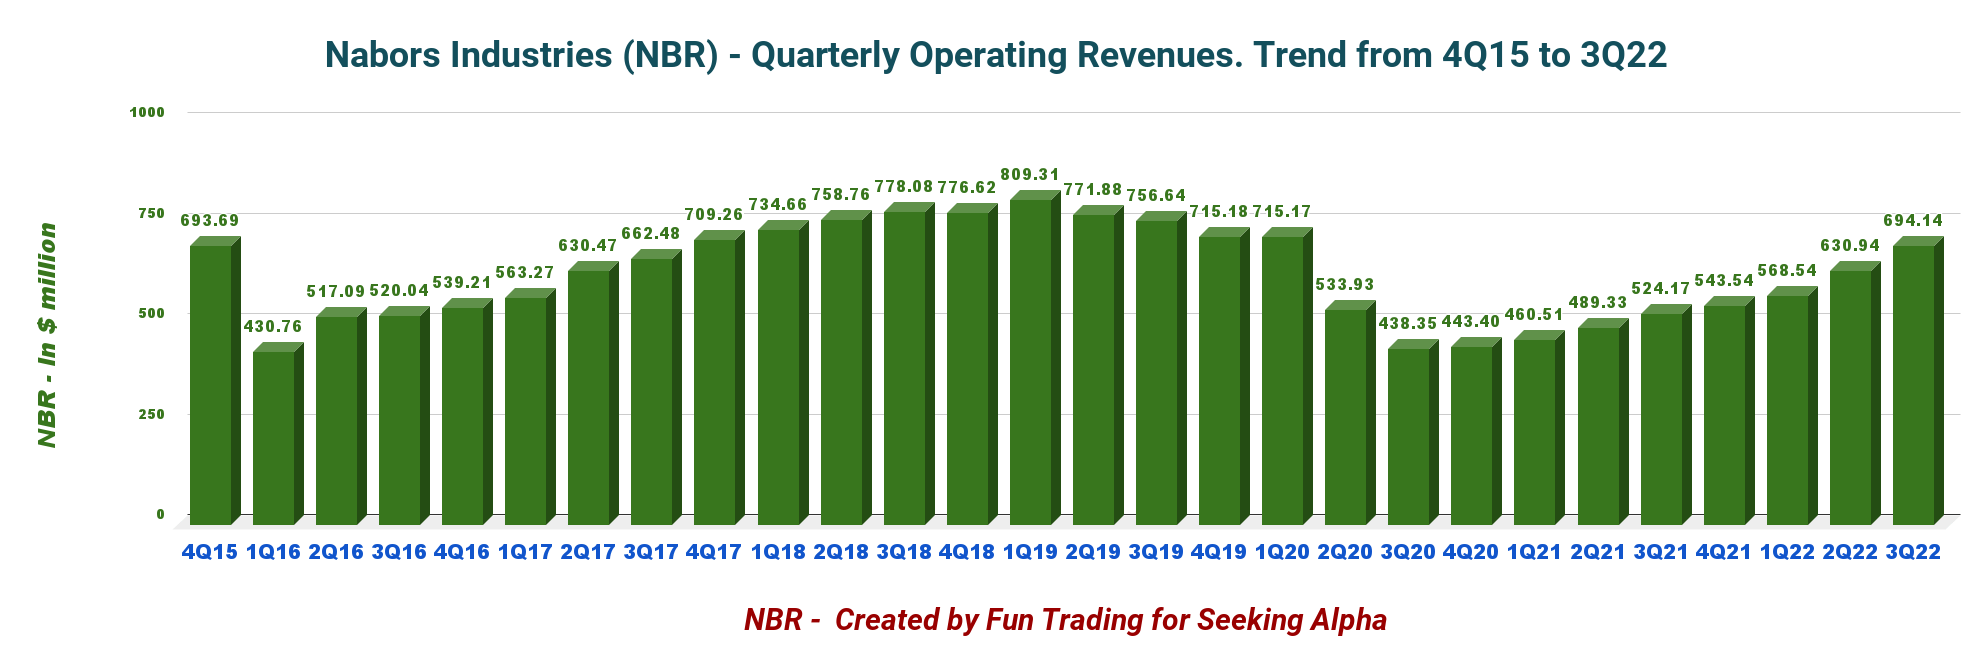
Note: Operating income plus investment income was $698.95 million.
Nabors Industries reported third quarter 2022 operating revenues totaling $694.14 million, up from $524.17 million in the same quarter last year (please look at the chart above).
The results were lower than expected due to much higher year-over-year total costs and expenses. The quarter’s net loss was $13.78 million, or $1.80 per diluted share, compared to a loss of $122.50 million, or $15.79 per share, during the third quarter of 2022. The adjusted loss was $5.54 per share from $14.16 a year earlier.
The second quarter adjusted EBITDA was $125.2 million compared to $190.8 million in the third quarter of 2021.
Conversely, Helmerich & Payne’s revenues were $631.33 million, with a quarter’s net income of $45.54 million or $0.42 per share.
H&P Quarterly revenues history (Fun Trading)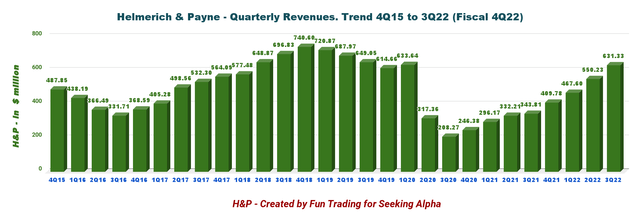
1.1 – NBR and H&P revenues per segment
1.1.1 – NBR revenues per segment
NBR 3Q22 revenue per segment (Fun Trading)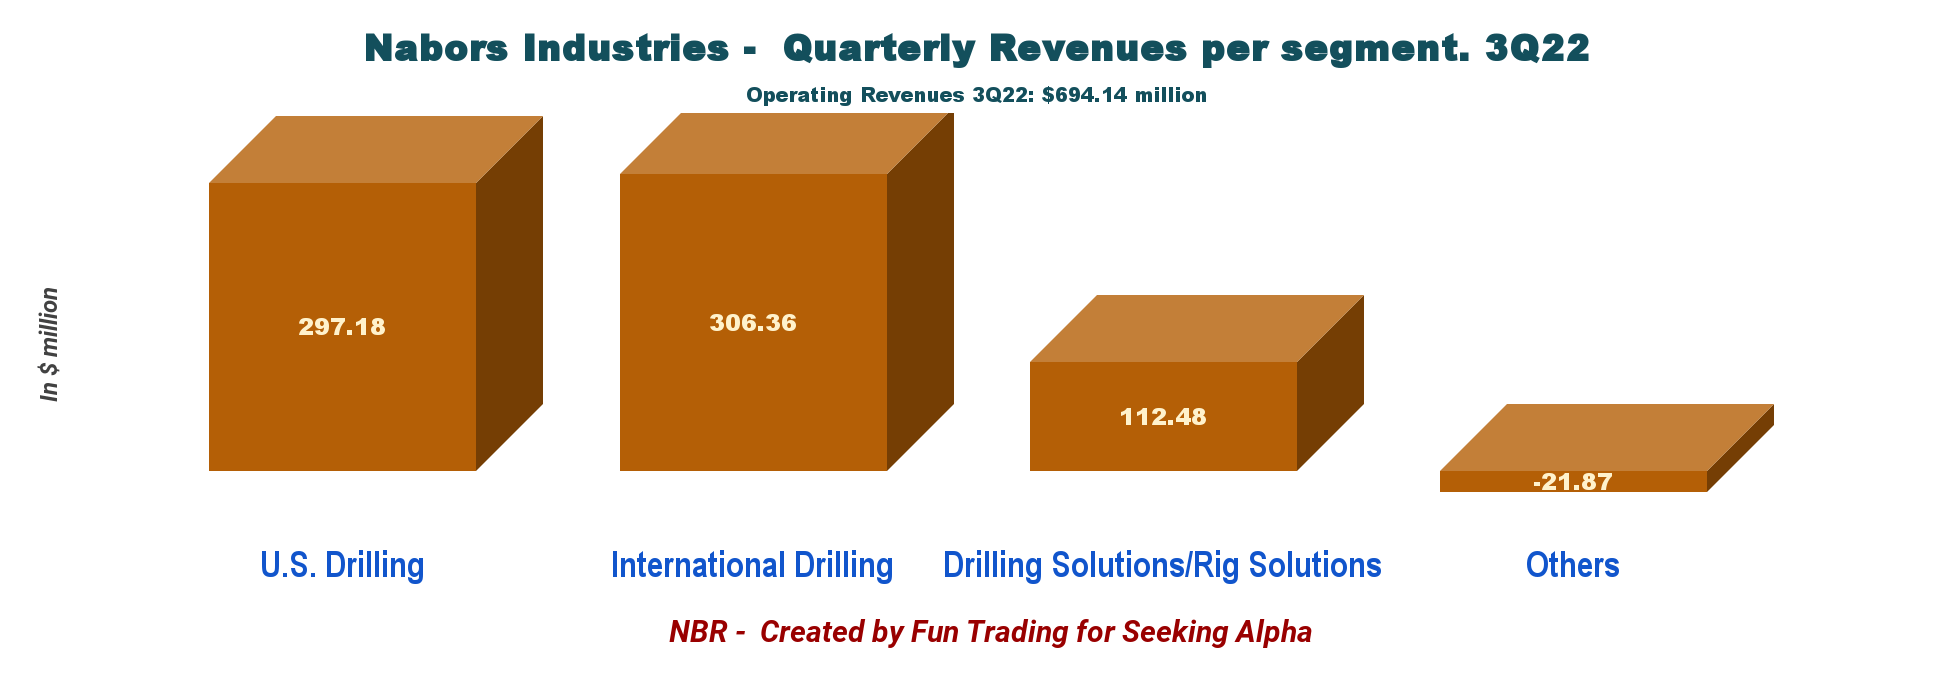
1.1.2 – Helmerich & Payne revenues per segment
NBR H&P Revenues per segment in 3Q22 (Fun Trading)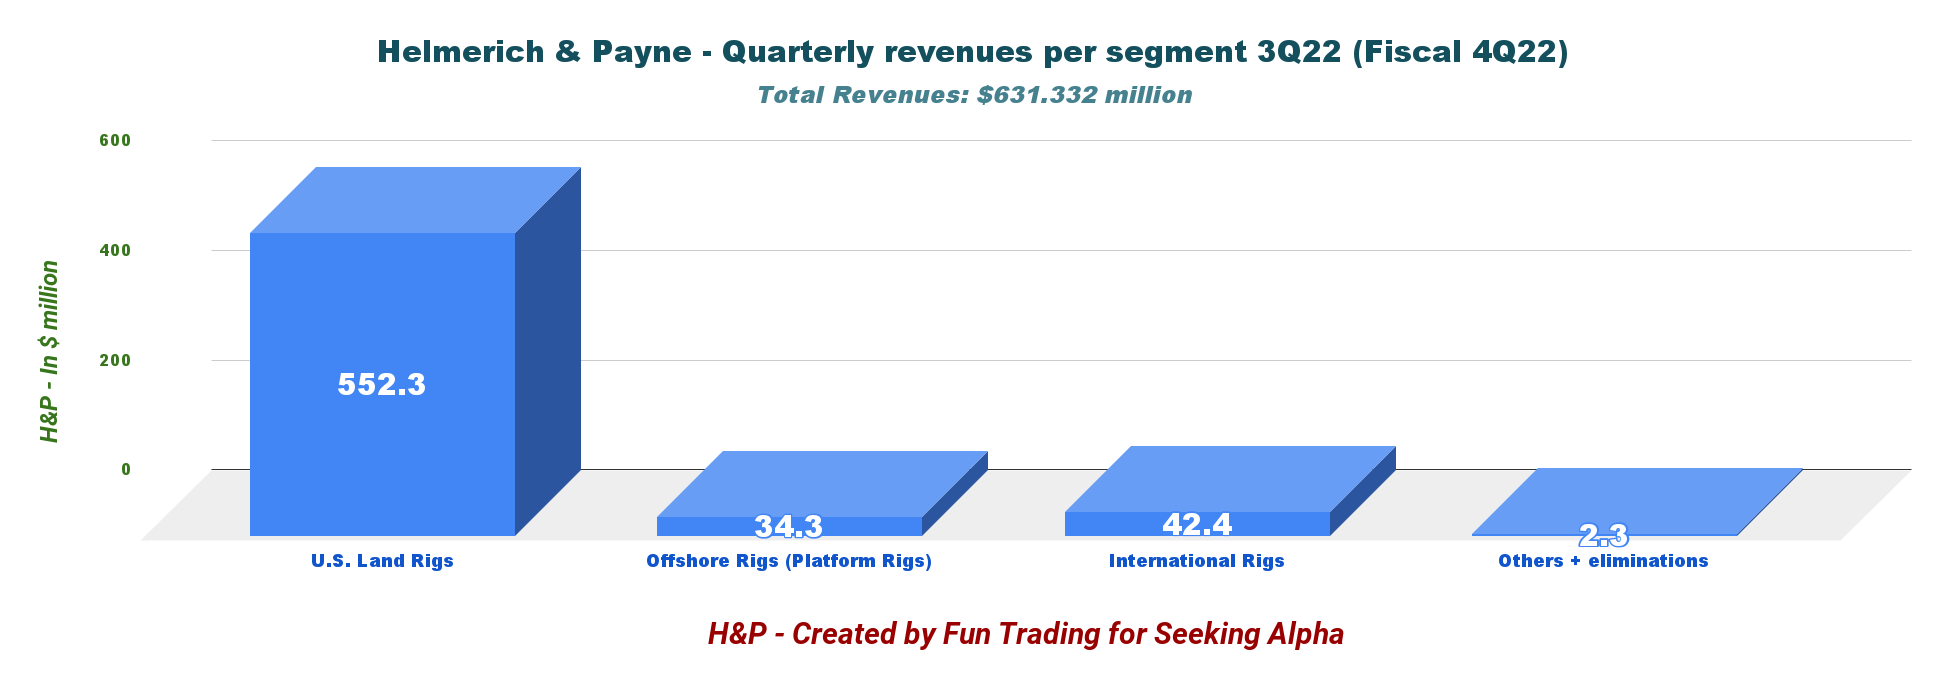
As we can see above, Helmerich & Payne’s US land rigs are more significant and generate a net income.
Conversely, Nabors Industries has a solid International segment that could pay off if oil prices turn bullish in 2023. The company has a strong presence in Saudi Arabia and has a new build program underway.
NBR SANAD deal (NBR Presentation)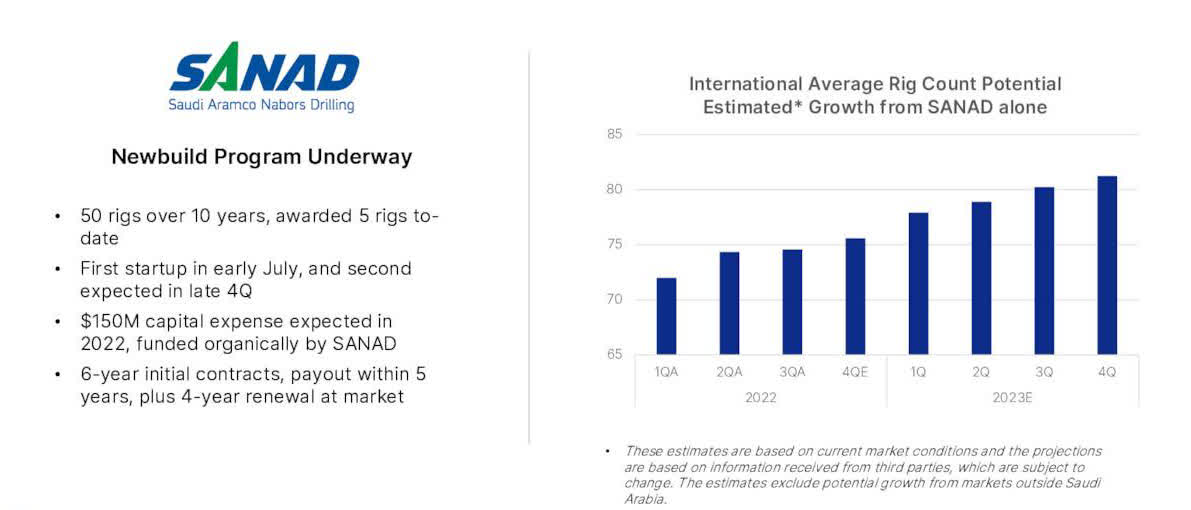
2 – Free cash flow was $27.76 million in 3Q22
NBR Quarterly Free cash flow history (Fun Trading)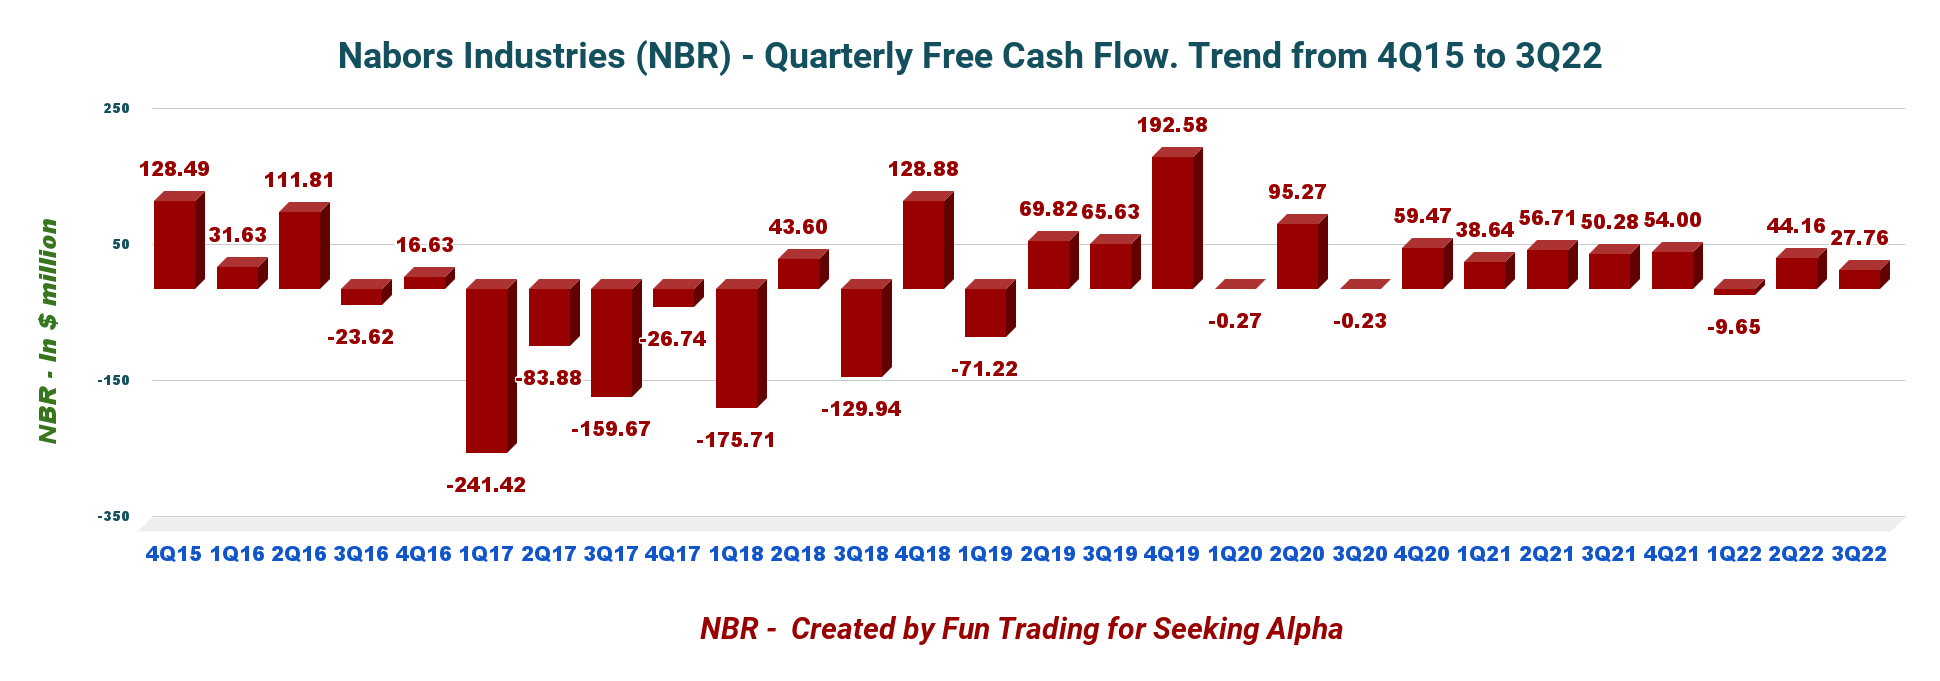
Note: The Generic free cash flow is cash from operations minus CapEx.
NBR’s trailing 12-month free cash flow was $77.18 million, with $27.76 million in 3Q22. The company is not paying a dividend.
Conversely, Helmerich & Payne recorded a negative trailing 12-month free cash flow of $16.99 million. The free cash flow for the fiscal fourth quarter is estimated at $59.56 million.
HP Quarterly Free cash flow history (Fun Trading)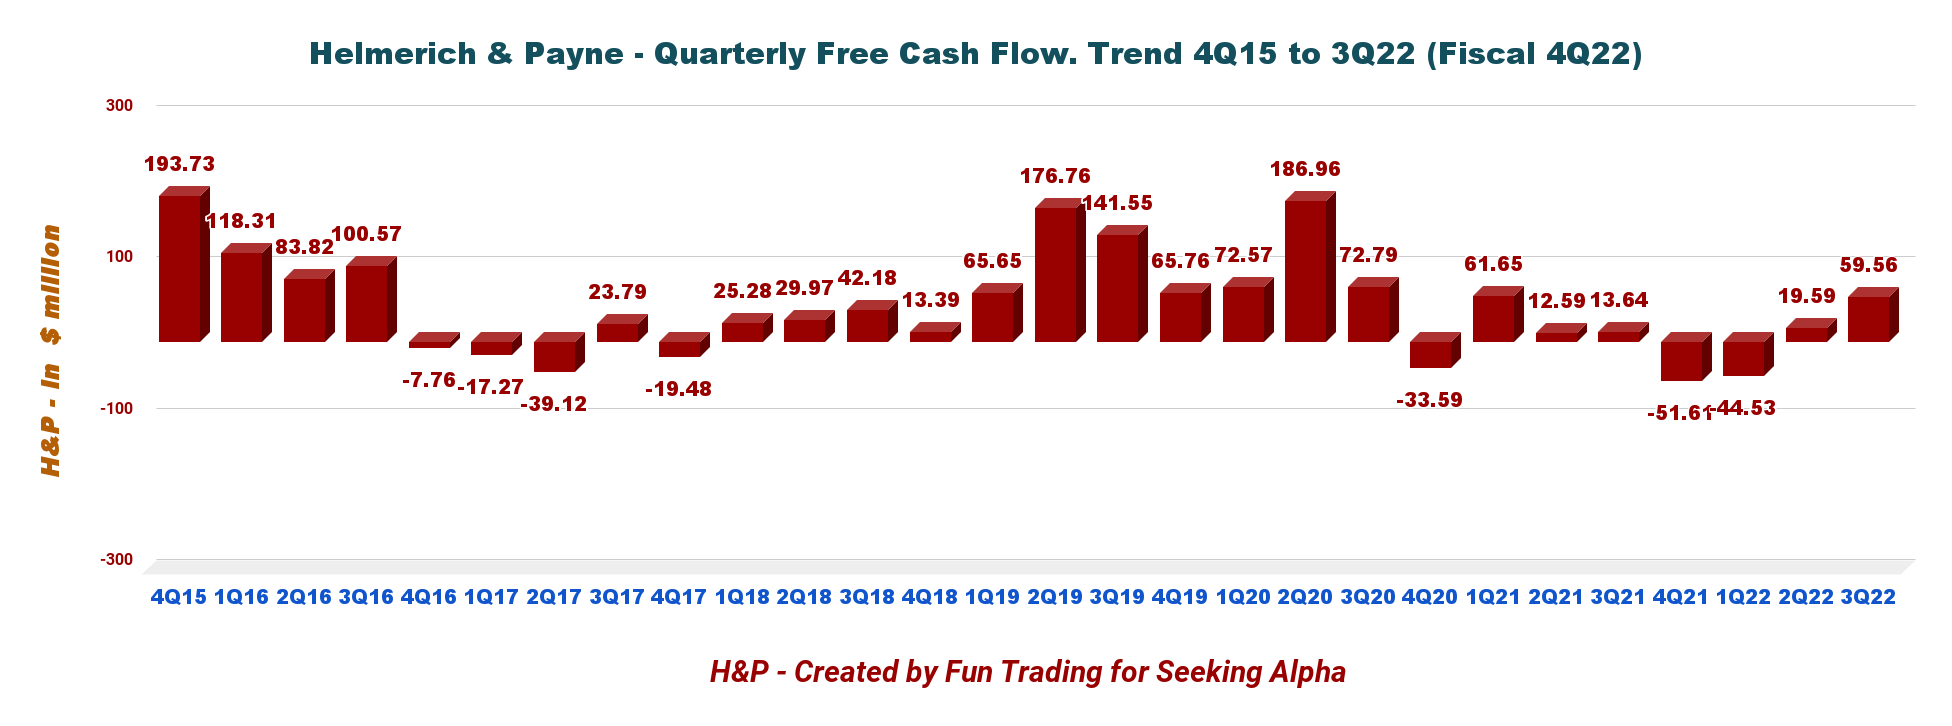
The crucial difference between NBR and H&P from an investor’s point of view is that H&P is paying a dividend with a yield of 3.8% (including supplemental dividends), while NBR is not. I said in my recent H&P article:
On September 7, 2022, H&P declared a quarterly base cash dividend of $0.25 per share, and on October 17, 2022, announced a supplemental cash dividend of $0.235 per share; both dividends are payable on December 1, 2022, to stockholders of record at the close of business on November 15, 2022. The total dividend paid on November 15, 2022, was $0.485 per share.
3 – Net debt is now down to $2.16 billion at the end of 3Q22
NBR Quarterly Cash versus Debt history (Fun Trading)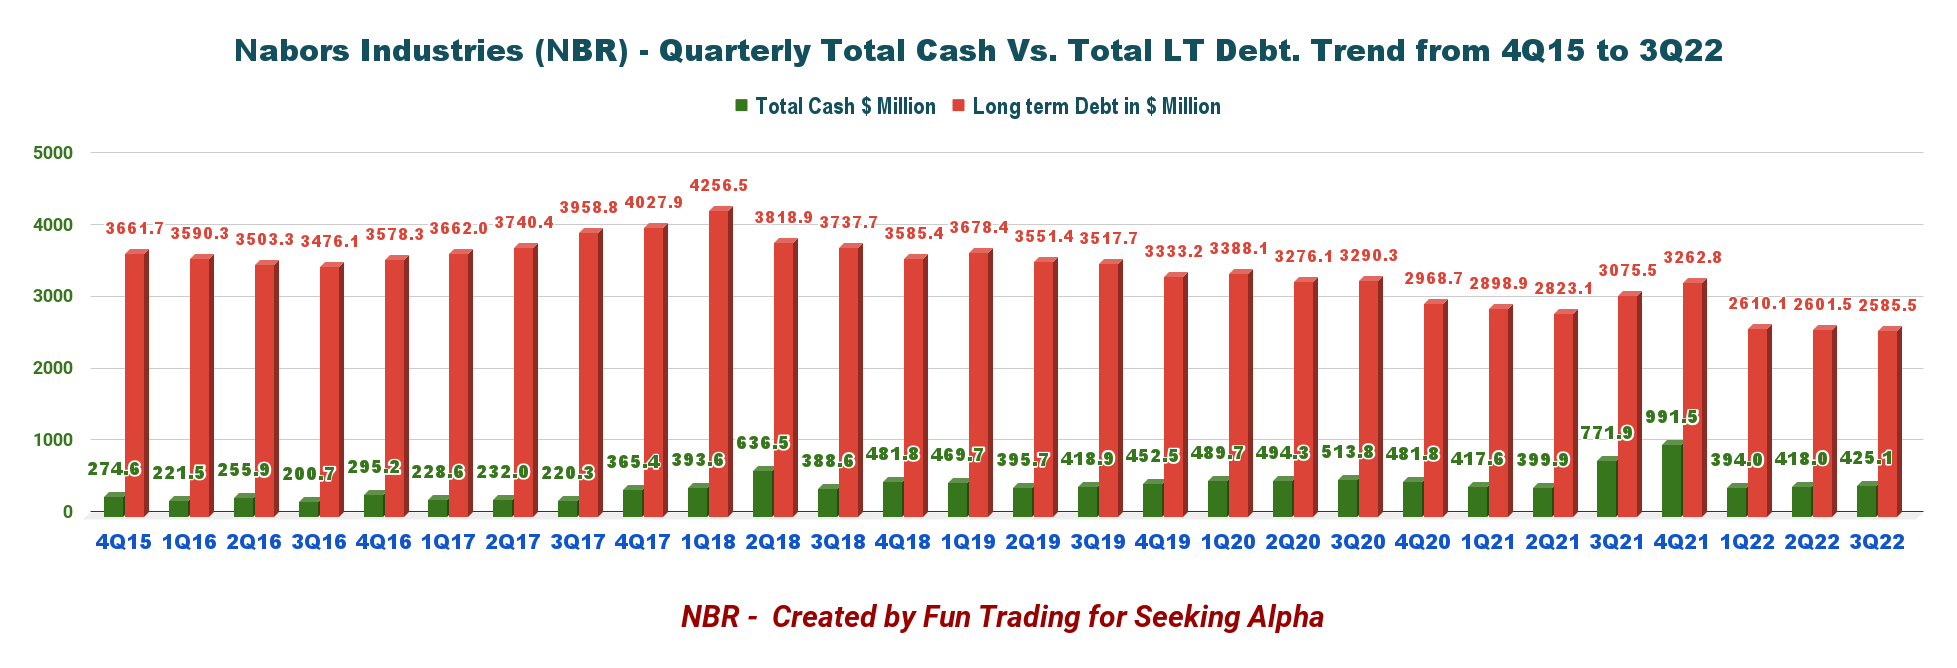
Total debt in the third quarter was $2,585.5 million. The total cash was $425.07 million. As we can see in the chart above, cash has been used to reduce debt.
However, H&P has a much better debt position. The company shows a net debt of $193.38 million in 3Q22, with a debt-to-capitalization of 16.6%. The company had $349.23 million in cash and short-term investments, plus $750 million of availability under its committed revolver. Total liquidity was roughly $1.1 billion on September 30, 2022.
Technical Analysis (Short Term) and Commentary
NBR TA chart short-term (Fun Trading StockCharts)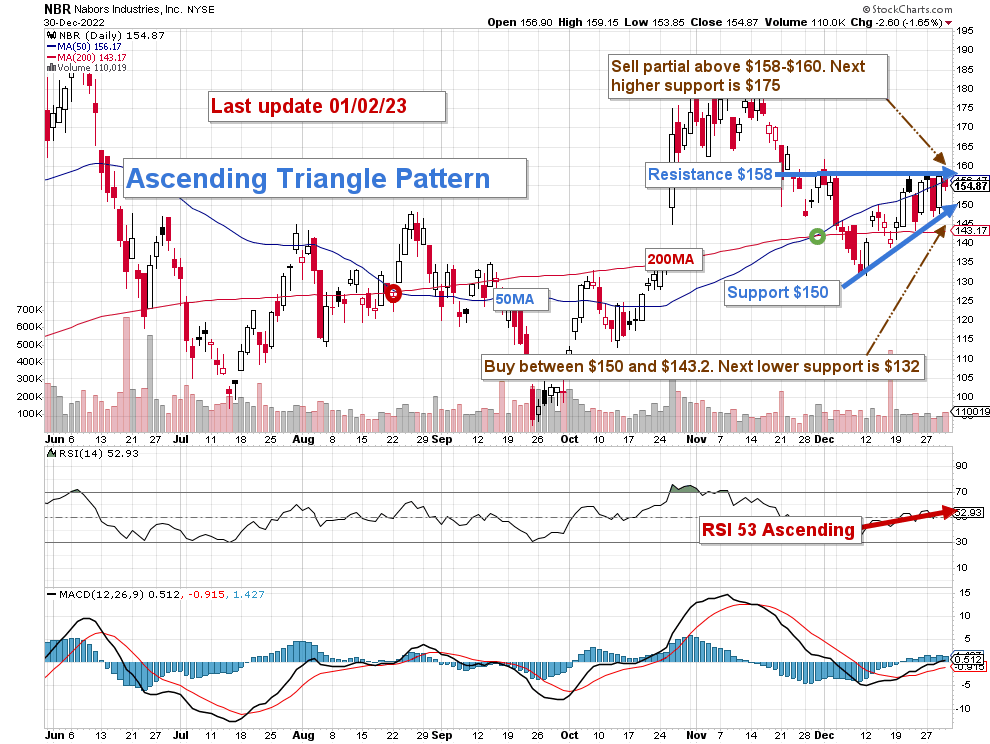
NBR forms an ascending triangle pattern, with resistance at $158 and support at $150.
Ascending triangles are a bullish formation that predicts an upside breakout. The RSI is ascending but still low, suggesting a possible breakout. However, oil prices will play a dominant role, and we could end up with a breakdown instead of assuming a continuation pattern.
Thus, I suggest selling over 50% of your position between $158 and $160 and waiting for a retracement between $150 and $143.2 to accumulate again, with potential lower support at $132.
Oil has rebounded recently, and NBR has significantly recovered from its recent lows. If oil prices cannot hold above $80, I believe NBR could drop as low as $100 in an extreme retracement matching mid-September lows.
Thus, Watch oil prices like a hawk.
Warning: The TA chart must be updated frequently to be relevant. It is what I am doing in my stock tracker. The chart above has a possible validity of about a week. Remember, the TA chart is a tool only to help you adopt the right strategy. It is not a way to foresee the future. No one and nothing can.
Author’s note: If you find value in this article and would like to encourage such continued efforts, please click the “Like” button below as a vote of support. Thanks!
Be the first to comment