

kynny/iStock via Getty Images
Although it may not be exciting to many investors, the fact of the matter is that some of the most promising investment opportunities can be found in the simplest businesses. Examples would be those related to the packaging and industrial supply space. While there are many firms in this space that offer attractive upside, not every one of them does. One prospect that seems to be just a mediocre play at this time is Myers Industries (NYSE:MYE). The historical track record of the company in recent years has demonstrated some degree of volatility on both its top and bottom lines. It would be different if shares of the company were trading on the cheap. While the company is not exactly expensive, it is a bit lofty relative to how other similar firms are priced. All of these factors, combined, have led me to rate the enterprise a ‘hold’ at this time.
Understanding Myers Industries
Most investors have probably never heard of Myers Industries. Located in my hometown of Akron, Ohio, the company is a fairly small player with a market capitalization of $806.8 million as of this writing. To best understand the firm, we should break it down into its two key operating segments. The first of these is its Material Handling segment. Through this, the company produces a wide array of durable plastic reusable containers that can be used multiple times throughout their life. They can be recycled and reprocessed into new products as well. In addition to this, the segment is also responsible for the production of pallets, small parts bins, bulk shipping containers, storage and organization products, OEM parts, custom plastic products, consumer fuel containers and tanks for water, fuel, and water handling, and more. During the company’s latest completed fiscal year, this segment was responsible for 74.1% of the company’s revenue and for an impressive 80.1% of its profits.
The other segment the company has is called Distribution. Through this segment, the company engages in the distribution of tools, equipment, and supplies that are used mostly in the automotive space. It also produces and sells permanent and temporary reflective highway marking tape directly to its end users. This portion of the enterprise is considerably smaller, accounting for just 25.9% of the company’s revenue and for just 19.9% of its profits during its 2021 fiscal year.
Author – SEC EDGAR Data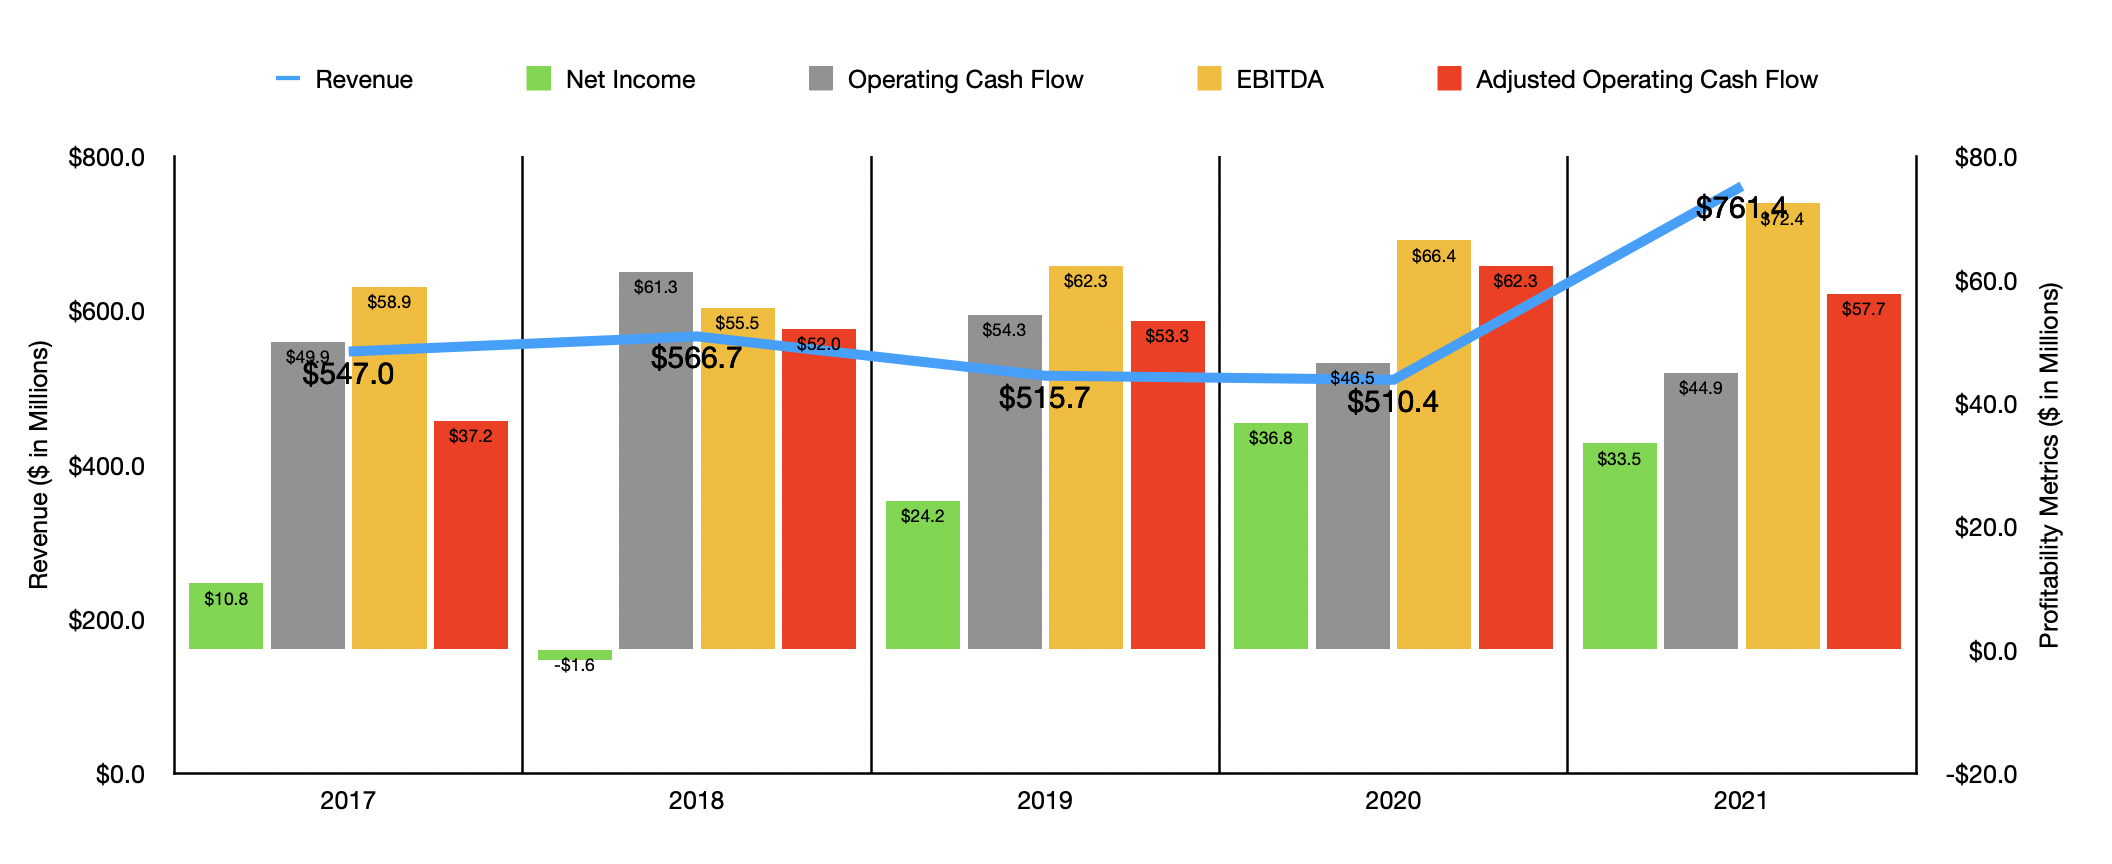
Over the past few years, the financial picture for Myers Industries has been somewhat mixed. After seeing revenue rise from $547 million in 2017 to $566.7 million in 2018, it then fell for two consecutive years, eventually bottoming out at $510.4 million in 2020. Then, in 2021, sales came in at $761.4 million. That represents an increase of 49.2% over what the company reported one year earlier. Although the Distribution segment saw revenue rise by 18.5% year over year, the lion’s share of the rise came from the Material Handling segment, with revenue jumping by 64%. According to management, this was driven in large part by $122.2 million of incremental revenue associated with acquisitions. However, higher volume and product mix added 48.3% to the segment’s revenue increase, while higher pricing contributed $47 million.
Just like how revenue has been all over the map, the same can be said of profitability. Net income has ranged from a low point of negative $1.6 million to a high point of $36.8 million. Operating cash flow, at least, has been more consistent. In the five years ending in 2021, it ranged between a low point of $44.9 million and a high point of $61.3 million. If we adjust for changes in working capital, we do see a clear trend. Between 2017 and 2020, the metric rose year after year, climbing from $37.2 million to $62.3 million. Then, in 2021, it dipped slightly to $57.7 million. The path for EBITDA more closely mirrored operating cash flow than anything. The only difference is that its range was tighter, with a low point of $55.5 million and a high point of $72.4 million. That high point was seen in 2021.
Author – SEC EDGAR Data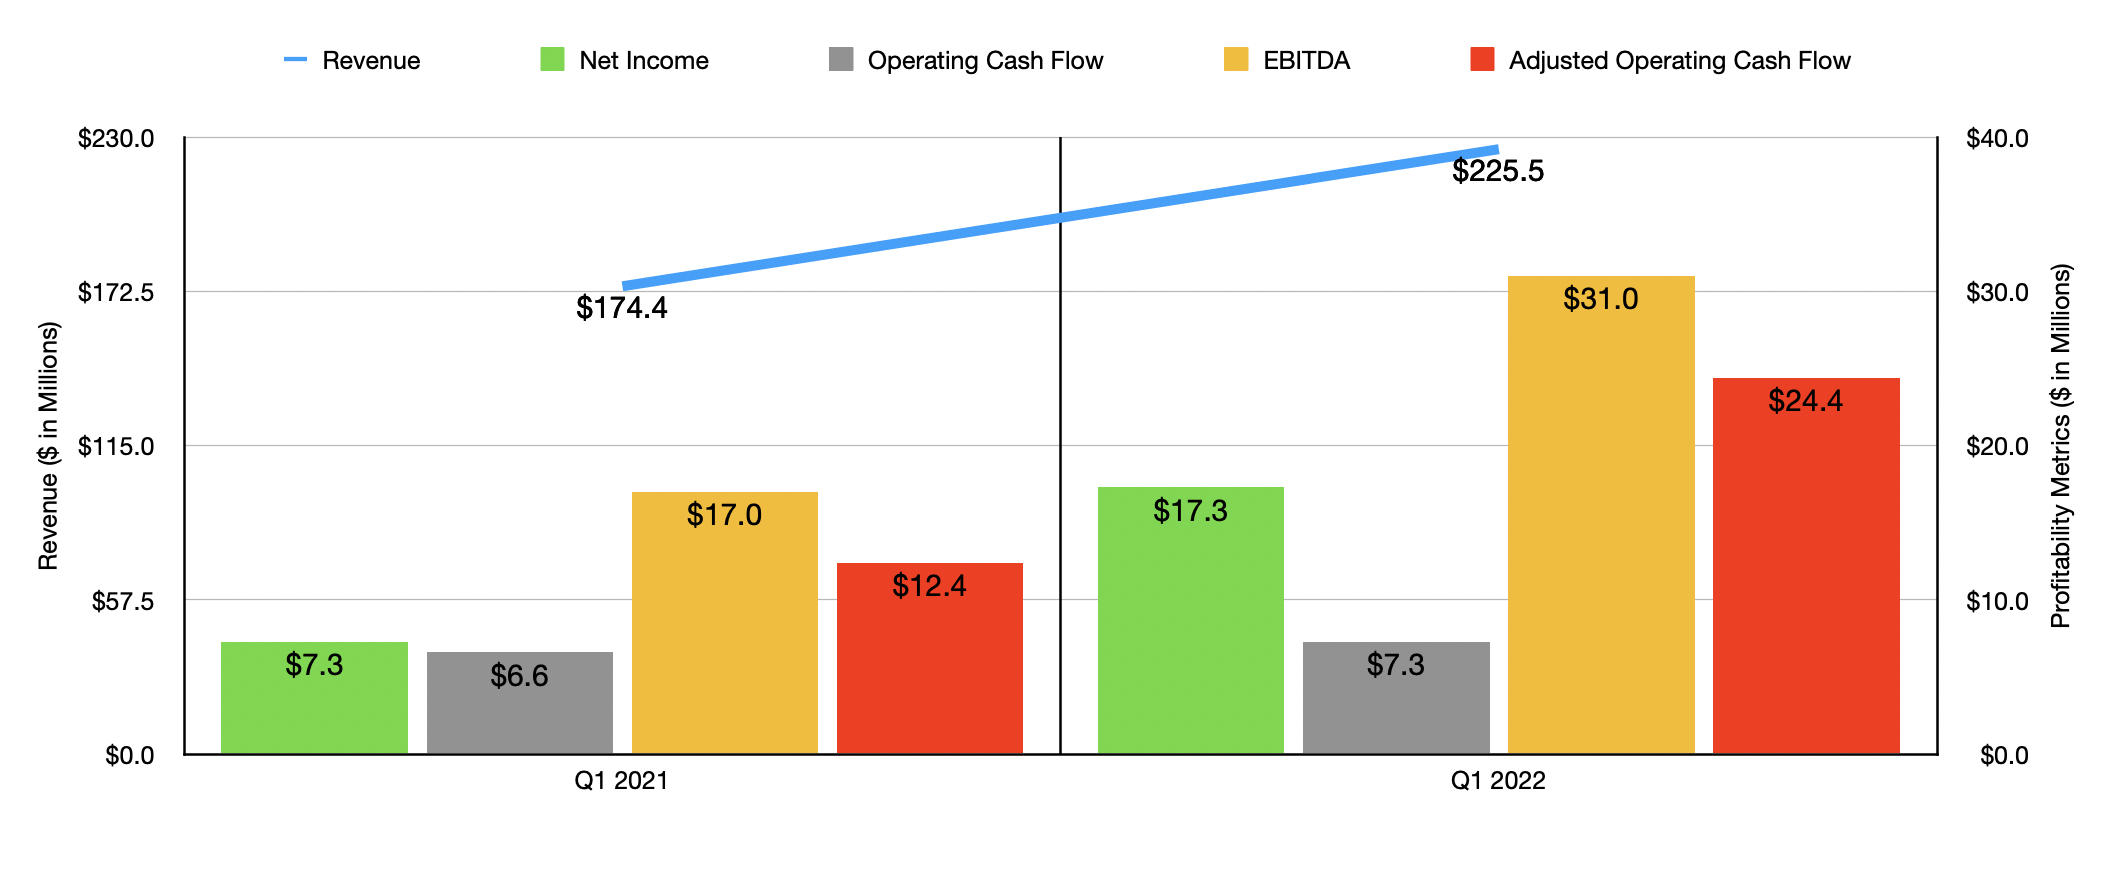
The good thing for investors is that strength for the business continued into the early stages of 2022. Revenue in the first quarter of the year totaled $225.5 million. That’s 29.3% higher than the $174.4 million reported for the first quarter of 2021. Once again, both segments contributed to this increase, with Distribution sales climbing by 9.7%, while Material Handling jumped by 36%. For the Material Handling segment, the company benefited to the tune of $31 million from higher pricing and to the tune of $4.8 million from higher volume and product mix. Incremental sales from one acquisition added $10.9 million to the company’s topline.
Profitability also continued to increase. Net income of $17.3 million beat out the $7.3 million reported one year earlier. Operating cash flow ticked up modestly from $6.6 million to $7.3 million. If we adjust for changes in working capital, the increase was even more impressive, with the metric rising from $12.4 million to $24.4 million. And EBITDA nearly doubled, jumping from $17 million to $31 million.
When it comes to the 2022 fiscal year as a whole, management does think that revenue will rise somewhere between the low to mid-double-digit rate with 25% of that increase attributable to its acquisition of Trilogy Plastics. Earnings per share, meanwhile, should be between $1.28 and $1.48. At the midpoint, that would translate to net income of $50.2 million. If we assume that other profitability metrics will rise at the same rate, then operating cash flow should be around $86.5 million, while EBITDA should be around $108.5 million.
Author – SEC EDGAR Data
Using these figures, we can easily value the company. On a forward basis, the firm is trading at a price-to-earnings multiple of 16.1. This compares to the 14 reading that we would get using 2021 results. The price to adjusted operating cash flow multiple should be 9.3. That’s actually down from the 11.1 reading that we get from the 2021 figures. Meanwhile, the EV to EBITDA multiple should drop from 12.3 using last year’s data to 8.2 this year. To put this in perspective, I compared the company to five similar firms. On a price-to-earnings basis, these companies ranged from a low of 6.1 to a high of 89.1. Three of the five companies were cheaper than Myers Industries. Using the price to operating cash flow approach, the range was from 3 to 9.7. In this case, our prospect was the most expensive of the group. When it comes to the EV to EBITDA approach, the range was from 5 to 15.2. In this scenario, four of the five companies were cheaper than our prospect.
| Company | Price/Earnings | Price/Operating Cash Flow | EV/EBITDA |
| Myers Industries | 14.0 | 11.1 | 12.3 |
| TriMas (TRS) | 19.8 | 9.3 | 10.6 |
| O-I Glass (OI) | 6.1 | 3.0 | 5.0 |
| Greif (GEF) | 10.6 | 9.5 | 7.3 |
| Ardagh Metal Packaging S.A. (AMBP) | 89.1 | 9.7 | 15.2 |
| Silgan Holdings (SLGN) | 12.1 | 9.7 | 9.5 |
Takeaway
Based on the data provided, it looks to me as though Myers Industries is doing quite well at this point in time. This follows a few years of decent but far from stellar results. The company is benefiting from the ability to transfer costs over to its clients. But it’s also benefiting from the aforementioned acquisitions that it made. Although I wouldn’t call the company overpriced, I do think that shares are probably closer to fairly valued. This is especially true when you consider how much cheaper similar firms are. Because of this, I have decided to rate the business a ‘hold’ at this time.
Be the first to comment