

Deagreez
Do you know the only thing that gives me pleasure? It’s to see my dividends coming in.” –John D. Rockefeller
If you’re anything like me, you love high-yield stocks. High-yield stocks have numerous benefits.
Bank of America 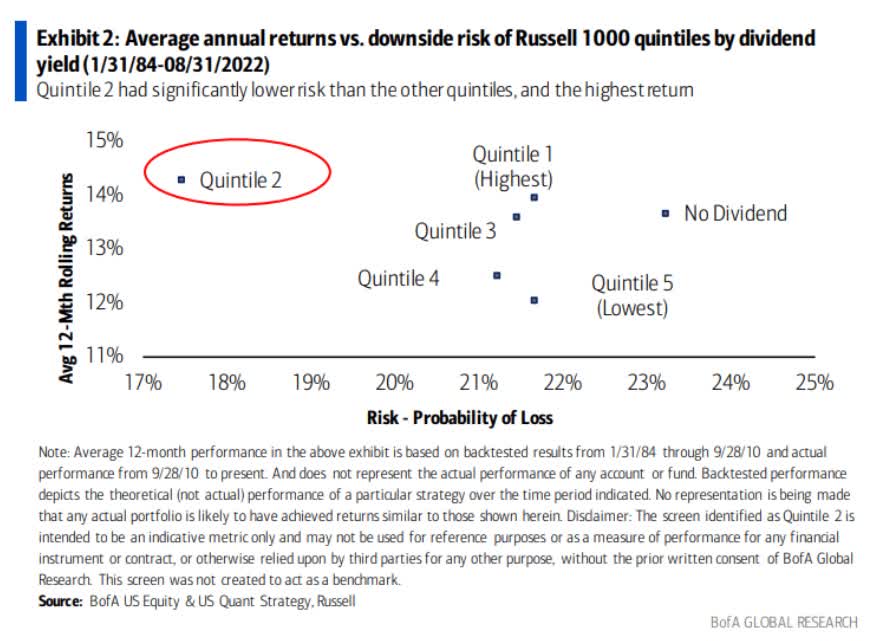
High-yield blue-chips historically deliver the best annual returns, about 14%, and with relatively lower volatility. These are mature businesses owned by long-term income investors who are less likely to panic sell in a downturn.
Those high returns are thanks to the fact that high-yield blue-chips tend to be value stocks with high margins of safety. They are coiled springs and tend to be less speculative (if you select the right ones).
The purpose of the margin of safety is to render the forecast unnecessary.” – Ben Graham
And of course, we can’t forget the most valuable straight of high-yield blue-chips, they offer you true financial independence.
When you can live off post-tax dividends alone (or a fraction of them), you never have to worry about stock prices again. As long as their fundamentals are intact, the dividends are safe, and you can blissfully ignore the market’s wild gyrations.
But given the rising recession risk in 2023, it’s more important than ever to focus not just on yield but SAFE and GROWING yield.
Yield traps are plentiful in today’s market environment.
- 2,956 stocks have yields of 10+%
- 127 yield 15+%
- 62 yield 20+%
- 35 yield 25+%
None of these are safe for retirees, but there are lots of ultra-yield blue-chip bargains available if you know where to look.
Let me show you how to easily and conveniently find the best ultra-yield blue-chip bargains you can safely buy in this bear market. These Super SWAN (sleep well at night) blue-chips can help you pay the bills today, and potentially retire in safety and splendor in the years and decades to come.
How To Find The Safest Ultra-Yielding Blue-Chips In 1 Minute
Let me walk you through a quick and easy screen using the Dividend Kings Zen Research Terminal, which runs off the DK 500 Master List.
The DK 500 Master List is one of the world’s best watchlists, including
- every dividend aristocrat (S&P companies with 25+ year dividend growth streaks)
- every dividend champion (every company, including foreign, with 25+ year dividend growth streaks)
- every dividend king (every company with 50+ year dividend growth streaks)
- every foreign aristocrat (every company with 20+ year dividend growth streaks)
- every Ultra SWAN (wide moat aristocrats, as close to perfect quality companies as exist)
- 40 of the world’s best growth stocks.
| Step | Screening Criteria | Companies Remaining | % Of Master List |
| 1 | Reasonable Buy, Good Buy, Strong Buy, Very Strong Buy, Ultra Value Buy (Never Overpay For Stocks) | 345 | 68.45% |
| 2 | Dividend Yield 5+% | 45 | 8.93% |
| 3 | Dividend Safety Score 81+% (Very Safe, 2% or less risk of a cut in a severe recession) | 22 | 4.37% |
| 4 | 10+% Consensus LT Total Return Potential | 17 | 3.37% |
| 5 | Investment Grade Credit Rating | 17 | 3.37% |
| Total Time | 1 Minute |
(Source: DK Research Terminal)
My, Oh My, 17 Ultra-Yield Blue-Chip Strong Buys
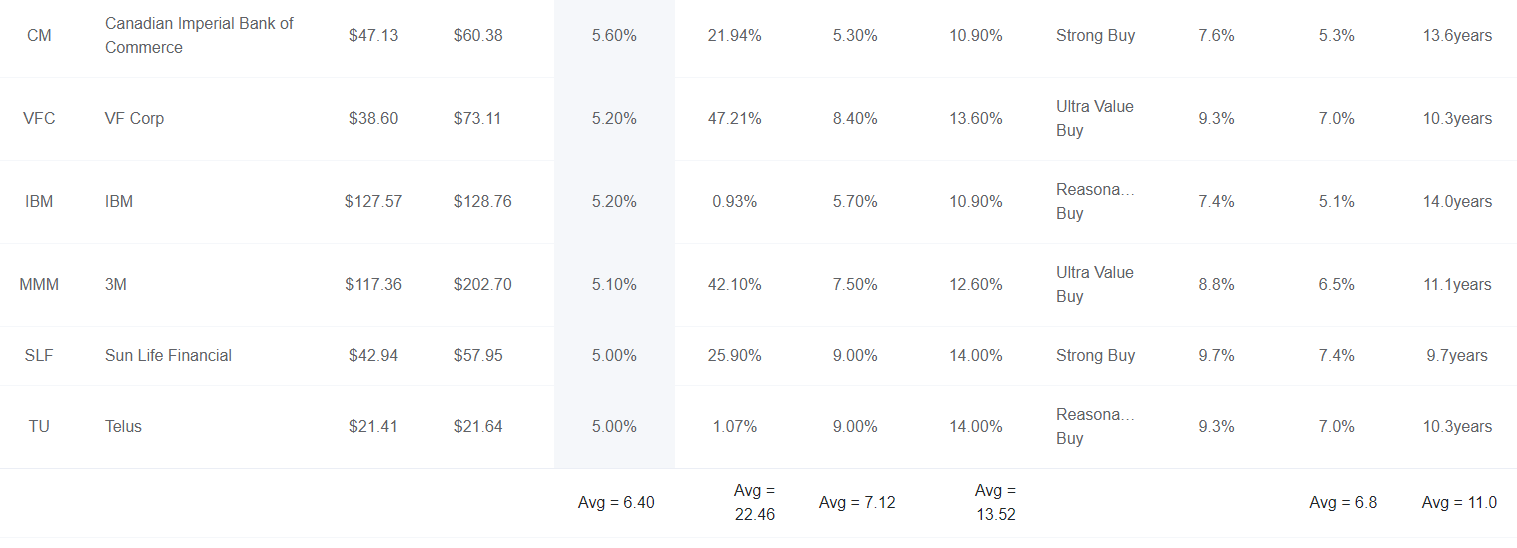
(Source: Dividend Kings Zen Research Terminal)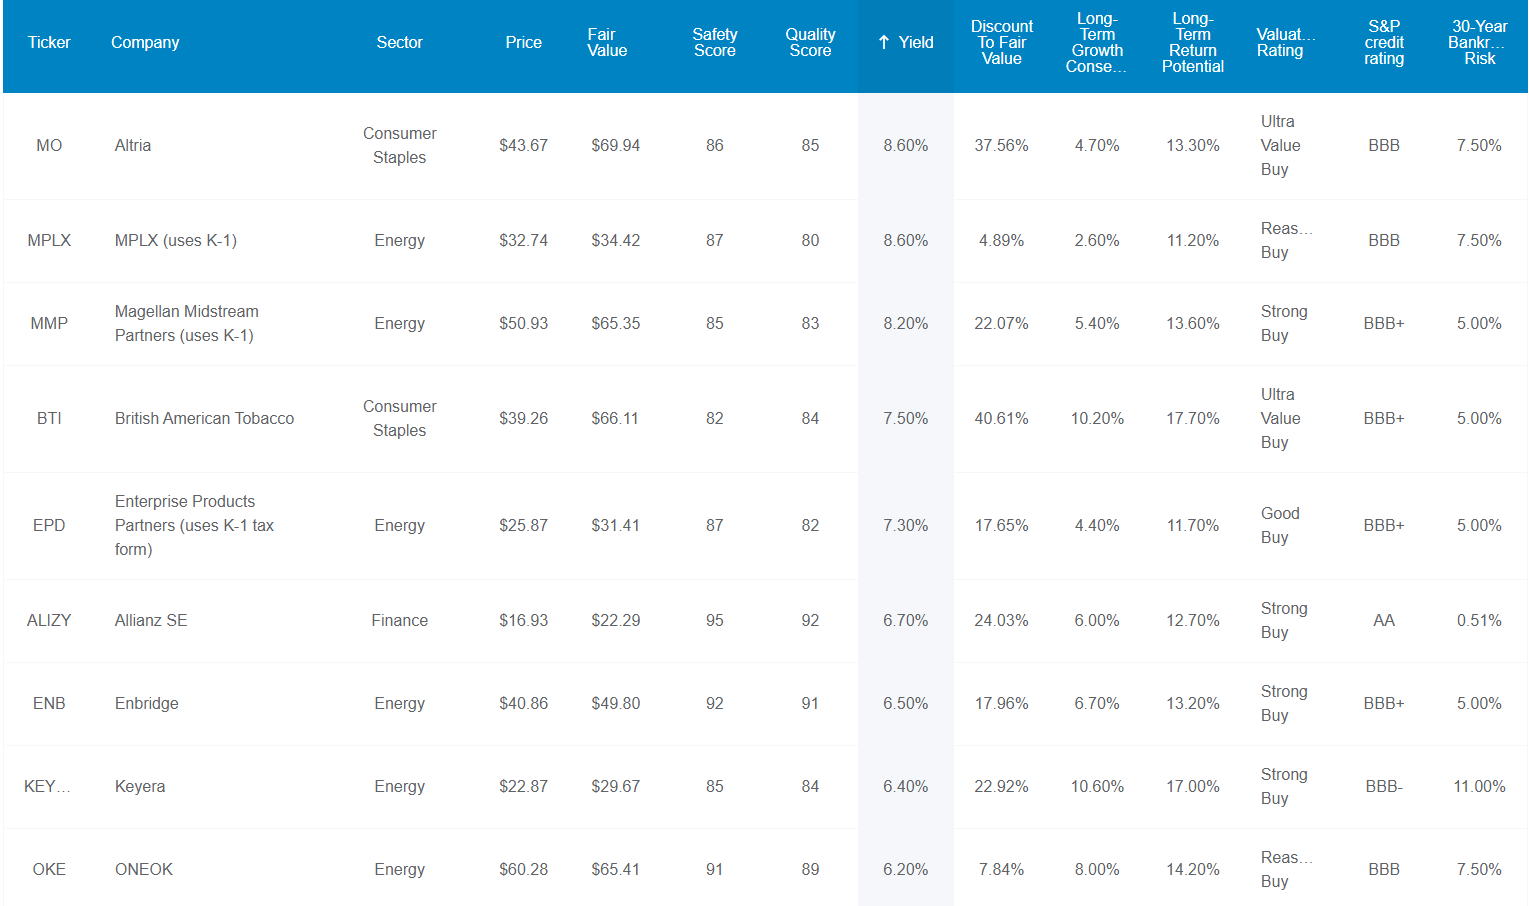
(Source: Dividend Kings Zen Research Terminal)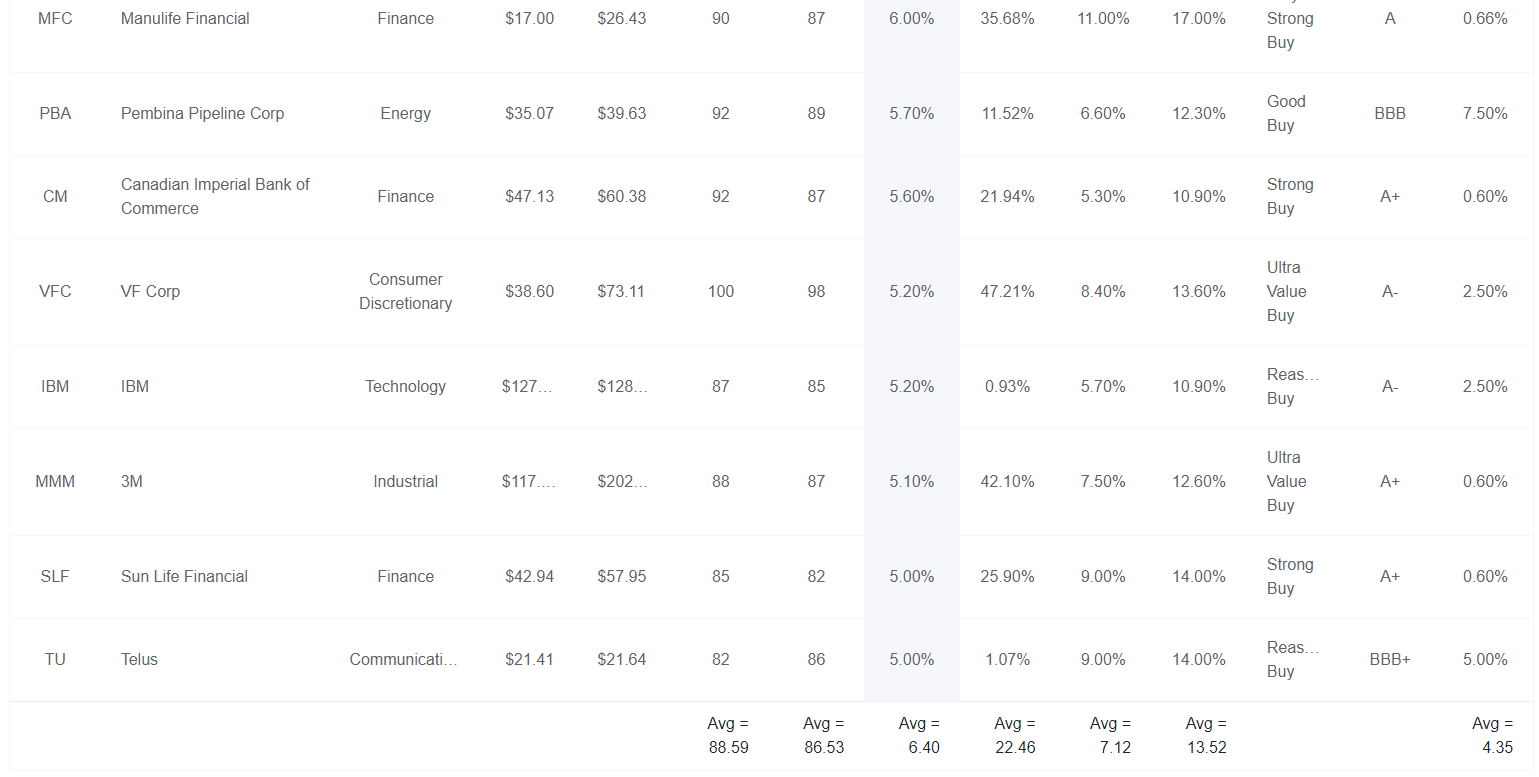
I’ve linked to articles exploring each company’s investment thesis, growth outlook, safety and quality, risk profile, valuation, and total return potential.
Here they are in order of highest to lowest yield.
- Altria (MO) dividend king
- MPLX (MPLX) – K1 tax form
- Magellan Midstream Partners (MMP): – K1 tax form
- British American Tobacco (BTI) global aristocrat
- Allianz (OTCPK:ALIZY): German
- Enbridge (ENB): Canadian aristocrat
- Keyera (OTCPK:KEYUF)
- ONEOK (OKE)
- Manulife Financial (MFC): Canadian
- Pembina Pipeline (PBA): Canadian
- Canadian Imperial Bank of Commerce (CM): Canadian
- VF Corp (VFC): dividend king
- IBM (IBM): speculative dividend aristocrat (2.5% or less max risk cap rec)
- 3M (MMM): dividend king
- Sun Life Financial (SLF): Canadian
- Telus (TU): Canadian
Tax Implications
- ENB, KEYUF, MFC, PBA, CM, SLF, and TU are Canadian companies
- 15% dividend tax withholding in NON-TAXABLE accounts
- non in retirement accounts
- tax credit available for recouping the withholding in taxable accounts
- best owned in retirement accounts
- ALIZY is a German company
- 26.375% tax withholding
- the tax credit only available in taxable accounts
- don’t own in retirement accounts.
FAST Graphs Upfront
Altria 2024 Consensus Total Return Potential
(Source: FAST Graphs, FactSet)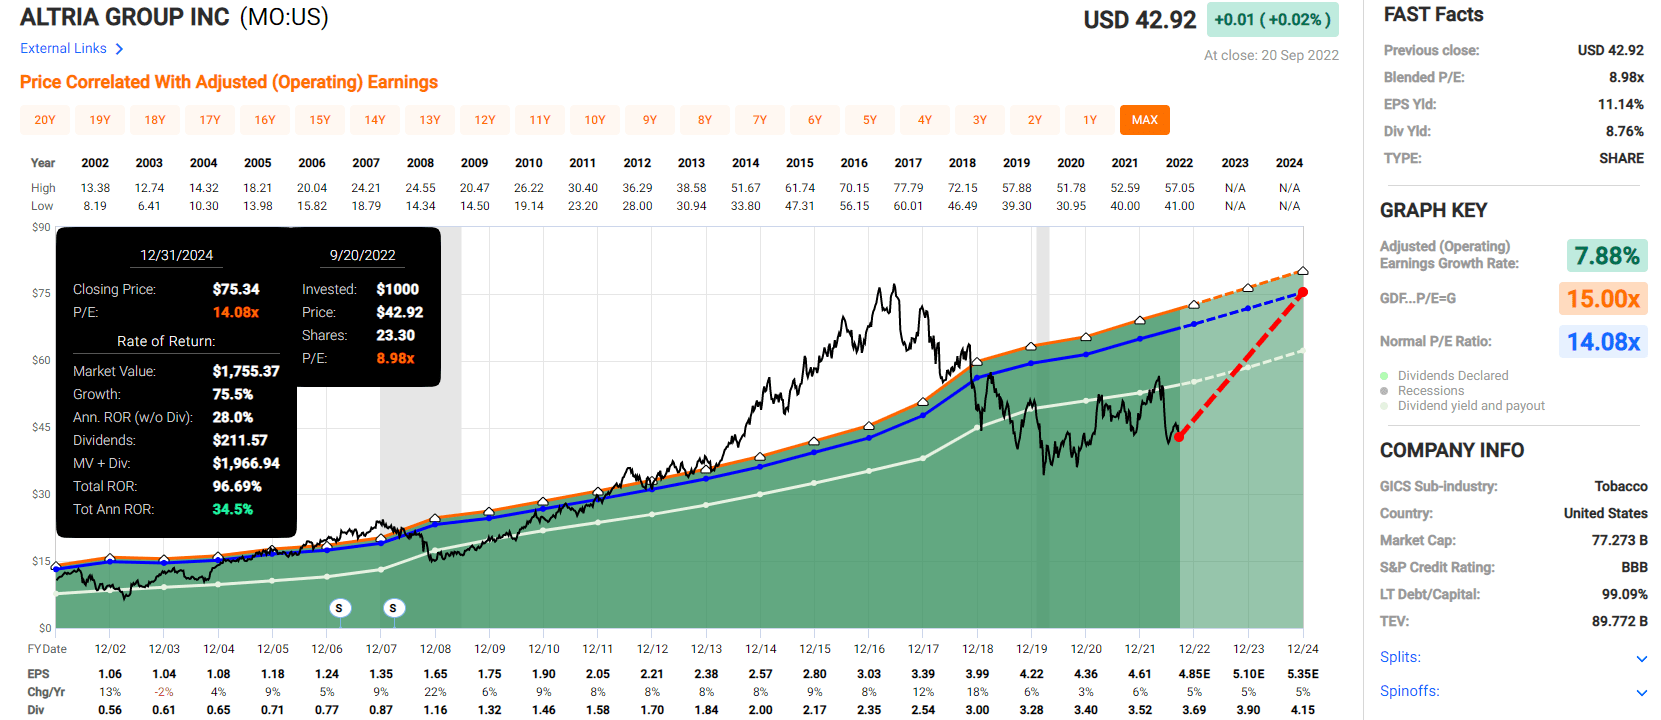
MPLX 2024 Consensus Total Return Potential
(Source: FAST Graphs, FactSet)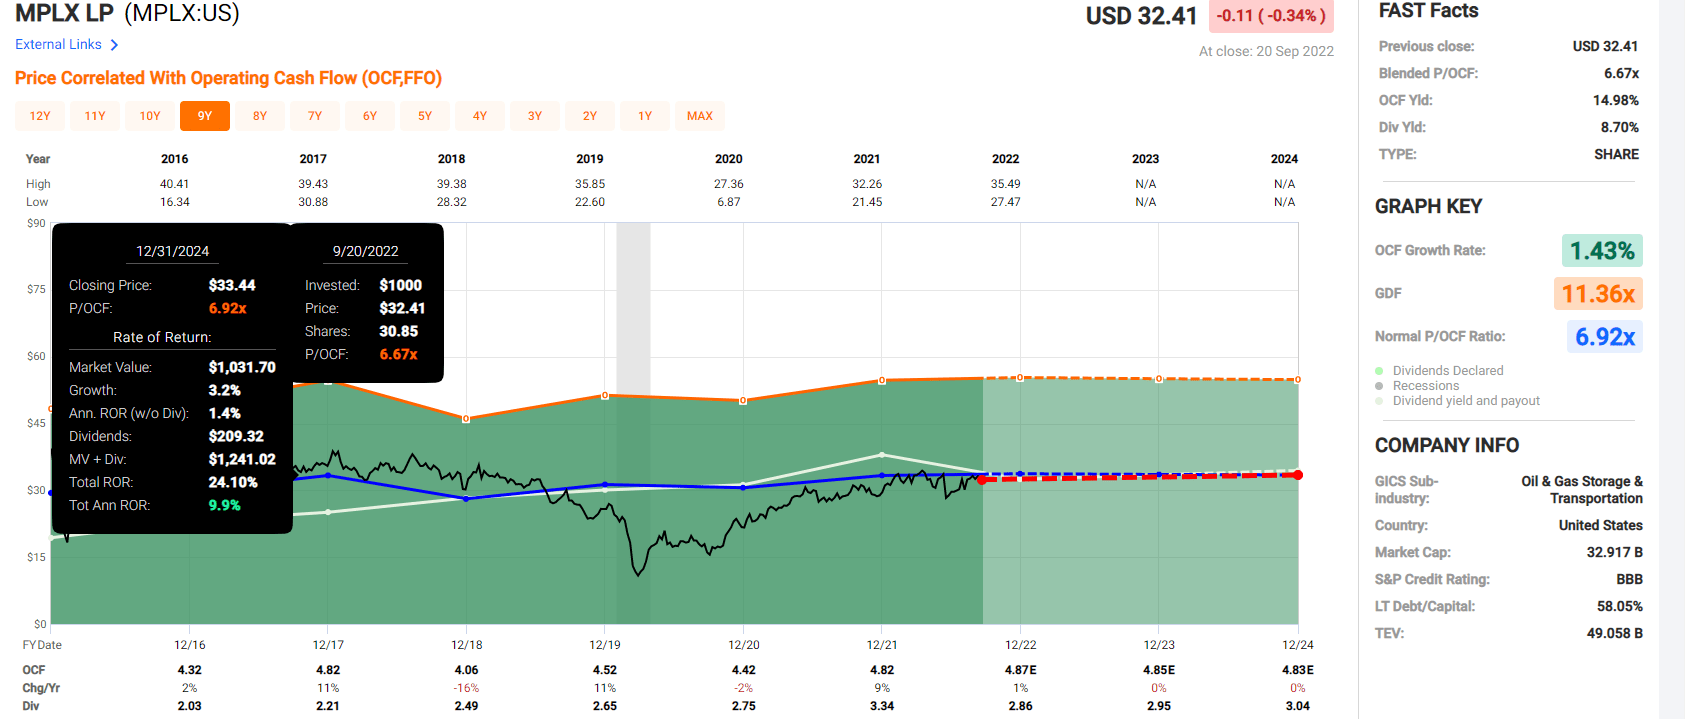
Magellan Midstream Partners 2024 Consensus Total Return Potential
(Source: FAST Graphs, FactSet)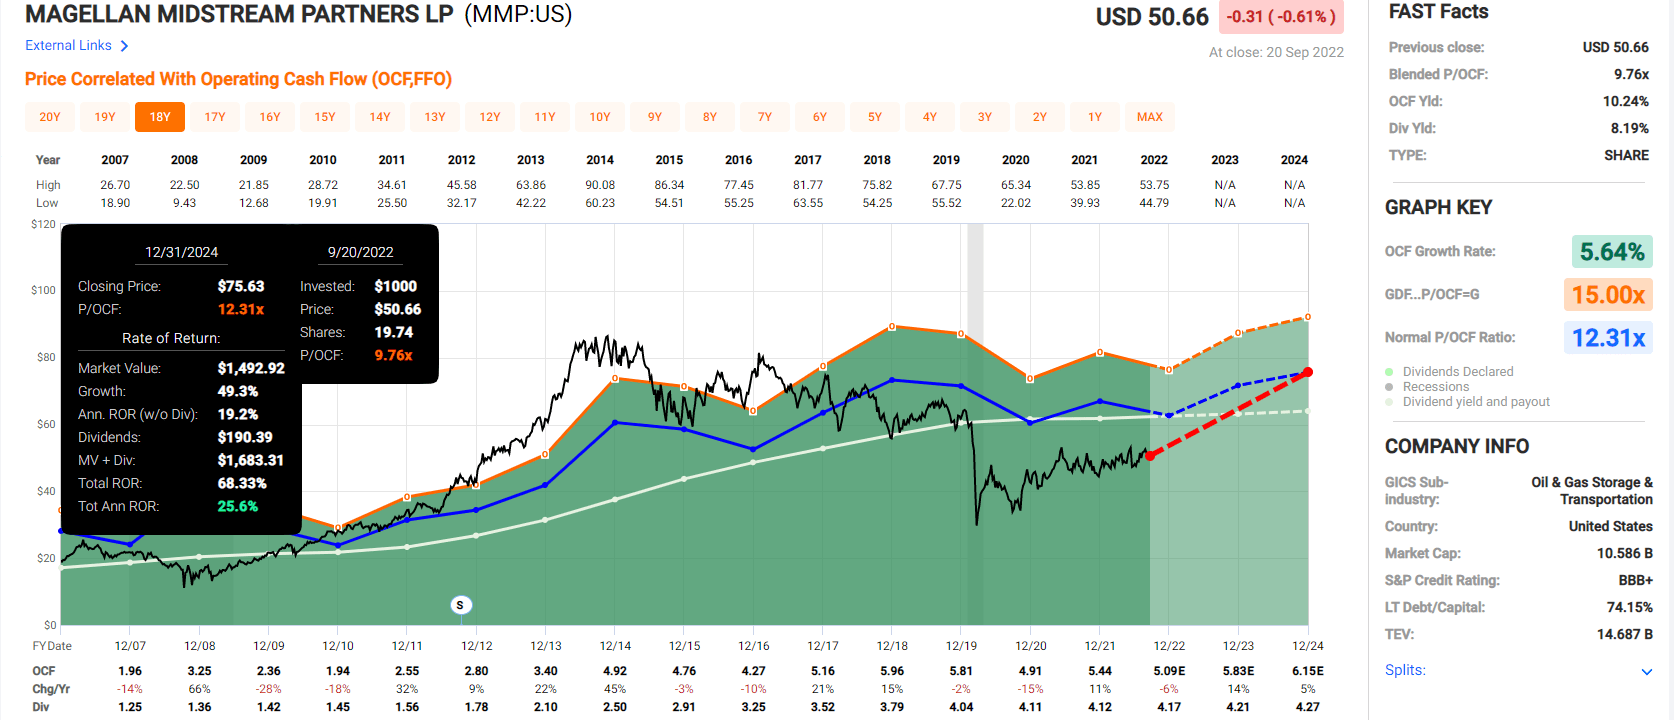
Enterprise Products Partners 2024 Consensus Total Return Potential
(Source: FAST Graphs, FactSet)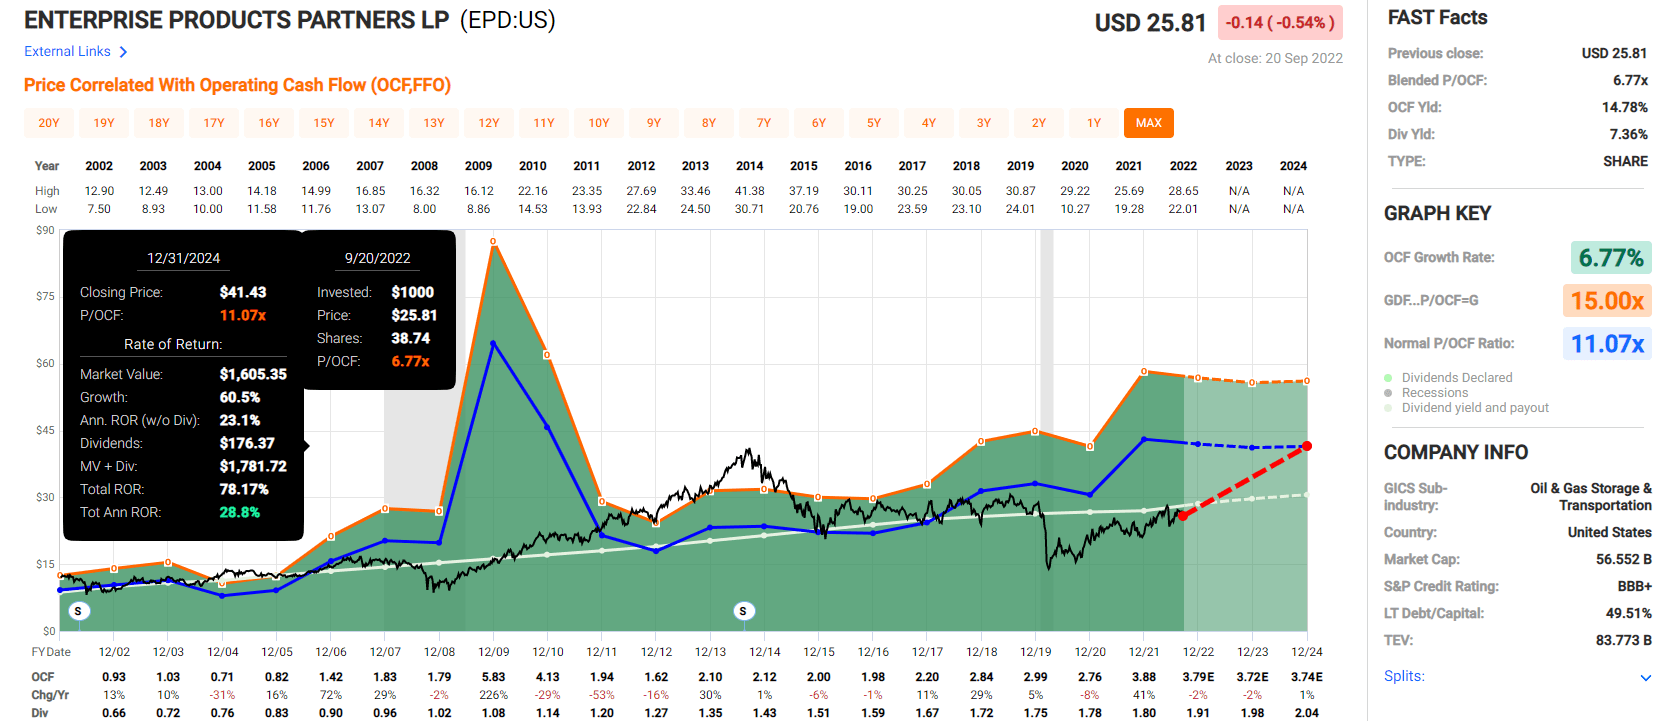
Allianz 2024 Consensus Total Return Potential (1.1 Book Value = 12.3 PE)
(Source: FAST Graphs, FactSet)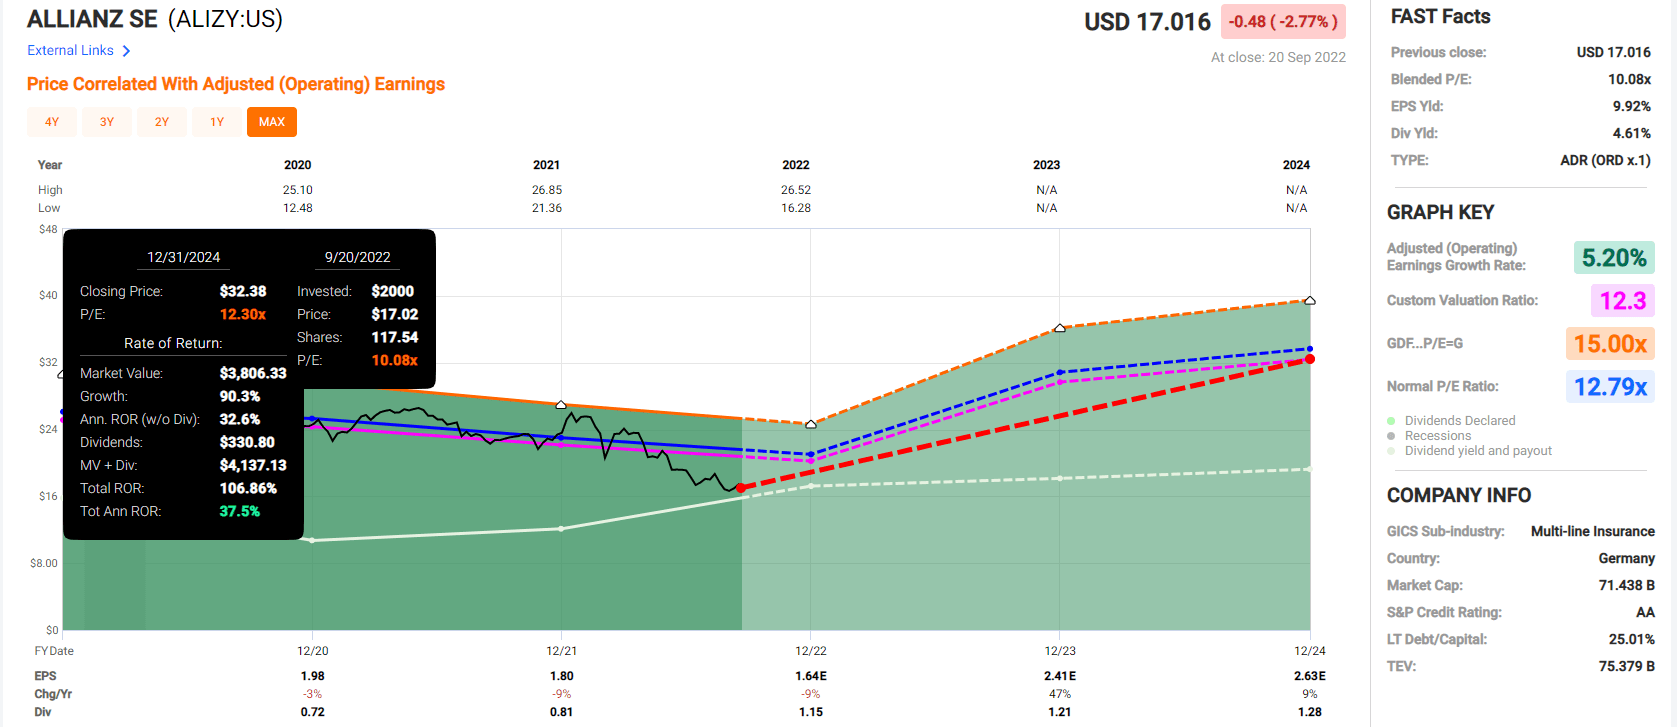
Keyera 2024 Consensus Total Return Potential
(Source: FAST Graphs, FactSet)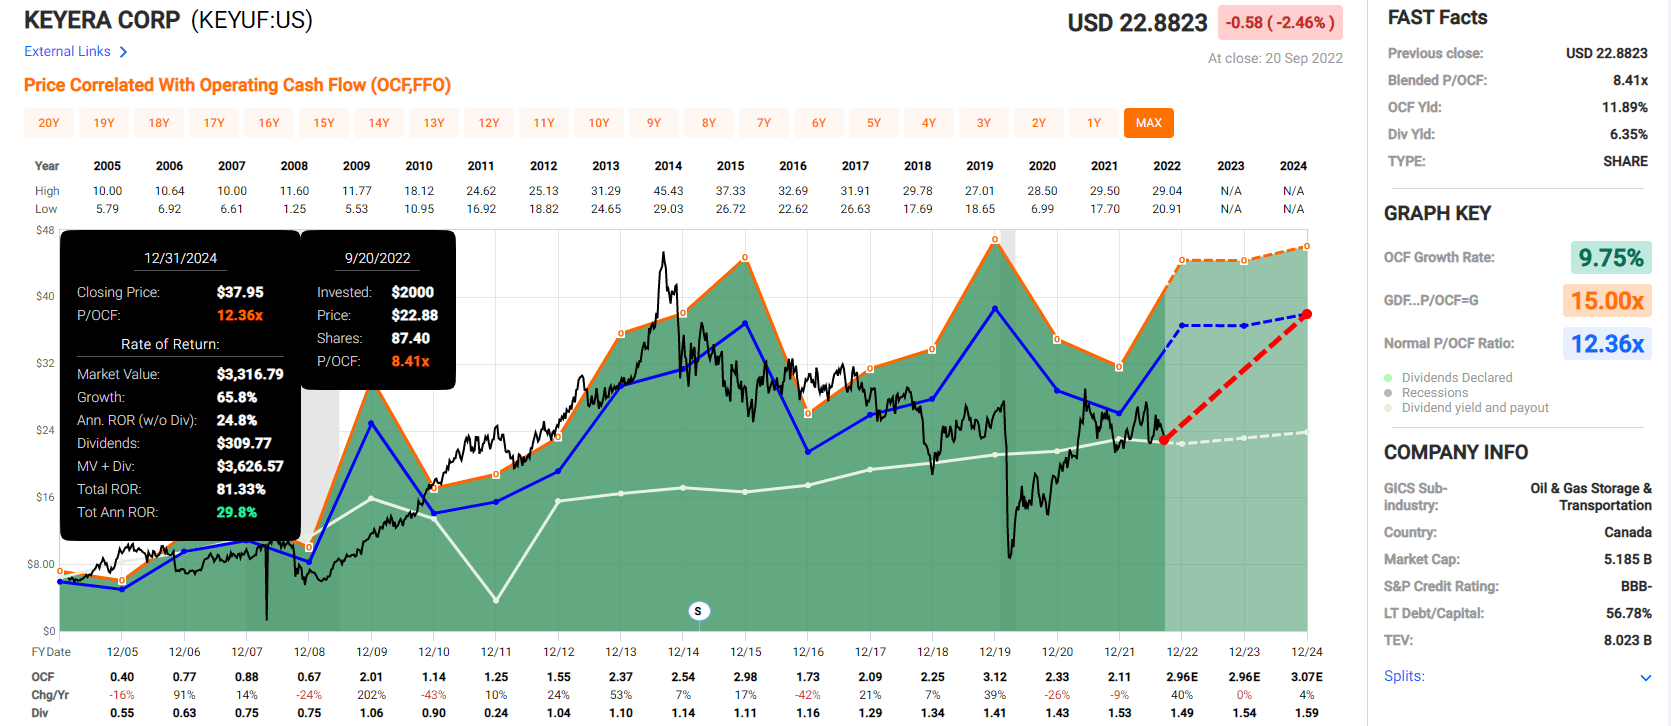
Enbridge 2024 Consensus Total Return Potential
(Source: FAST Graphs, FactSet)
ONEOK 2024 Consensus Total Return Potential
(Source: FAST Graphs, FactSet)
Manulife Financial 2024 Consensus Total Return Potential
(Source: FAST Graphs, FactSet)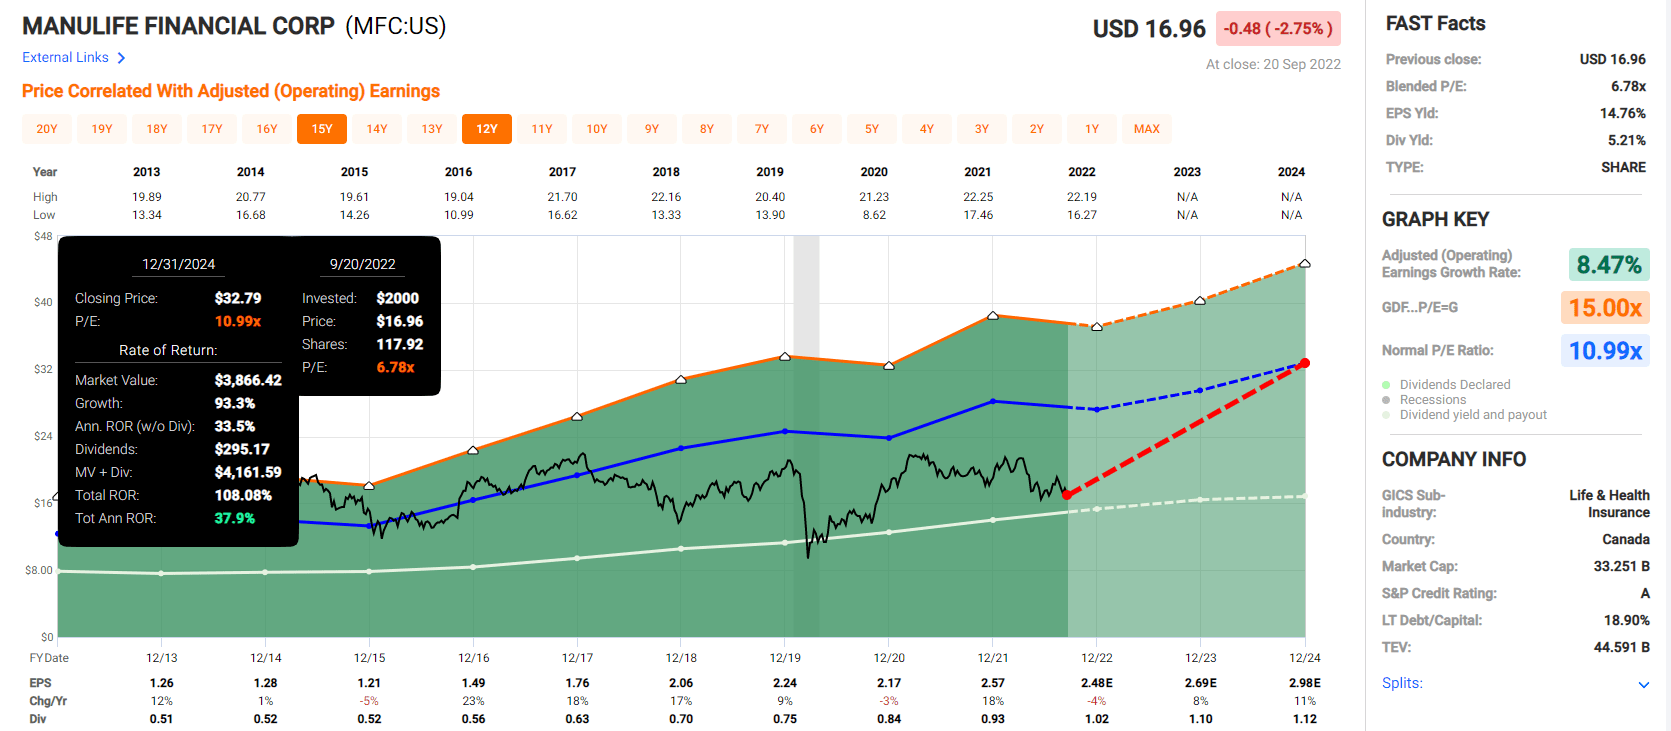
Pembina Pipeline 2024 Consensus Total Return Potential
(Source: FAST Graphs, FactSet)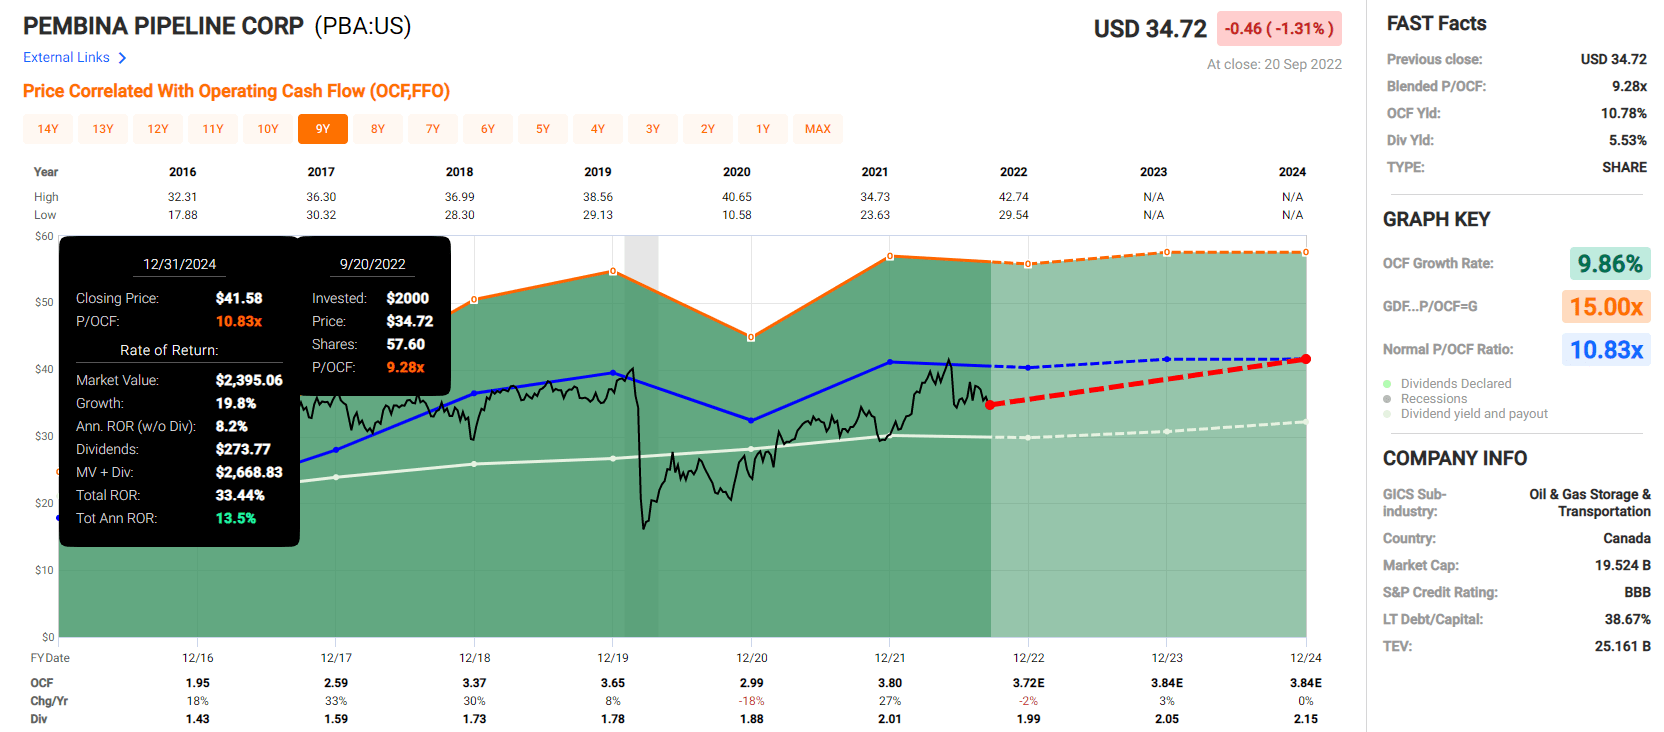
Canadian Imperial Bank 2024 Consensus Total Return Potential
(Source: FAST Graphs, FactSet)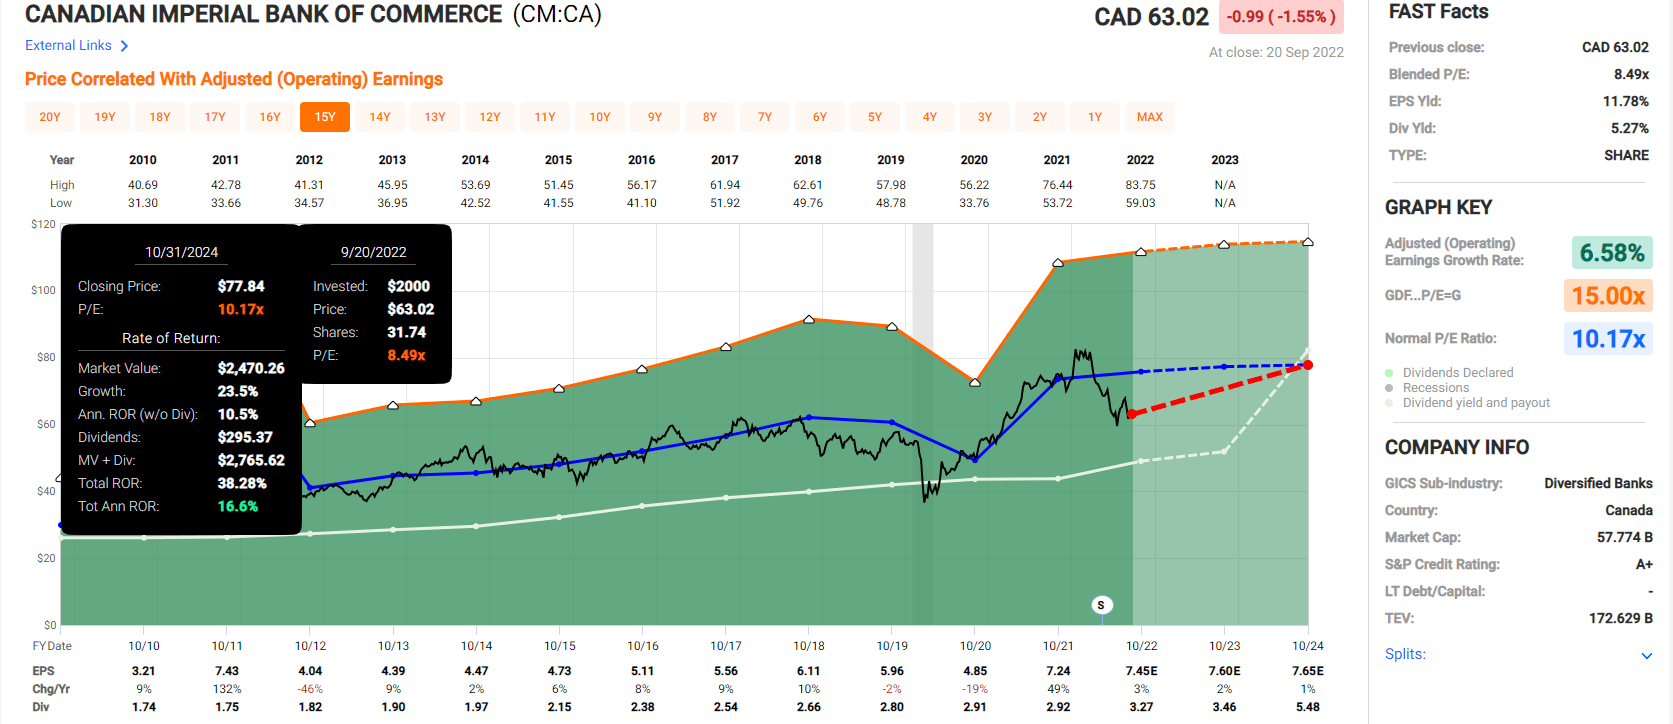
IBM 2024 Consensus Total Return Potential
(Source: FAST Graphs, FactSet)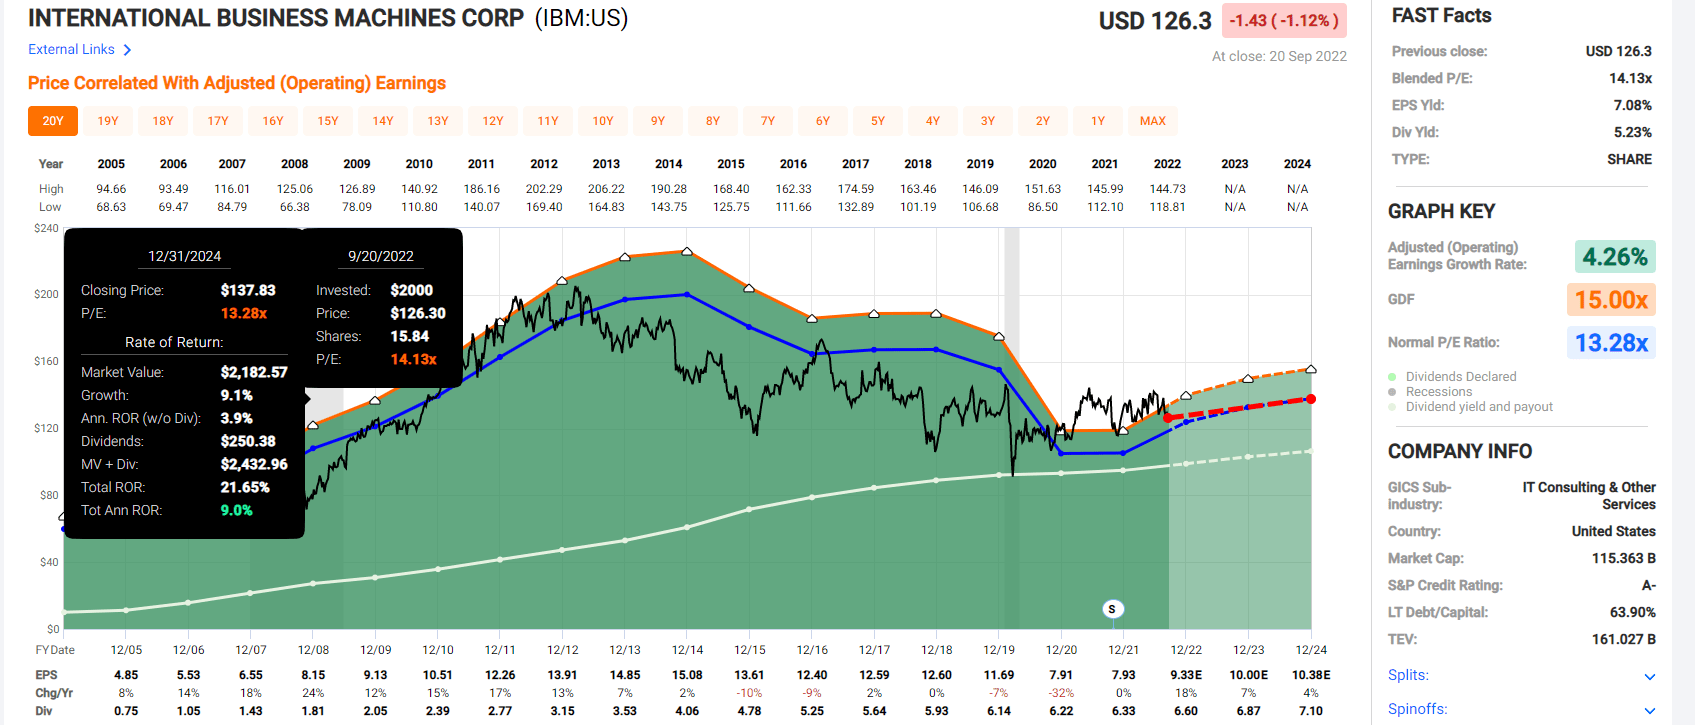
3M 2024 Consensus Total Return Potential
(Source: FAST Graphs, FactSet)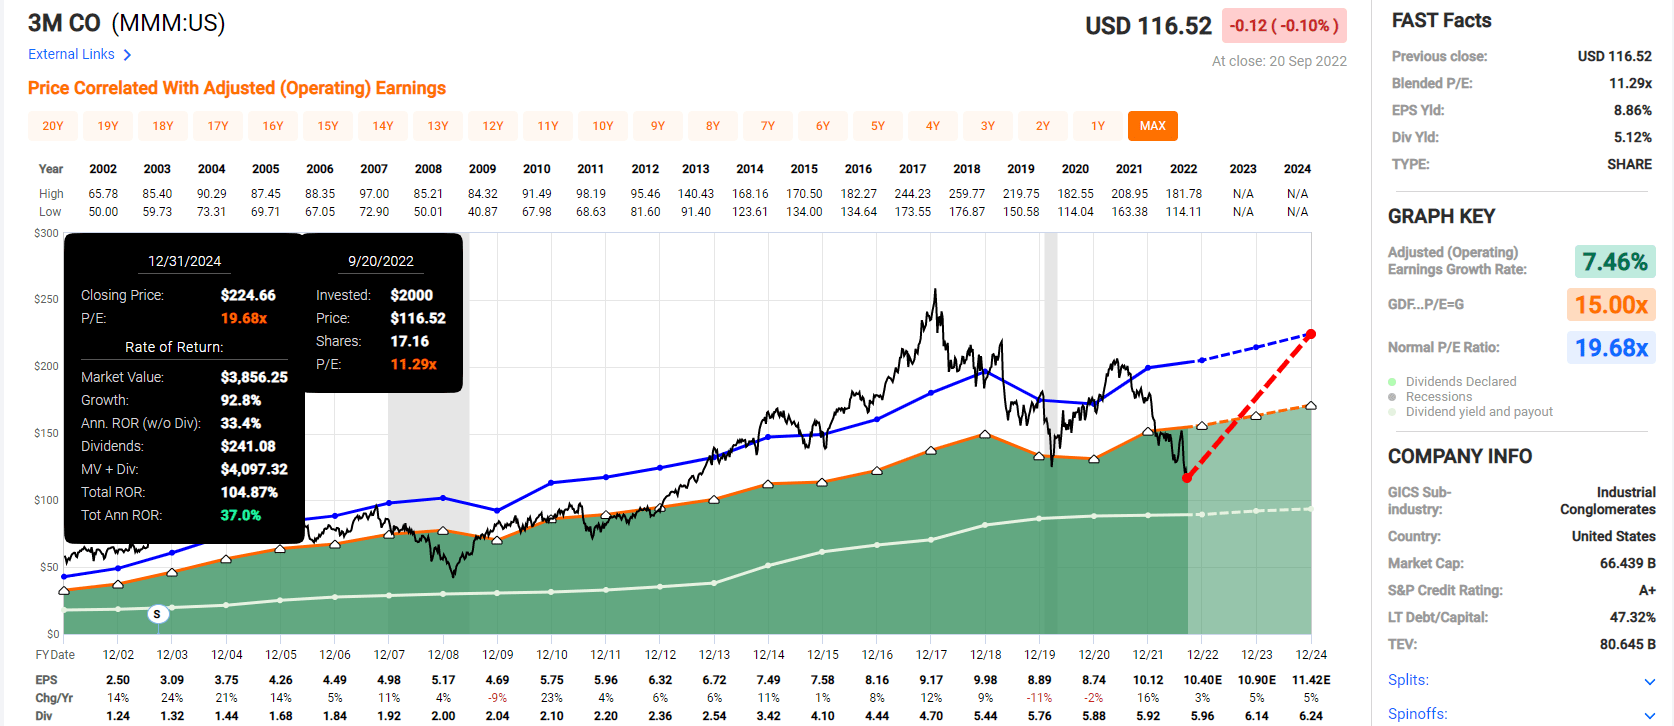
VF Corp 2024 Consensus Total Return Potential
(Source: FAST Graphs, FactSet)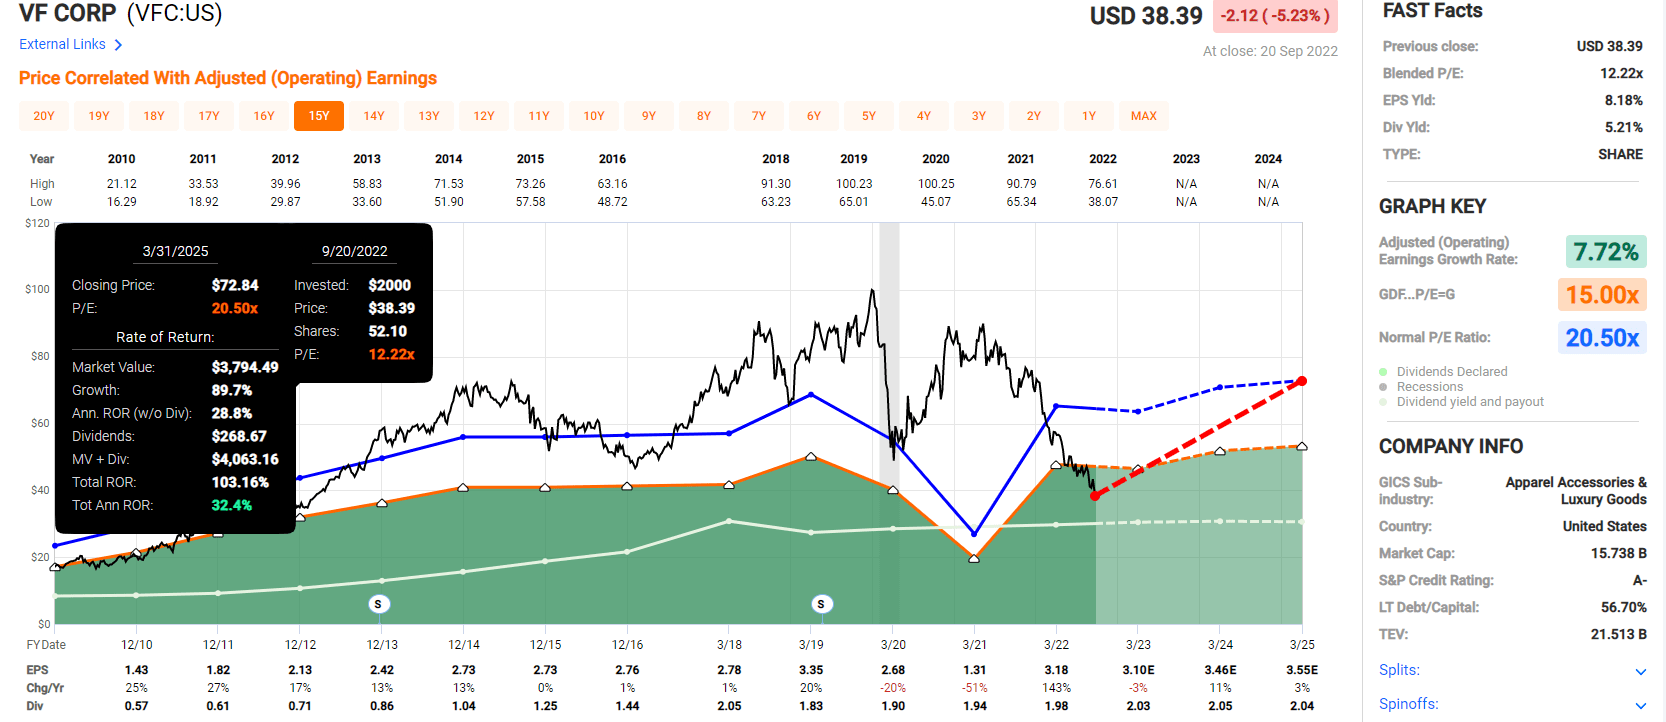
Sun Life Financial 2024 Consensus Total Return Potential
(Source: FAST Graphs, FactSet)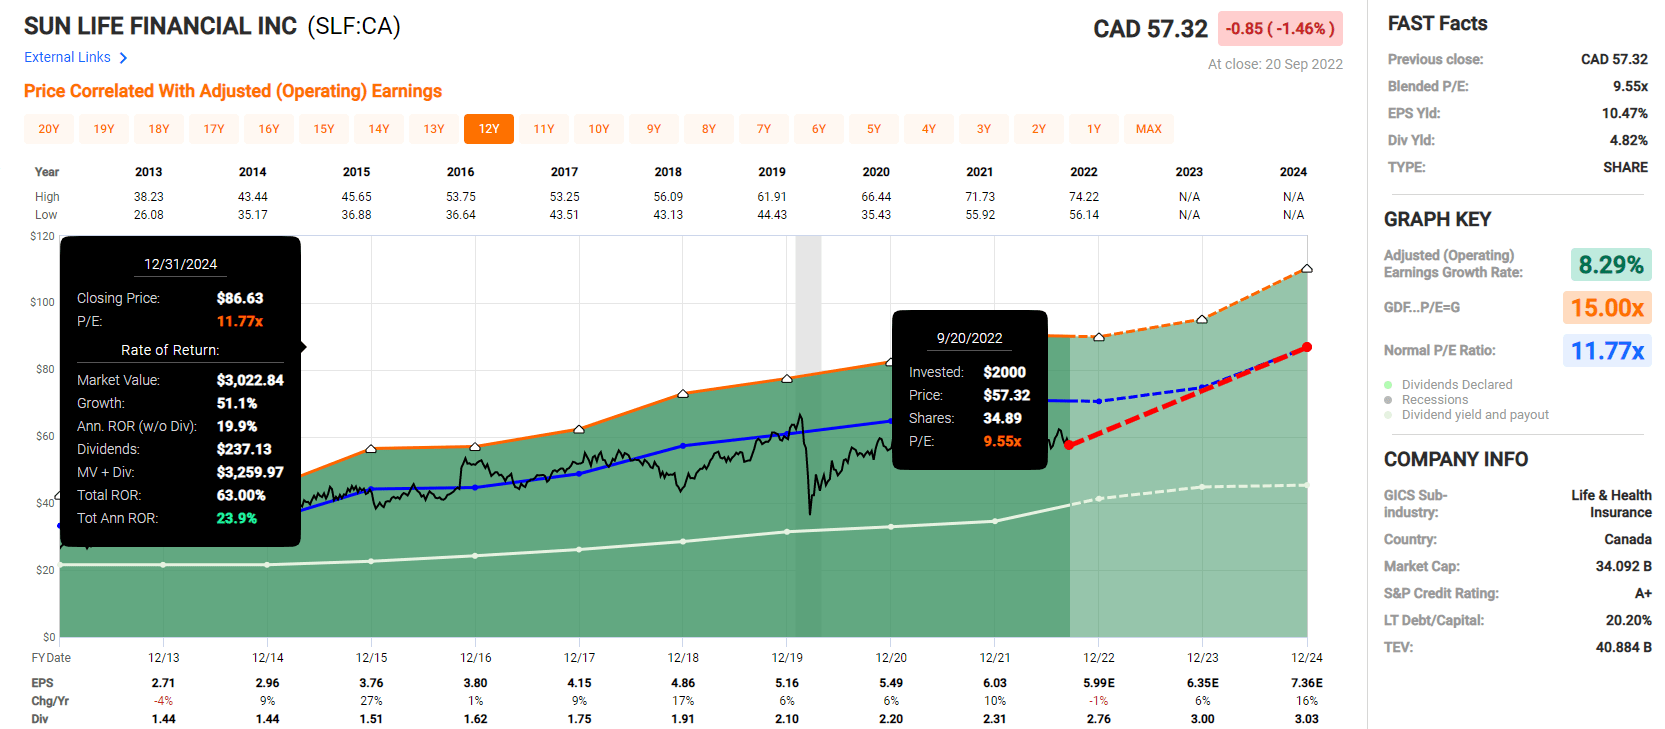
Telus 2024 Consensus Total Return Potential (Including Historical Dividend Yield Fair Value PE 20.8)
(Source: FAST Graphs, FactSet)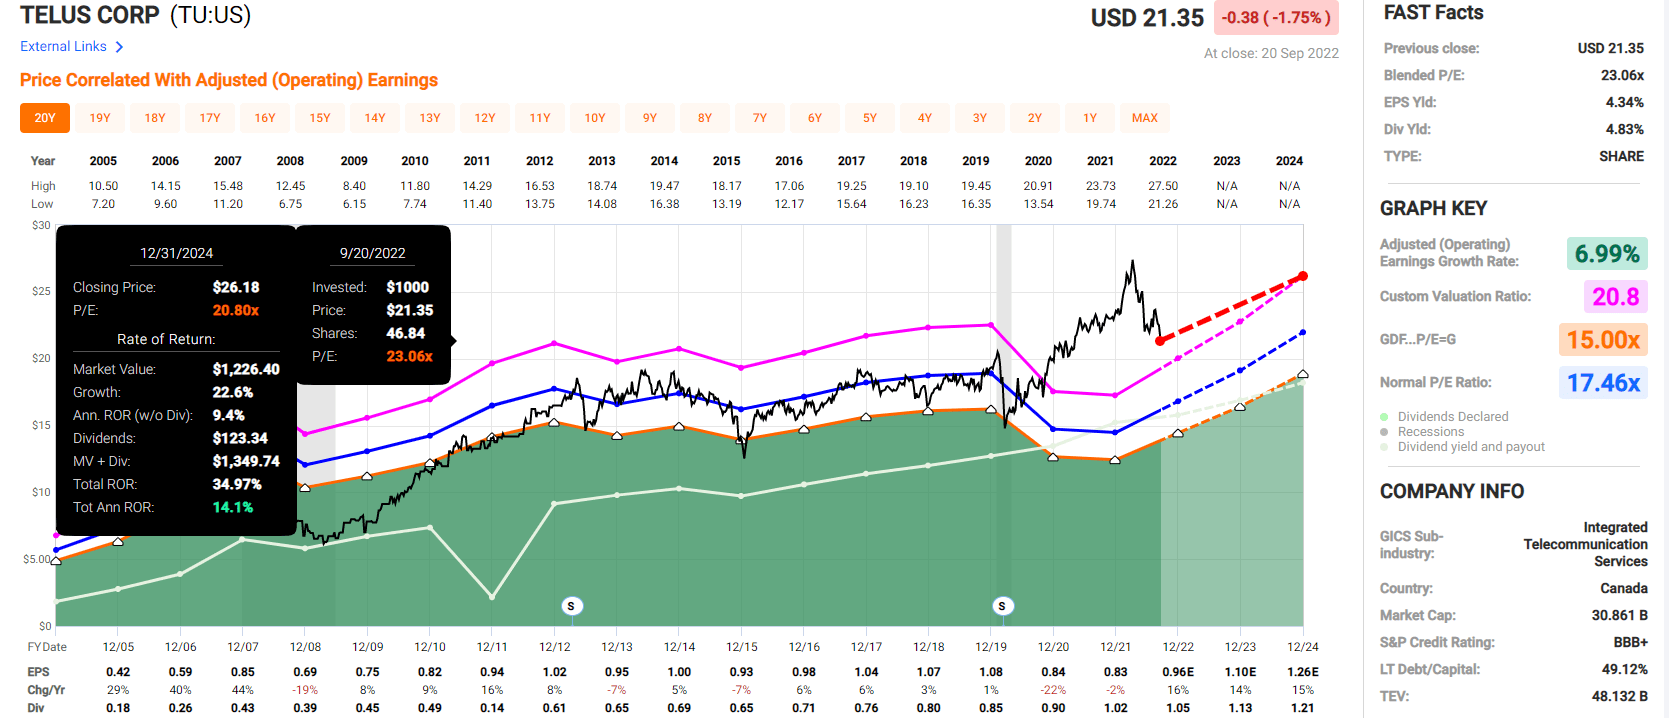
Now compare that to the S&P 500.
S&P 500 2024 Consensus Return Potential
(Source: FAST Graphs, FactSet)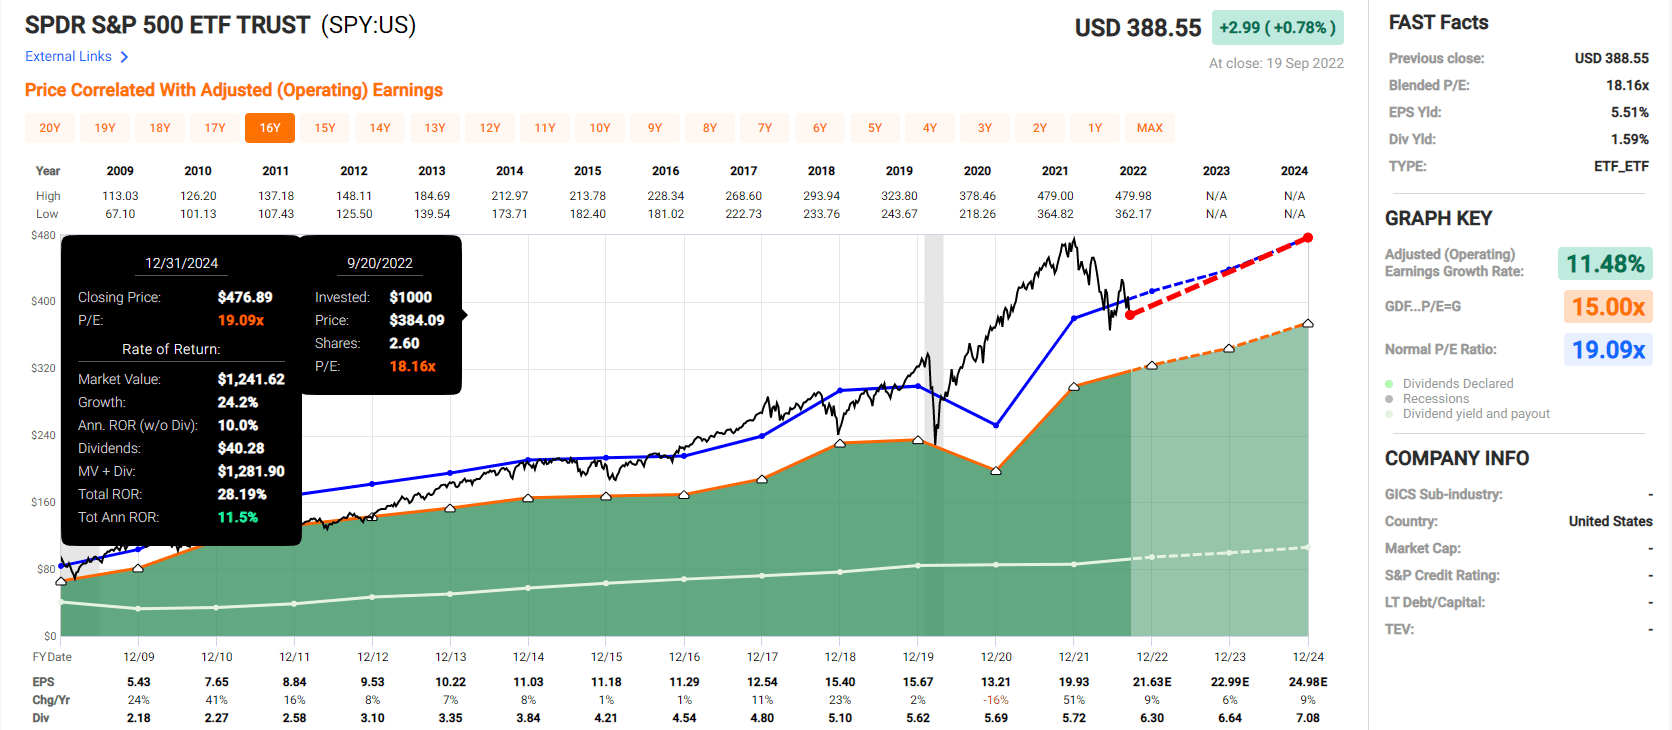
Analysts expect 12% annual returns from the S&P 500 through 2024.
These 17 ultra-yield blue-chips?
- 23% CAGR through 2024
- 68% total return potential
- more than 2X the S&P 500 consensus.
But my goal isn’t to help you make a quick 70%. I want to help you achieve financial freedom and retire in safety and splendor.
And here’s how these ultra-yield blue chips can do that.
The World’s Highest Quality Ultra-Yield
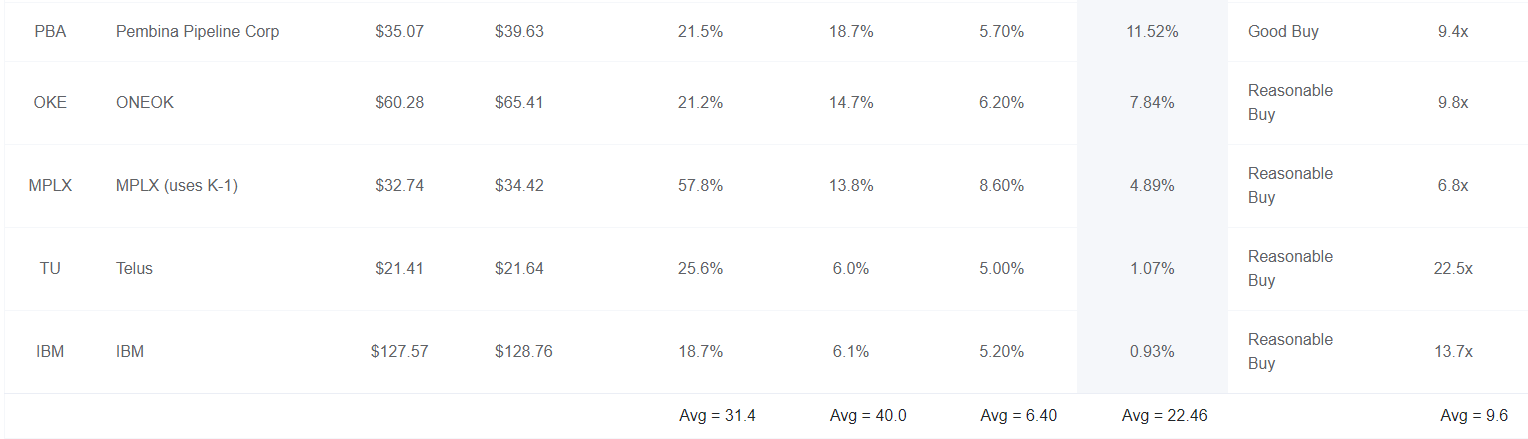
(Source: Dividend Kings Zen Research Terminal)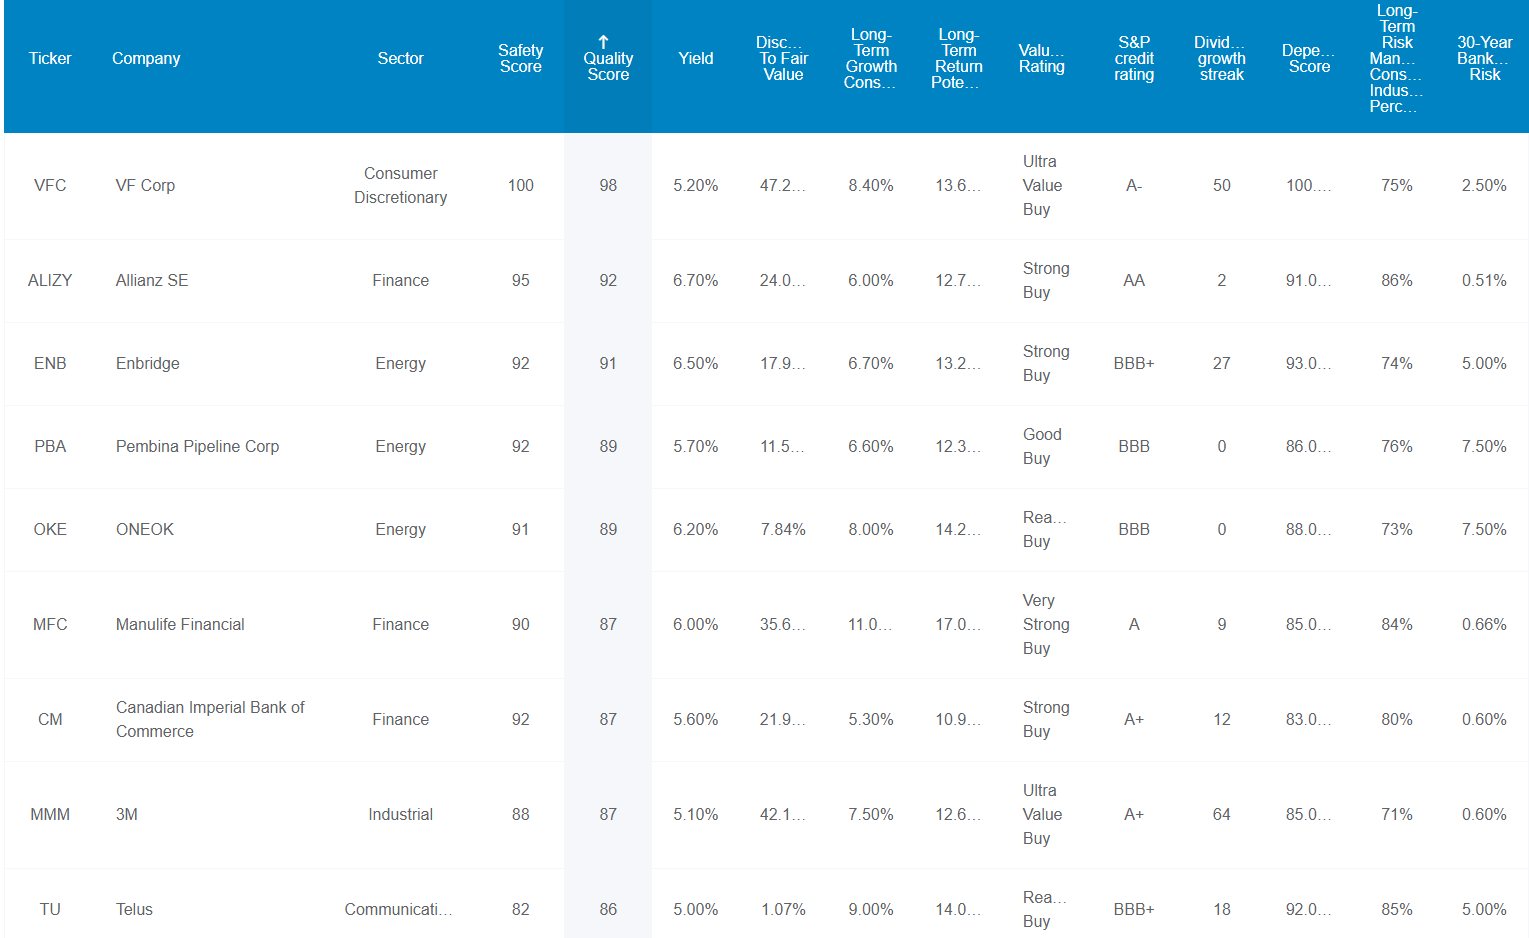
(Source: Dividend Kings Zen Research Terminal)
These aren’t just ultra-yield blue chips, they are ultra-yield Super SWANs, and we know this by comparing their safety and quality fundamentals to the dividend aristocrats, the bluest of blue chips.
Safety And Quality That Compares Well To The Dividend Aristocrats
| Metric | Dividend Aristocrats | 17 Ultra-Yield Blue Chips |
Compared To Aristocrats |
| Quality | 87% | 87% | 100% |
| Safety | 90% | 89% | 99% |
| Average Recession Dividend Cut Risk | 0.5% | 0.5% | 100% |
| Severe Recession Dividend Cut Risk | 1.50% | 1.55% | 103% |
| Dependability | 84% | 85% | 101% |
| Dividend Growth Streak (Years) | 44.8 | 20.4 | 46% |
| Long-Term Risk Management Industry Percentile | 67%, Above-Average, Low Risk | 73% Good, Low Risk | 109% |
| Average Credit Rating | A- Stable | BBB+ Stable | NA |
| Average Bankruptcy Risk | 3.04% | 4.35% | 143% |
| Average Return On Capital | 105% | 130% | 124% |
| Average ROC Industry Percentile | 83% | 79% | 95% |
| 13-Year Median ROC | 89% | 142% | 160% |
| Forward PE | 19.2 | 9.6 | 50% |
| Discount To Fair Value | 6% | 23% | 417% |
| DK Rating | Reasonable Buy | Strong Buy | NA |
| Yield | 2.6% | 6.4% | 247% |
| LT Growth Consensus | 8.6% | 7.1% | 82% |
| Total Return Potential | 11.2% | 13.5% | 120% |
| Risk-Adjusted Expected Return | 7.6% | 9.0% | 118% |
| Inflation & Risk-Adjusted Expected Return | 5.4% | 6.8% | 126% |
| Conservative Years To Double | 13.3 | 10.6 | 79% |
| Average | 127% |
(Source: Dividend Kings Zen Research Terminal)
In fact, these ultra-yield Super SWANs are slightly better than the dividend aristocrats when we consider valuation and return potential.
Ben Graham considered 20 years without a dividend cut an important sign of quality and 20+ year dividend growth streaks a sign of excellence.
The aristocrats, with an average streak of 44 years, certainly meet this requirement, but these ultra-yielders average a 20-year dividend growth streak.
- every year since 2002
- through the Great Recession, Pandemic, and five bear markets.
Joel Greenblatt is one of the greatest investors in history.
- 40% CAGR returns for 21 years
- using Return on capital as a proxy for quality and moatiness
- and valuation.
Return on capital is annual pre-tax profit/the cost of running the business.
The aristocrats average 105% ROC, or 7X more than the S&P 500.
These ultra-yielders average 130% ROC, 9X more than the S&P 500.
According to Greenblatt, these companies are 9X higher quality than the average S&P 500 company and 26% higher quality than the dividend aristocrats.
Their 13-year median ROC is 142%, and their ROC is in the 79th industry percentile.
S&P estimates their average 30-year bankruptcy risk (a proxy for Buffett’s fundamental risk) at 4.35%, an average credit rating of BBB+.
Six risk rating agencies consider their long-term risk management to be in the 73rd percentile.
- factoring in all risk factors (over 1,000 in total)
- including supply chain management, brand integrity, labor relations, balance sheet management, and even long-term climate change mitigation plans
Ultra-Yielder’s Long-Term Risk Management Is The 133rd Best In The Master List (73rd Percentile)
| Classification | Average Consensus LT Risk-Management Industry Percentile |
Risk-Management Rating |
| S&P Global (SPGI) #1 Risk Management In The Master List | 94 | Exceptional |
| Strong ESG Stocks | 78 |
Good – Bordering On Very Good |
| Foreign Dividend Stocks | 75 | Good |
| 17 Ultra-Yield Blue Chips | 73 | Good |
| Ultra SWANs | 71 | Good |
| Low Volatility Stocks | 68 | Above-Average |
| Dividend Aristocrats | 67 | Above-Average |
| Dividend Kings | 63 | Above-Average |
| Master List average | 62 | Above-Average |
| Hyper-Growth stocks | 61 | Above-Average |
| Monthly Dividend Stocks | 60 | Above-Average |
| Dividend Champions | 57 | Average bordering on above-average |
(Source: DK Research Terminal)
Their risk-management consensus is in the top 27% of the world’s highest quality companies and similar to that of such other blue-chips as
- Johnson & Johnson (JNJ): Ultra SWAN dividend king
- McCormick (MKC): Ultra SWAN dividend aristocrat
- T. Rowe Price (TROW): Ultra SWAN dividend aristocrat
- Novo Nordisk (NVO): Ultra SWAN global aristocrat
- Home Depot (HD): Ultra SWAN
The bottom line is that all companies have risks, and these Ultra-yield Super SWANs are very good at managing theirs.
How We Monitor These Ultra-Yield Blue Chip Risk Profiles
- 298 analysts
- 5 credit rating agencies
- 12 total risk rating agencies
- 55 experts who collectively know this business better than anyone other than management
- and the bond market for real-time fundamental risk assessment
When the facts change, I change my mind. What do you do, sir?” – John Maynard Keynes
There are no sacred cows at iREIT or Dividend Kings. Wherever the fundamentals lead, we always follow. That’s the essence of disciplined financial science, the math behind retiring rich and staying rich in retirement.
OK, so now that you know why these are some of the world’s safest and highest quality ultra-yield Super SWANs, here’s why you might want to buy some or all of them today.
Wonderful Companies At Wonderful Prices
(Source: Dividend Kings Zen Research Terminal) (Source: Dividend Kings Zen Research Terminal)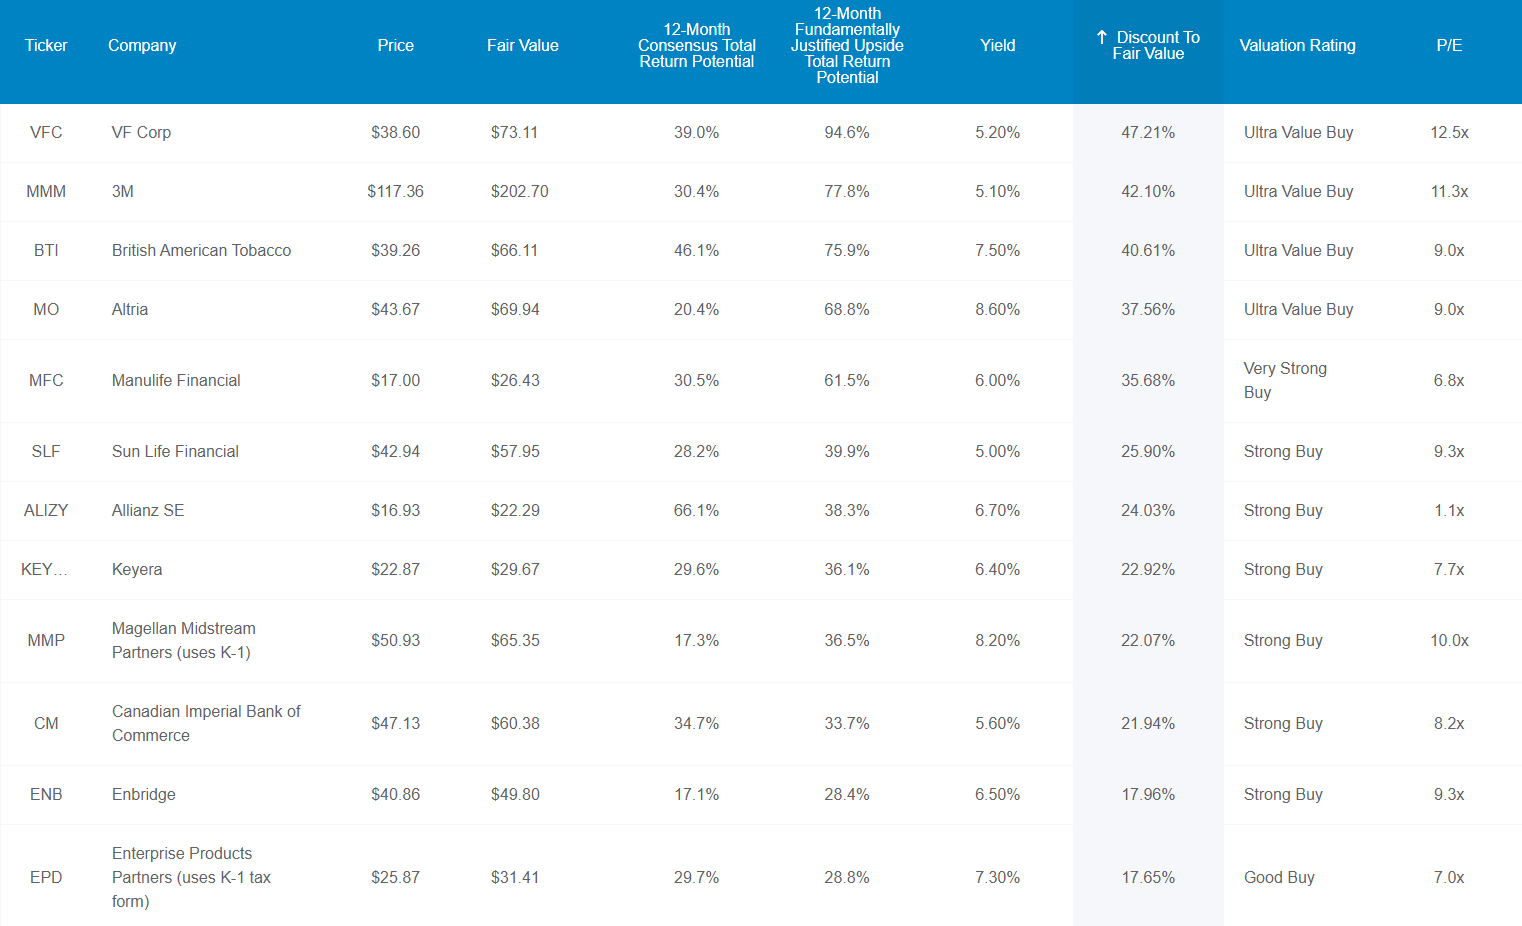
For context, the S&P 500 trades at 16.0X forward earnings, a 5% historical discount.
The dividend aristocrats trade at 19.2X earnings, a 6% historical discount.
These ultra-yield Super SWANs trade at just 9.6X earnings, a level not seen in the S&P 500 since the early 1980s.
- 10.3X was the bottom in March 2009
These Ultra-yield blue chips are trading at valuations the S&P 500 hasn’t seen in four decades and likely never will again.
That’s why analysts think they will deliver 31% total returns in the next year. But their 23% discount to fair value, which makes this a strong buy stock bucket, means that their fundamentally justified total return potential is 40%.
- if they each grow as expected and return to mid-range market-determined historical fair value you will make 40% in the next year
But my goal isn’t to help you make 31% or 40% in 12 months or even 70% in a few years. I want to help you achieve potentially 45X returns over the next 30 years to retire safely and in splendor.
So here’s how these Ultra-yielders can do that.
Ultra-Yield Today And A Rich Retirement Tomorrow
(Source: Dividend Kings Zen Research Terminal) (Source: Dividend Kings Zen Research Terminal)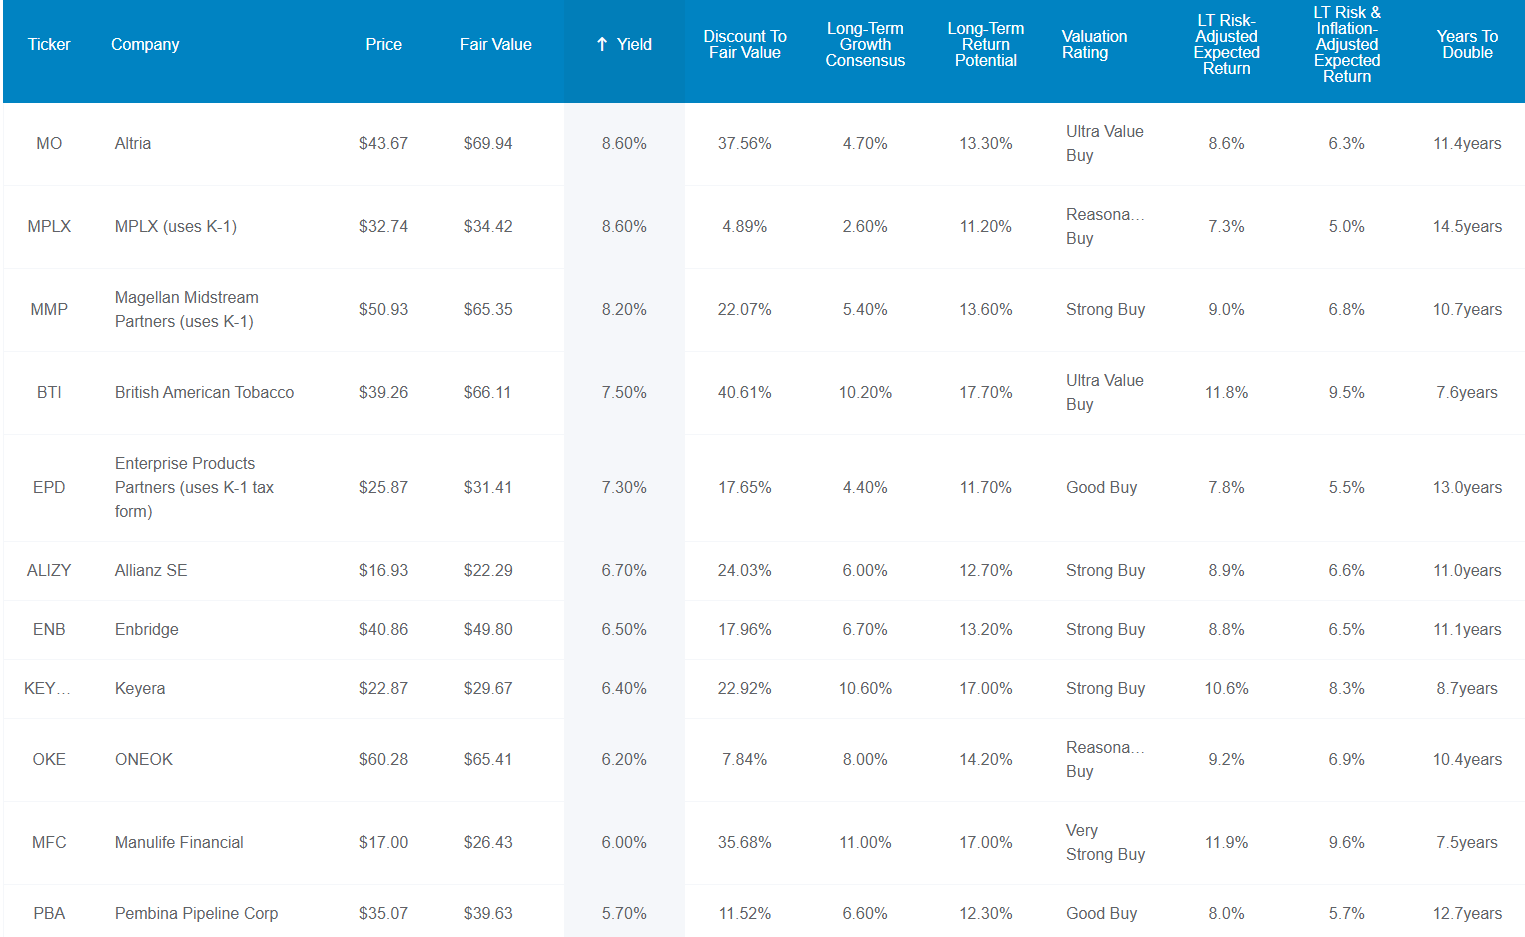
These ultra-yield Super SWANs offer not just one of the safest 6.4% yields in the world, but they are growing at 7.1% annually and offering 13.5% CAGR long-term return potential.
| Investment Strategy | Yield | LT Consensus Growth | LT Consensus Total Return Potential | Long-Term Risk-Adjusted Expected Return | Long-Term Inflation And Risk-Adjusted Expected Returns | Years To Double Your Inflation & Risk-Adjusted Wealth |
10-Year Inflation And Risk-Adjusted Expected Return |
| 17 Ultra-Yield Blue Chips | 6.4% | 7.1% | 13.5% | 9.5% | 7.2% | 10.1 | 2.00 |
| High-Yield (SCHD) | 3.4% | 8.7% | 12.1% | 8.5% | 6.2% | 11.7 | 1.82 |
| Dividend Aristocrats | 2.6% | 8.6% | 11.2% | 7.7% | 5.4% | 13.4 | 1.69 |
| S&P 500 | 1.7% | 8.5% | 10.2% | 7.1% | 4.9% | 14.8 | 1.61 |
| Nasdaq | 0.9% | 11.8% | 12.7% | 8.9% | 6.6% | 10.9 | 1.89 |
(Sources: DK Research Terminal, FactSet, Morningstar, Ycharts)
Analysts think these ultra-yielders can deliver higher returns in the future than the S&P 500, dividend aristocrats, SCHD (the gold standard high-yield blue-chip ETF), and even the Nasdaq.
Inflation-Adjusted Consensus Total Return Potential: $1,000 Initial Investment
| Time Frame (Years) | 7.9% CAGR Inflation-Adjusted S&P 500 Consensus | 8.9% Inflation-Adjusted Dividend Aristocrat Consensus | 11.2% CAGR Inflation-Adjusted 17 Ultra-Yield Blue Chip Consensus | Difference Between Inflation-Adjusted 17 Ultra-Yield Blue Chip Consensus And S&P Consensus |
| 5 | $1,461.18 | $1,532.28 | $1,701.06 | $239.88 |
| 10 | $2,135.06 | $2,347.89 | $2,893.60 | $758.54 |
| 15 | $3,119.71 | $3,597.63 | $4,922.18 | $1,802.47 |
| 20 | $4,558.47 | $5,512.58 | $8,372.92 | $3,814.45 |
| 25 | $6,660.75 | $8,446.83 | $14,242.82 | $7,582.07 |
| 30 (retirement time frame) | $9,732.58 | $12,942.93 | $24,227.87 | $14,495.29 |
| 35 | $14,221.09 | $19,832.23 | $41,213.02 | $26,991.93 |
| 40 | $20,779.62 | $30,388.57 | $70,105.75 | $49,326.13 |
| 45 | $30,362.83 | $46,563.87 | $119,253.97 | $88,891.14 |
| 50 | $44,365.65 | $71,349.00 | $202,857.95 | $158,492.30 |
| 55 | $64,826.35 | $109,326.81 | $345,073.21 | $280,246.86 |
| 60 (investing lifetime) | $94,723.18 | $167,519.54 | $586,989.65 | $492,266.47 |
| 100 (institutional time frame, generational wealth) | $1,968,311.27 | $5,090,680.07 | $41,151,348.84 | $39,183,037.58 |
(Source: DK Research Terminal, FactSet)
Analysts currently think these ultra-yielders could potentially deliver 24X inflation-adjusted returns over the next 30 years, double that of the S&P 500.
Over an investing lifetime, they could potentially deliver nearly 600X returns.
| Time Frame (Years) | Ratio 17 Ultra-Yield Blue Chip Consensus/Aristocrat Consensus | Ratio Inflation And Inflation-Adjusted 17 Ultra-Yield Blue Chip vs. S&P consensus |
| 5 | 1.11 | 1.16 |
| 10 | 1.23 | 1.36 |
| 15 | 1.37 | 1.58 |
| 20 | 1.52 | 1.84 |
| 25 | 1.69 | 2.14 |
| 30 | 1.87 | 2.49 |
| 35 | 2.08 | 2.90 |
| 40 | 2.31 | 3.37 |
| 45 | 2.56 | 3.93 |
| 50 | 2.84 | 4.57 |
| 55 | 3.16 | 5.32 |
| 60 | 3.50 | 6.20 |
| 100 | 8.08 | 20.91 |
(Source: DK Research Terminal, FactSet)
How does a very safe 6.4% yield today and potentially life-changing wealth in the future sound? Too good to be true? Well, it’s not.
Historical Returns Since October 1999(Annual Rebalancing)
The future doesn’t repeat, but it often rhymes. – Mark Twain
In our case, “past performance is no guarantee of future results.”
Still, studies show that blue chips with relatively stable fundamentals offer predictable returns based on yield, growth, and valuation mean reversion over time.
Bank of America 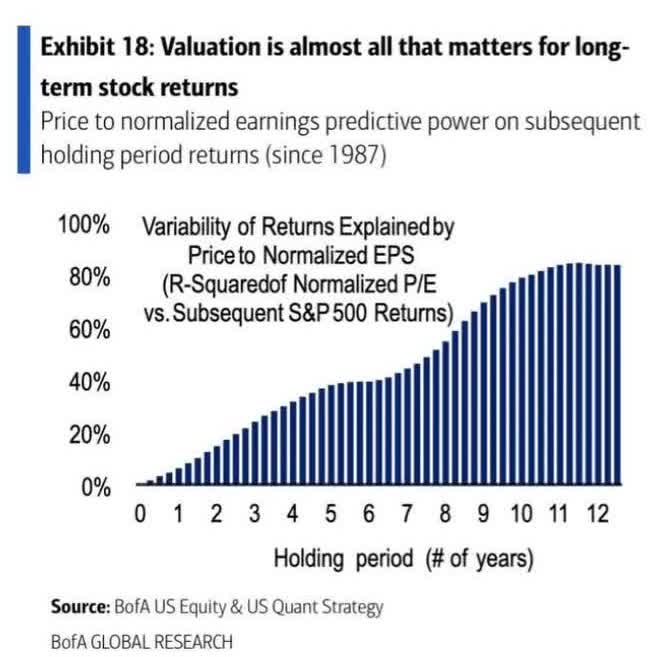
So let’s take at how these ultra-yielding blue chips performed over the last 23 years when 93% of total returns resulted from fundamentals and not luck.
(Source: Portfolio Visualizer Premium)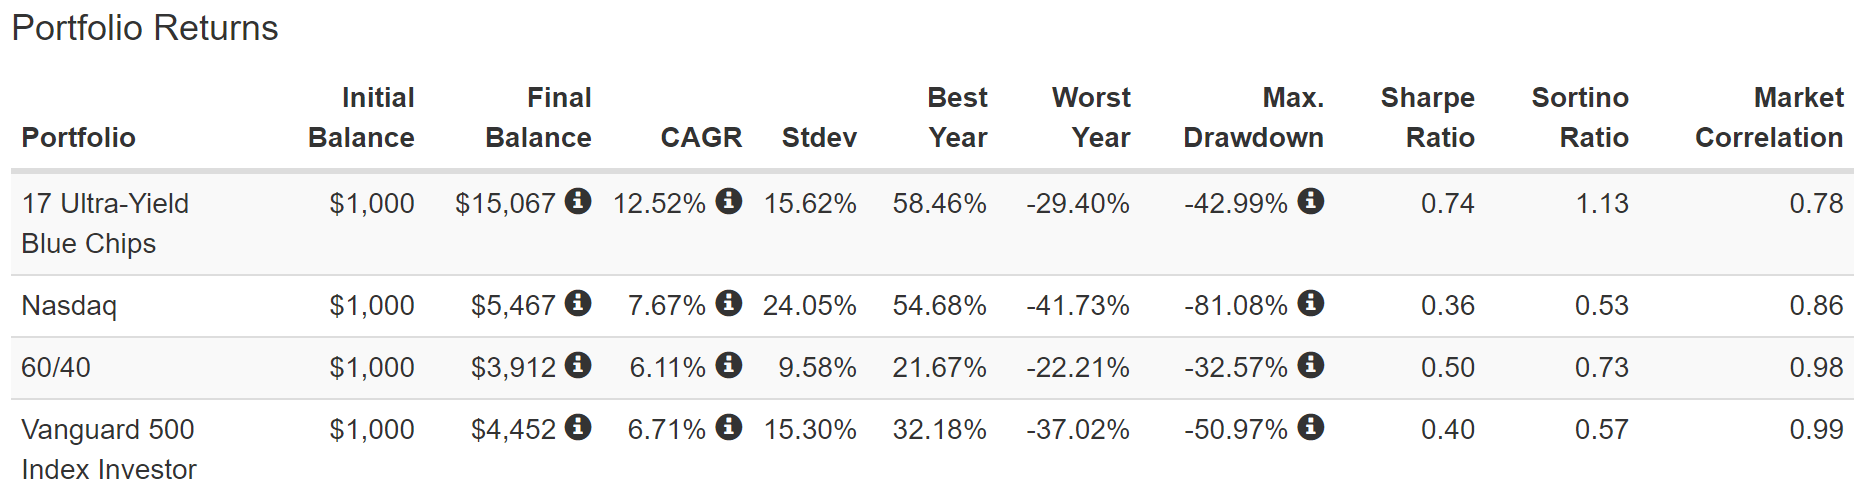
In the future analysts expect 13.5% CAGR returns which is similar to what these ultra-yielders have delivered for the last quarter century.
During this time they’ve doubled the returns of a 60/40, S&P 500, and even the Nasdaq.
And despite being heavily concentrated (66%) into energy and financials, they manage to fall less than the market in the Great Financial Crisis.
- 2X better negative-volatility adjusted total returns (Sortino ratio) than the S&P 500
- 55% better Sortino than the 60/40
- 2.1X better Sortino than the Nasdaq
(Source: Portfolio Visualizer Premium)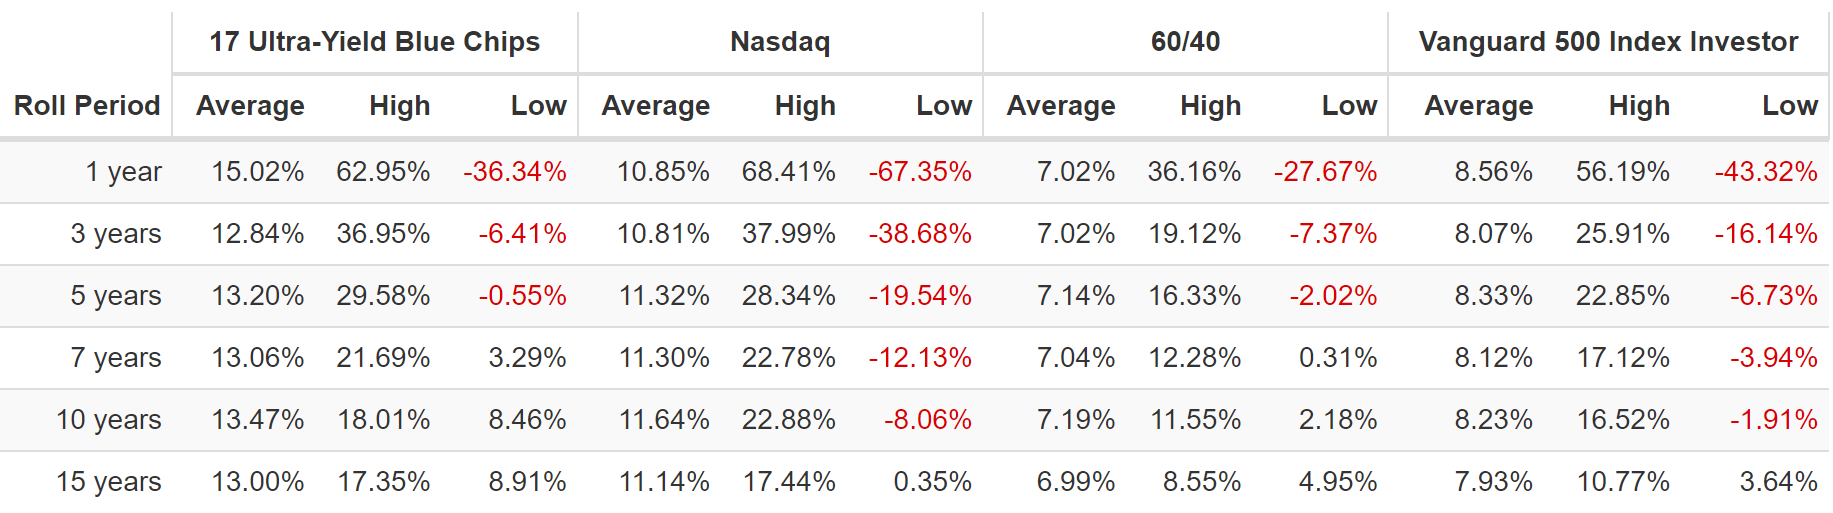
Look at that, very consistent 13% annual returns, just like analysts expect in the future, and far better than the S&P and Nasdaq.
Income Growth That Can Help You Retire In Safety And Splendor
DK Research Terminal, Portfolio Visualizer Premium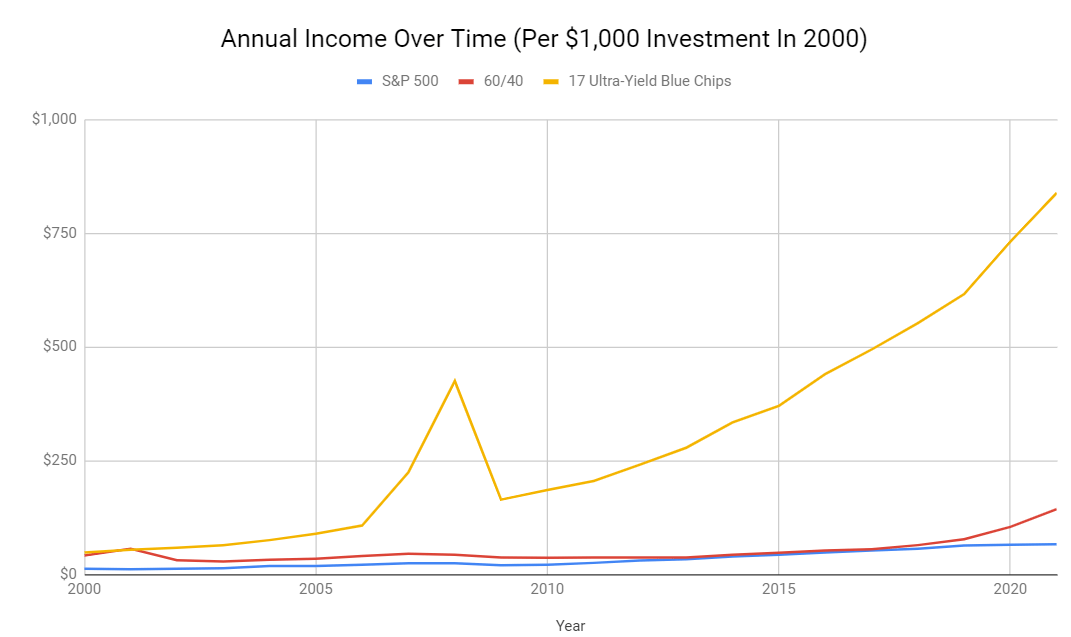
Want consistent and dependable income growth in all economic conditions? These ultra-yield Super SWANs offer just that.
- not counting MO’s spin-off spike, zero down years for income since 2000
Cumulative Dividends Since 2000: $1,000 Initial Investment
| Metric | S&P 500 | 60/40 | 17 Ultra-Yield Blue Chips |
| Total Dividends | $714 | $1,119 | $6,592 |
| Total Inflation-Adjusted Dividends | $408.00 | $639.43 | $3,766.86 |
| Annualized Income Growth Rate | 8.5% | 6.1% | 14.6% |
| Total Income/Initial Investment % | 0.71 | 1.12 | 6.59 |
| Inflation-Adjusted Income/Initial Investment % | 0.41 | 0.64 | 3.77 |
| More Inflation-Adjusted Income Than Altria | NA | 1.57 | 9.23 |
| Starting Yield | 1.2% | 4.1% | 4.8% |
| Today’s Annual Dividend Return On Your Starting Investment (Yield On Cost) | 6.6% | 14.3% | 83.8% |
| 2021 Inflation-Adjusted Annual Dividend Return On Your Starting Investment (Inflation-Adjusted Yield On Cost) | 3.8% | 8.2% | 47.9% |
(Source: Portfolio Visualizer Premium)
Over the last 21 years, these ultra-yielding blue-chips repaid investors their initial investment almost 4X over in inflation-adjusted dividends and delivered almost 15% annual income growth.
The yield of 4.8% in 2000 (much lower than it is now) has grown to an inflation-adjusted yield on cost of 48%.
DK Research Terminal, Portfolio Visualizer Premium DK Research Terminal, Portfolio Visualizer Premium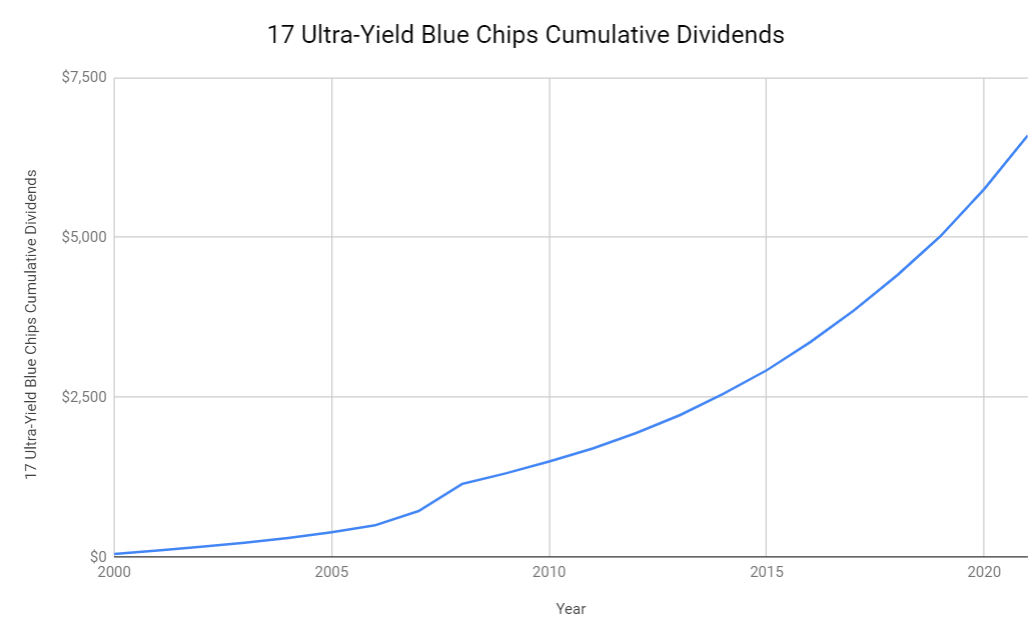

Behold the power of blue-chip dividend compounding over decades.
How To Turn These Blue Chips Into An Ultra SWAN Retirement Portfolio
Portfolio Visualizer Premium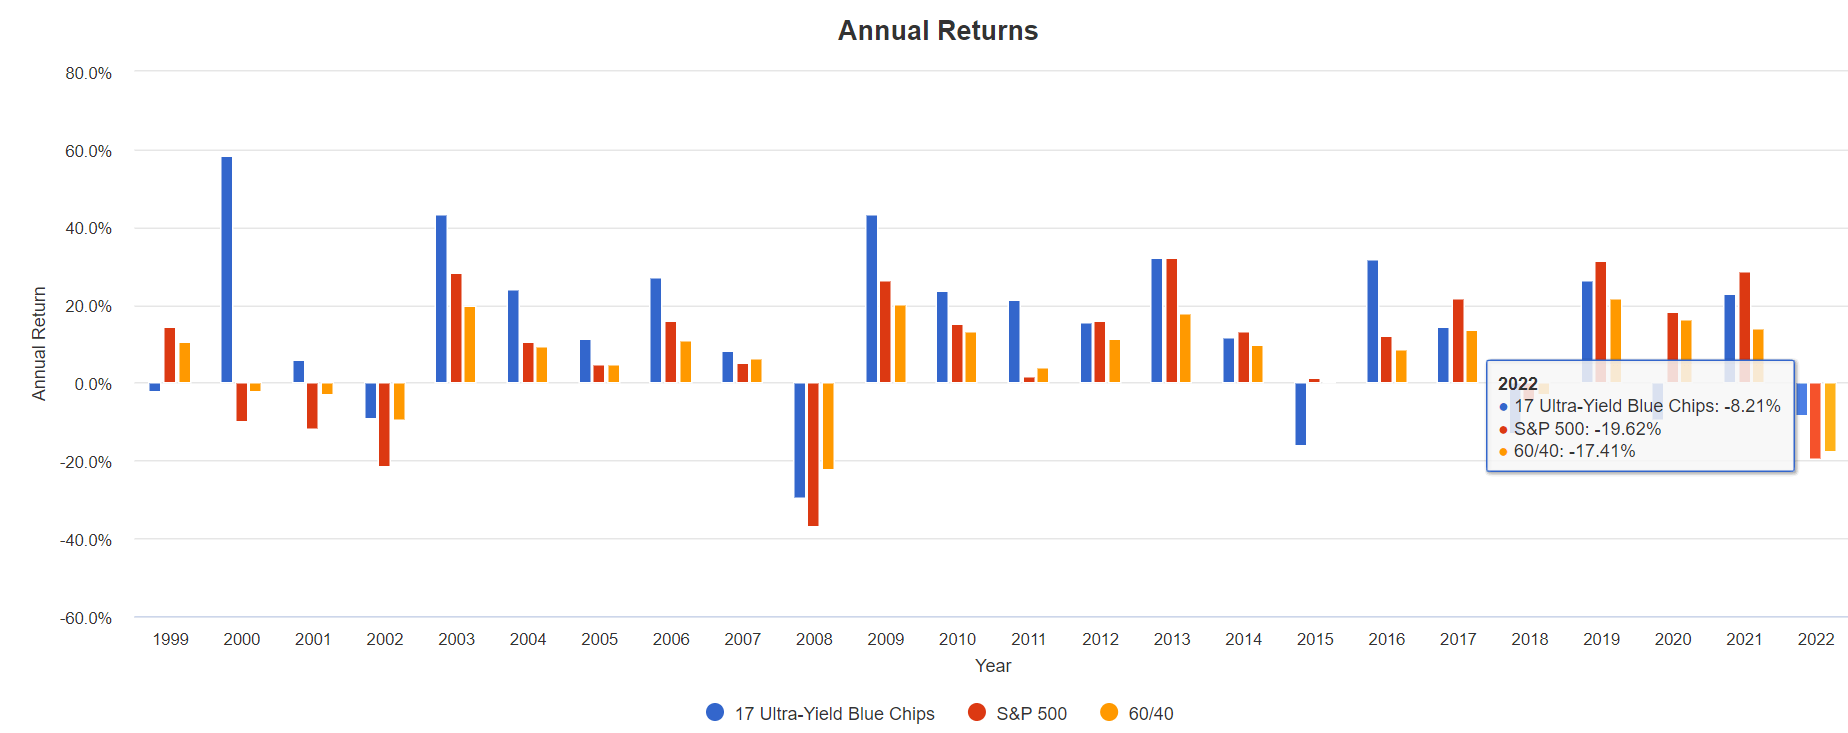
This year these Ultra-yielders are down just 8%, 40% as much as the S&P 500.
But they do at times experience severe declines, as you’d expect from a portfolio that’s 66% energy and financials.
Portfolio Visualizer Premium
While these ultra-yielders did well in the tech crash and Great Recession, -$38 oil crushed resulted in a 33% decline in the Pandemic.
Super SWAN doesn’t mean “can’t fall hard in a bear market.”
Fundamentals are all that determine safety and quality, and my recommendations.
- over 30+ years, 97% of stock returns are a function of pure fundamentals, not luck
- in the short-term; luck is 33X as powerful as fundamentals
- in the long-term, fundamentals are 33X as powerful as luck
Portfolio Visualizer Premium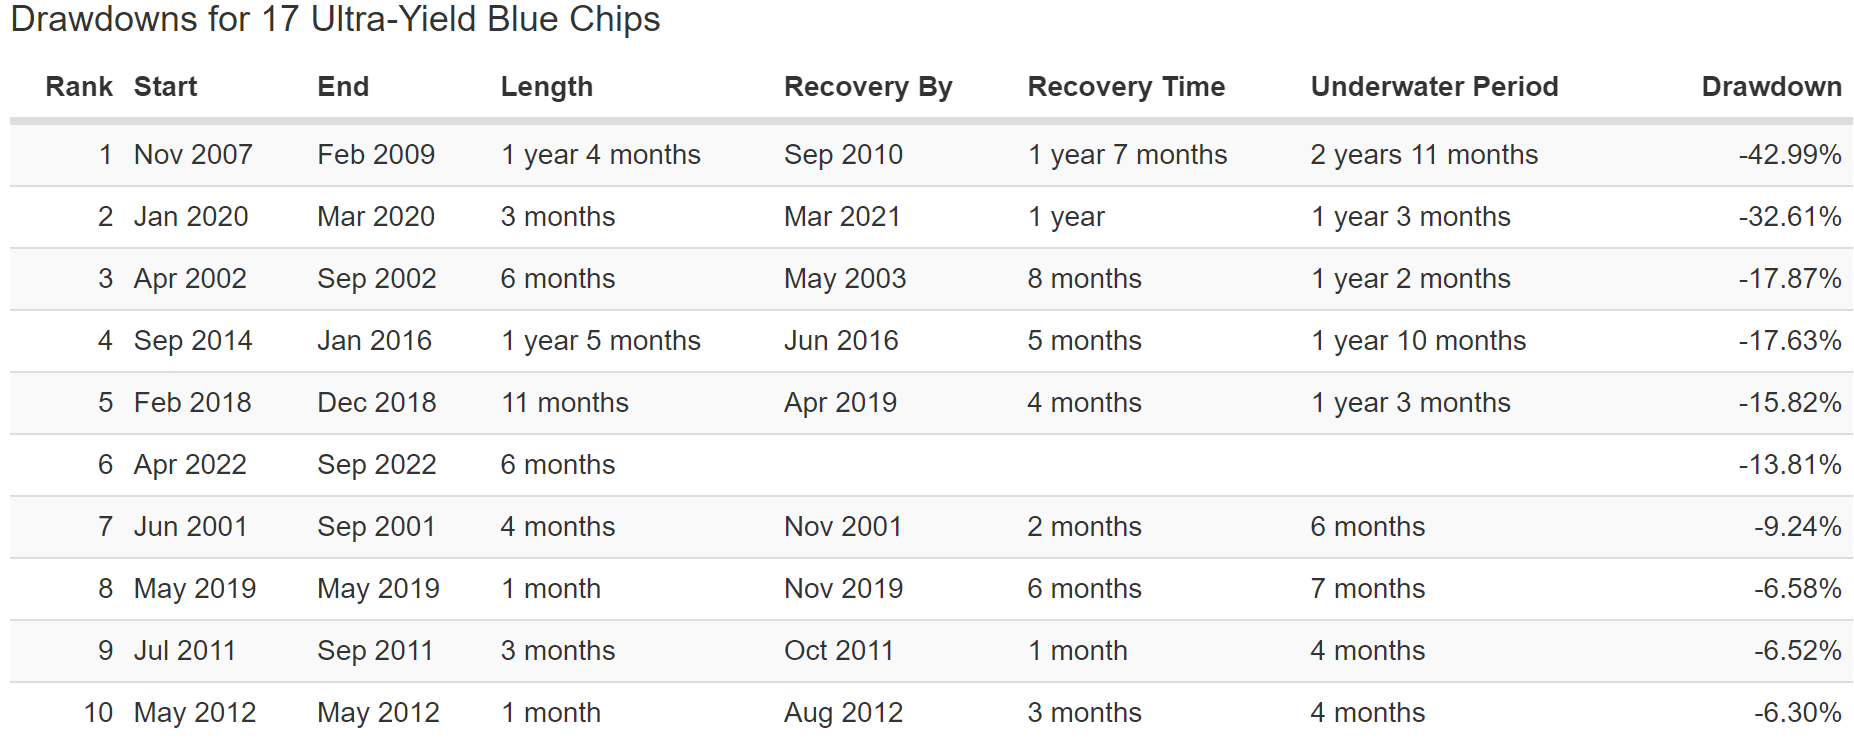
They are down a peak of 14% in the 2022 bear market so far.
- Nasdaq -32%
- S&P -24%
- 60/40 -17%
But most investors aren’t comfortable owning 66% energy and financials so here’s how to turn these ultra-yielders into a true Ultra SWAN retirement portfolio.
The ZEUS Ultra-Yield Blue Chip Portfolio
The ZEUS (Zen Extraordinary Ultra SWAN) strategy is explained in this article.
- How I Built A $3 Million High-Yield Portfolio With 11 Blue-Chips
But it consists of 3 buckets.
- 33% hedging bucket (EDV and managed futures hedge fund AMFAX)
- 33% ETF bucket, VYM (a gold standard of high-yield blue chip ETFs)
- 33% blue-chip bucket, these 17 ultra-yielding Super SWANs (2% each)
Now you take that 66% energy and financials down to 22%, with energy the largest sector allocation at 14%.
ZEUS Ultra-Yield Blue Chip Portfolio
| Metric | 60/40 | ZEUS Ultra Blue Chip Yield | X Better Than 60/40 |
| Yield | 2.2% | 6.5% | 3.01 |
| Growth Consensus | 5.1% | 4.1% | 0.80 |
| LT Consensus Total Return Potential | 7.3% | 10.6% | 1.46 |
| Risk-Adjusted Expected Return | 5.1% | 7.4% | 1.46 |
| Safe Withdrawal Rate (Risk And Inflation-Adjusted Expected Returns) | 2.8% | 5.1% | 1.84 |
| Conservative Time To Double (Years) | 25.8 | 14.0 | 1.84 |
(Source: Portfolio Visualizer Premium)
3X the yield of a 60/40, 50% higher returns, and almost 2X the safe withdrawal rate.
Total Returns Since August 2010 (Annual Rebalancing)
(Source: Portfolio Visualizer Premium)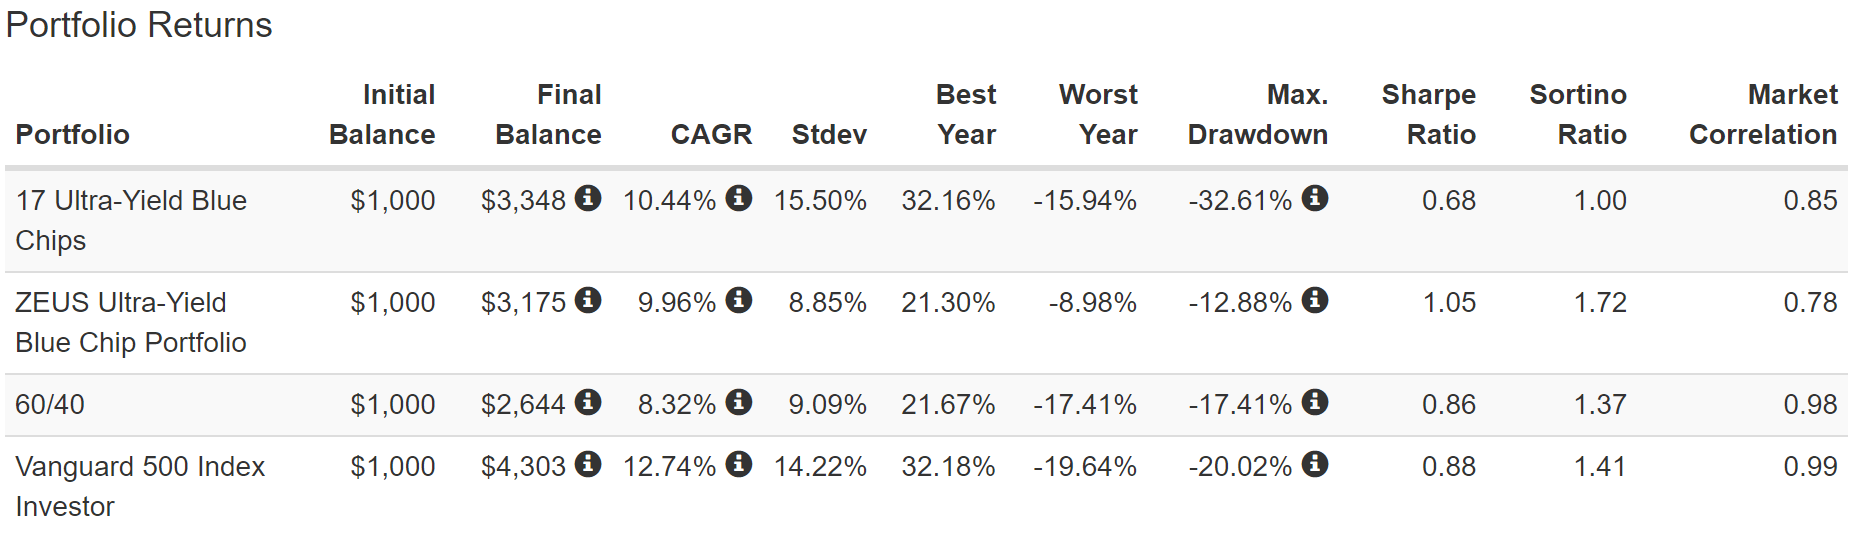
10% annual returns similar to what analysts expect in the future. But with less than 9% annual volatility (less than a 60/40).
And a peak decline of 13% and 26% better negative-volatility-adjusted total returns than a 60/40.
In fact, on a negative-volatility-adjusted basis, ZEUS Ultra-Yield Blue Chip beat the S&P 500.
(Source: Portfolio Visualizer Premium)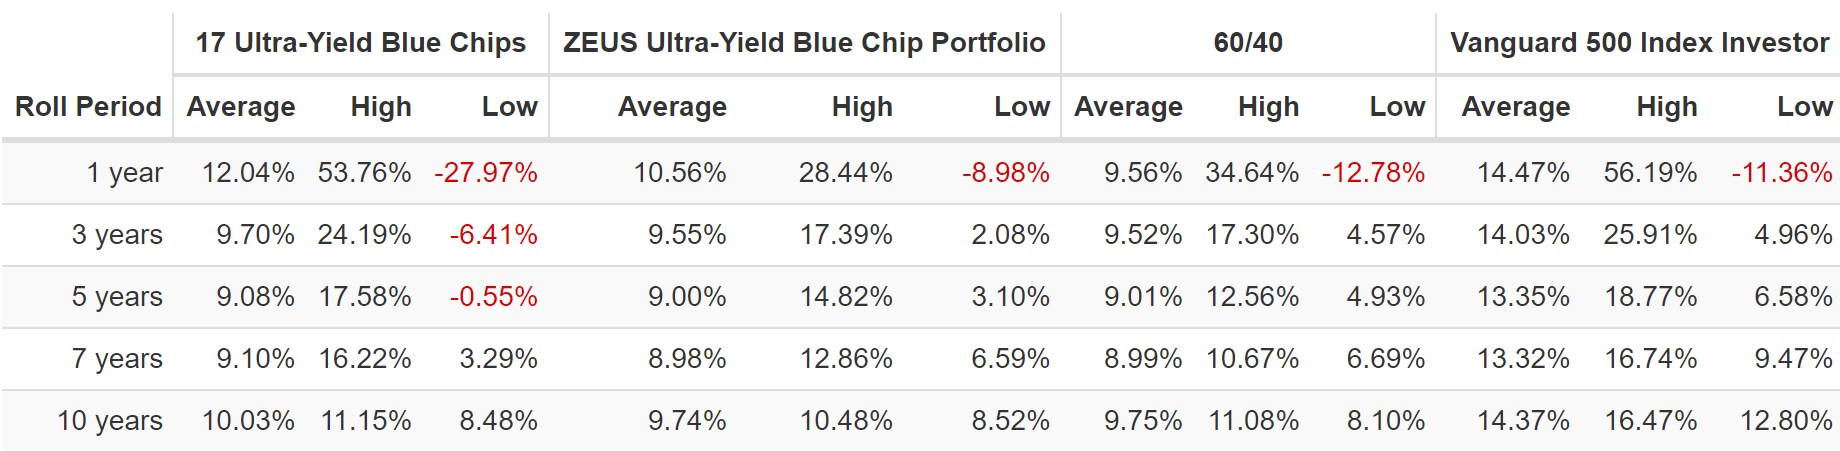
Thanks to multi-year bear markets for most of these ultra-yielders the average rolling returns since 2010 have been more modest 9% to 10% over the last 12 years.
But thanks to diversification and prudent asset allocation, ZEUS Ultra-Yield delivered similar returns but with a much smoother ride.
(Source: Portfolio Visualizer Premium)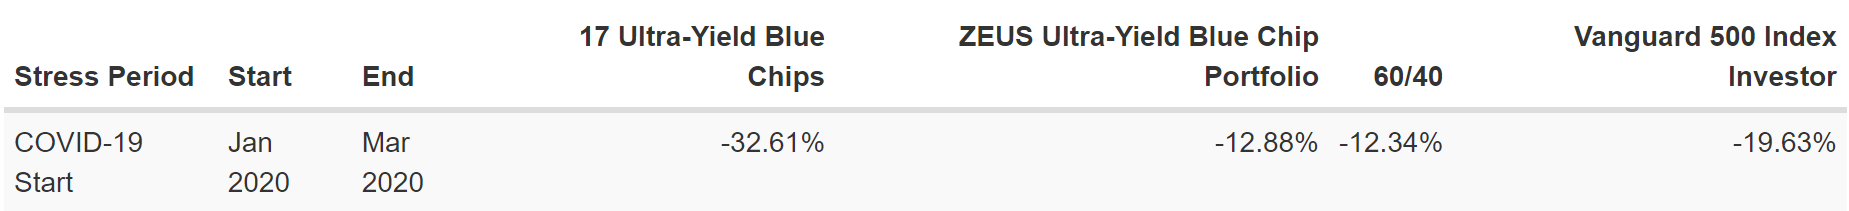
Thanks to prudent hedging and diversification, the 33% decline in the Pandemic dropped to 13%, 66% smaller, and matching a 60/40’s.
(Source: Portfolio Visualizer Premium)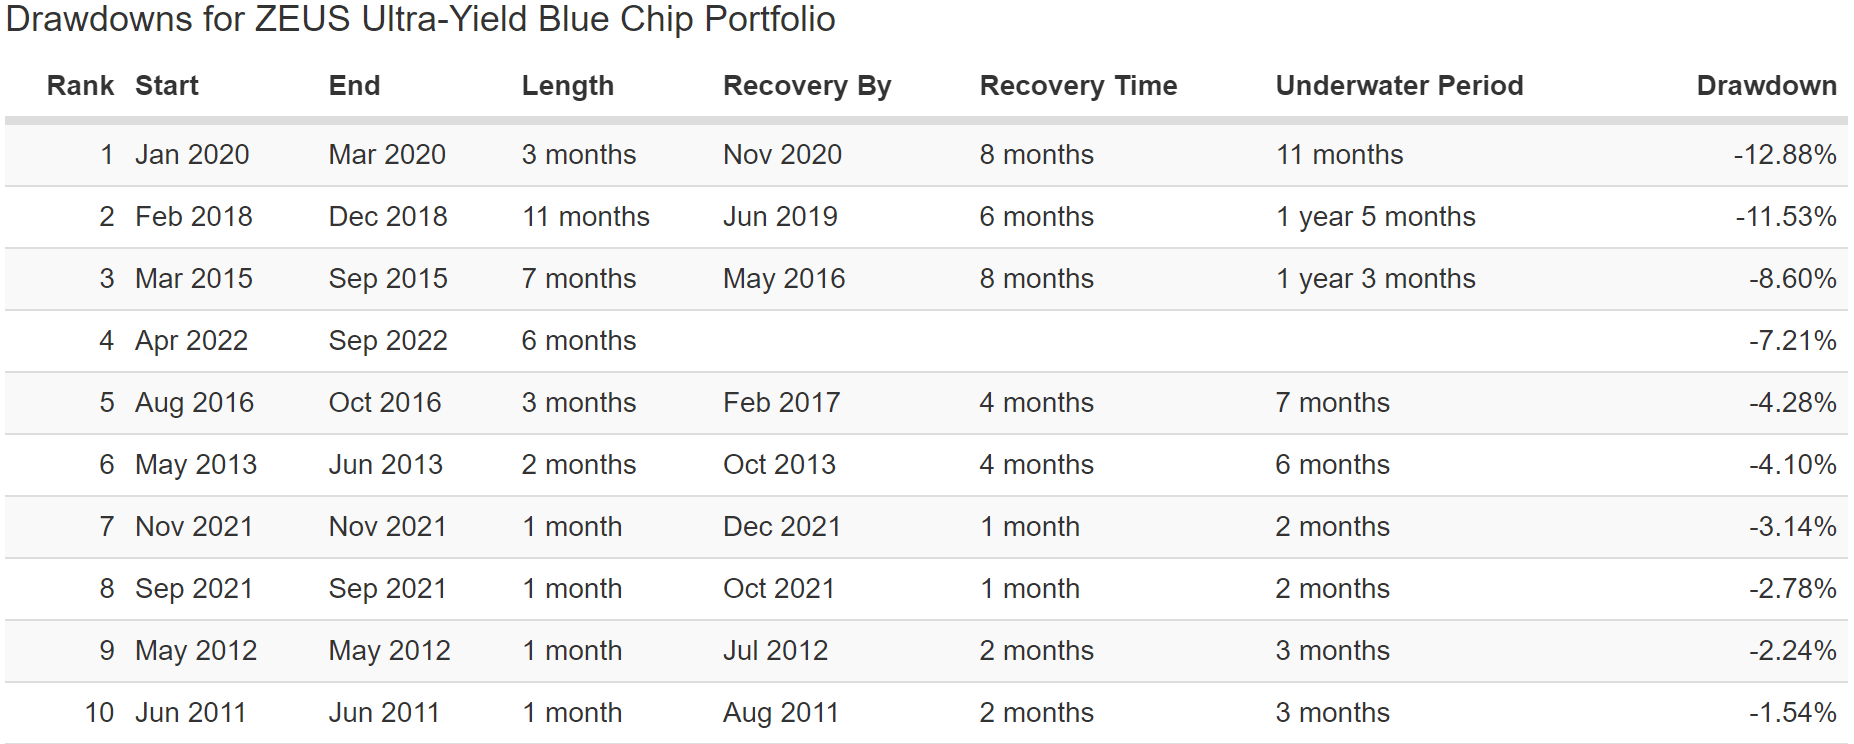
A peak decline of 7% in this bear market.
(Source: Portfolio Visualizer Premium)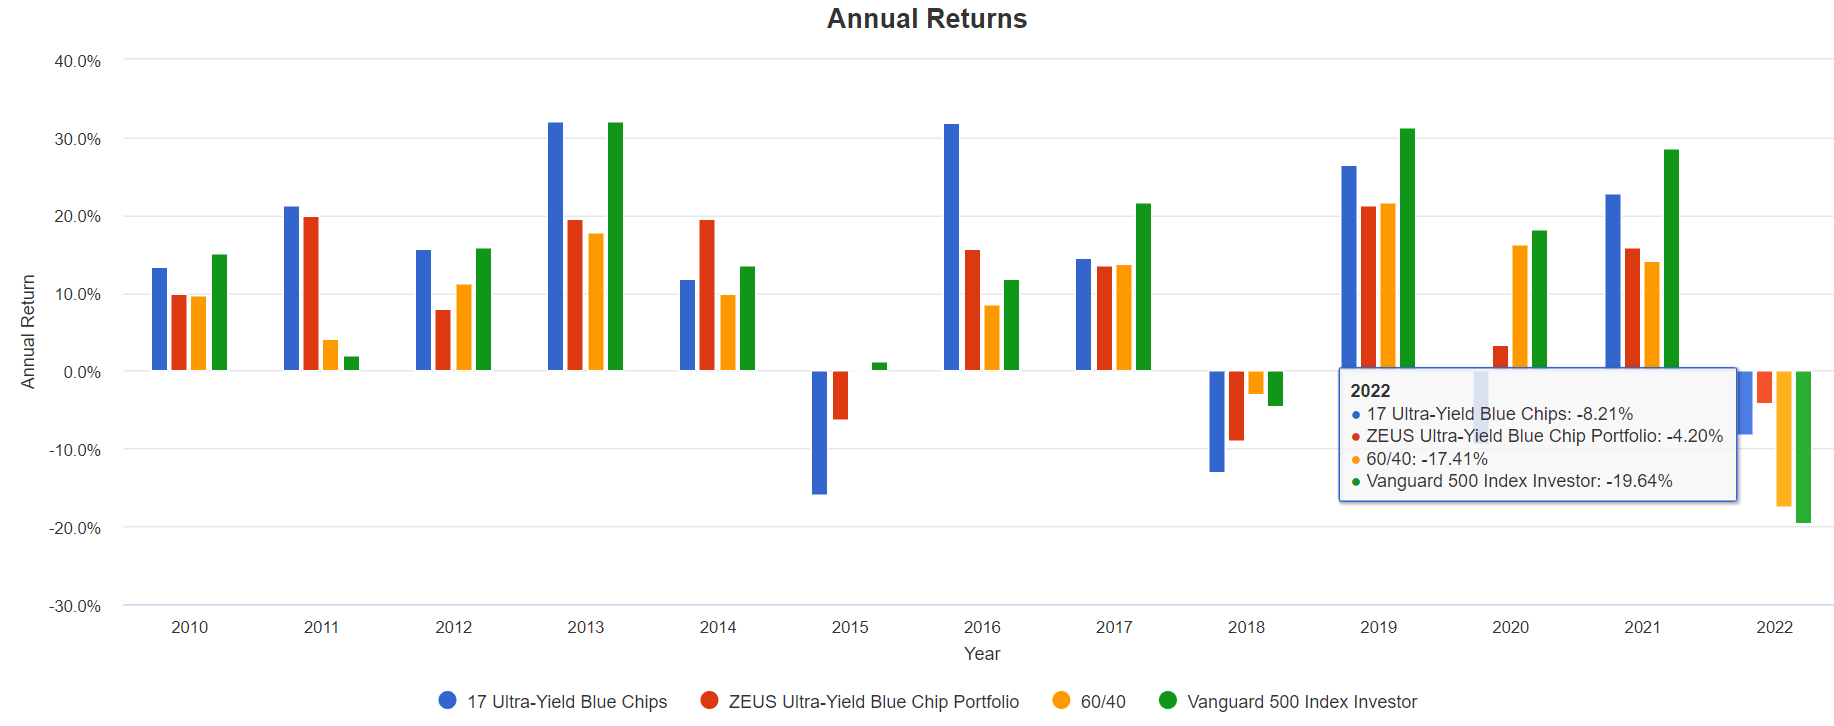
Year-to-date:
- ZEUS Ultra-Yield Blue Chip: -4%
- 17 Ultra-Yield Blue Chips: -8%
- 60/40: -17%
- S&P -20%
This year ZEUS Ultra-Yield Blue Chip is down 1/4th as much as a 60/40, during the worst year for a 60/40 since 1937.
(Source: Portfolio Visualizer Premium)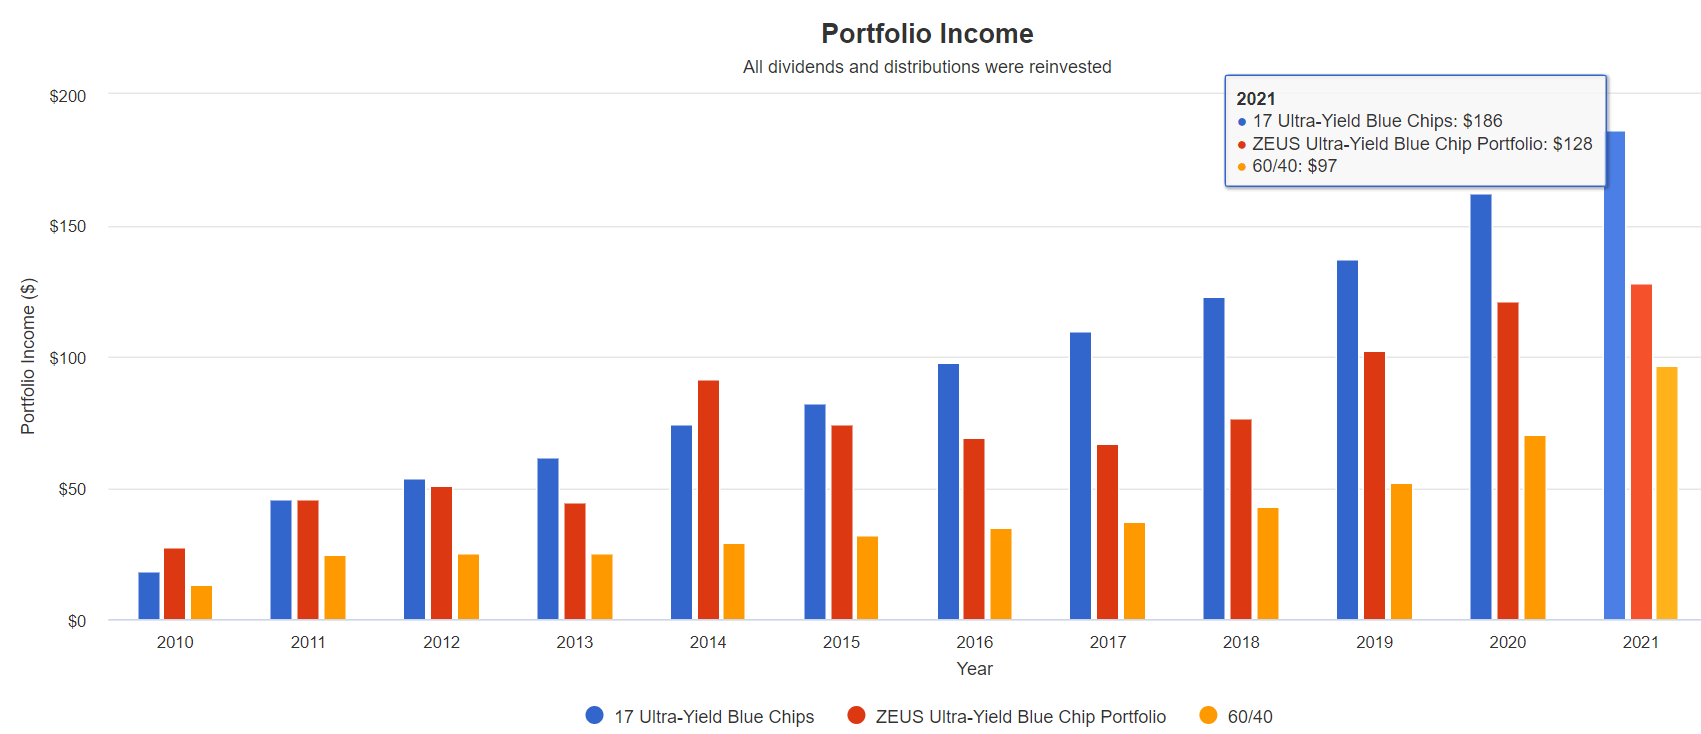
Anytime you combine bonds and/or hedge funds to stocks, the annual income will be more variable.
(Source: Portfolio Visualizer Premium)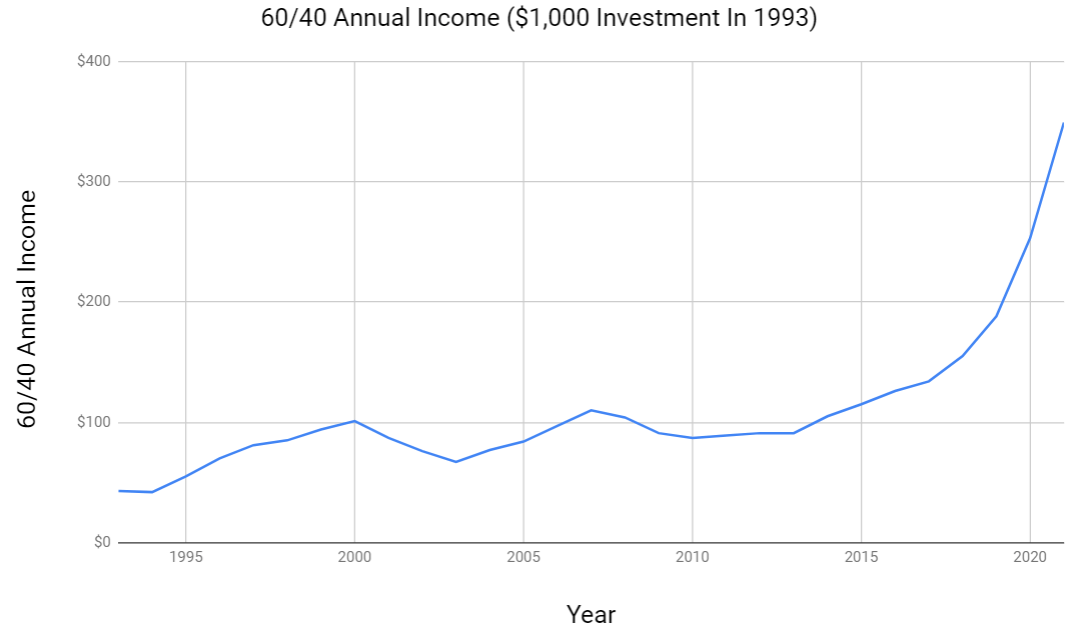
Overall, ZEUS Ultra-Yield delivered relatively stable and rising income over the last decade.
- 10.8% CAGR annual income growth
- starting yield in 2011: 4.6%
- 2021 yield on cost: 12.8%
3X the yield of a 60/40, a fraction of its volatility in stagflationary recessions, lower peak declines in most bear markets, and solid double-digit income growth, which analysts expect to continue for decades.
This is the power of world-beater blue-chip assets to help you retire rich and stay rich in retirement.
Bottom Line: These 17 Ultra-Yield Blue Chip Bargains Can Help You Sleep Well And Eat Well In This Bear Market
Stocks help us eat well, and bonds help us sleep well.” – Wall Street Adage
Not everyone actually needs to own bonds to sleep well at night in a recession (though a prudently diversified and risk-managed Ultra SWAN portfolio certainly helps smooth out volatility).
If you are generating enough SAFE and GROWING dividend income, then you have true financial freedom. You can pay the bills from dividends alone (or a fraction of them), and then stock prices are 100% meaningless.
Your only concern at that point is the safety of your dividends, and that’s where sucker yields fall flat, but ultra-yield blue-chips shine.
Ultra-yielding Super SWANs like:
- Altria (MO) dividend king
- MPLX (MPLX) – K1 tax form
- Magellan Midstream Partners (MMP): – K1 tax form
- British American Tobacco (BTI) global aristocrat
- Allianz (OTCPK:ALIZY): German
- Enbridge (ENB): Canadian aristocrat
- Keyera (OTCPK:KEYUF)
- ONEOK (OKE)
- Manulife Financial (MFC): Canadian
- Pembina Pipeline (PBA): Canadian
- Canadian Imperial Bank of Commerce (CM): Canadian
- VF Corp (VFC): dividend king
- IBM (IBM): speculative dividend aristocrat (2.5% or less max risk cap rec)
- 3M (MMM): dividend king
- Sun Life Financial (SLF): Canadian
- Telus (TU): Canadian
Together, these 17 ultra-yield blue chips offer impeccable fundamentals that can help you achieve your rich retirement dreams.
- 6.4% very safe yield (1.55% average dividend cut risk in a severe recession)
- BBB+ stable average credit rating
- 20-year average dividend growth streak
- 7.1% long-term growth consensus
- 13.5% CAGR long-term return potential (similar to what they delivered over the last 23 years)
When combined into a diversified and prudently risk-managed portfolio, such as one composed of high-yield blue chip ETFs, bonds, and managed futures, you get a 6.5% yielding Ultra SWAN portfolio that is down just 4% this year, 1/4th as much as a 60/40.
Safe high yield that has grown at double-digits for the last decade and is likely to keep growing at similar rates in the years and decades to come.
That is the power of world-beater blue chip assets. Not just to help you sleep well at night in this bear market, no matter what happens next with the economy, but also to help you retire in safety and splendor.
Be the first to comment