

Woman Shoveling Snow in Winter Blizzard Willowpix/E+ via Getty Images
I retired in June of last year and am enjoying my new life in Colorado. I have created my bucket list of things to do and nearby places to visit. With more free time available I volunteer to shovel snow for senior citizens.
In this article, I identified quality funds based on metrics and ratings from Mutual Fund Observer and Morningstar. It is divided into the following sections so that readers can skip to sections of interest as follows:
- Portfolio Performance Following Rate Hikes
- Current Investment Environment
- Fixed Income In 2023 (TIPS, Individual Bonds, Bond Funds)
- Equity and Mixed Asset Funds (Large Cap, Mixed Asset, International, Small Cap)
- Closing Thoughts
My intent is to select eight quality funds from different Lipper Categories to give Readers the opportunity to select funds based on their own risk tolerance and perception of the investment environment.
Portfolio performance following rate hikes
I used Mutual Fund Observer and Portfolio Visualizer to identify funds that did relatively well during the time periods when the Federal Reserve stopped raising rates and before the onset of a recession.
Chart #1: Federal Funds Rate
Federal Funds Rate, St. Louis Federal Reserve
I then created a portfolio from a list of seventeen funds to “Maximize Return with 8% Volatility” and to “Maximize the Sharpe Ratio” for the time period from November 2018 to December 2019 representing flat to declining Federal Funds rates before the onset of a recession. These are compared to the Vanguard Balanced Fund (VBIAX). The link to Portfolio Visualizer is provided here.
Prior to a recession starting, maximizing the return using equity may outperform the less volatile approach. It appeared in 2019 that a soft landing would be achieved until the pandemic forced a recession.
Chart #2: Portfolio Optimization November 2018 to December 2019
Portfolio Optimization (November 2018 to December 2019) (Portfolio Visualizer – Optimization)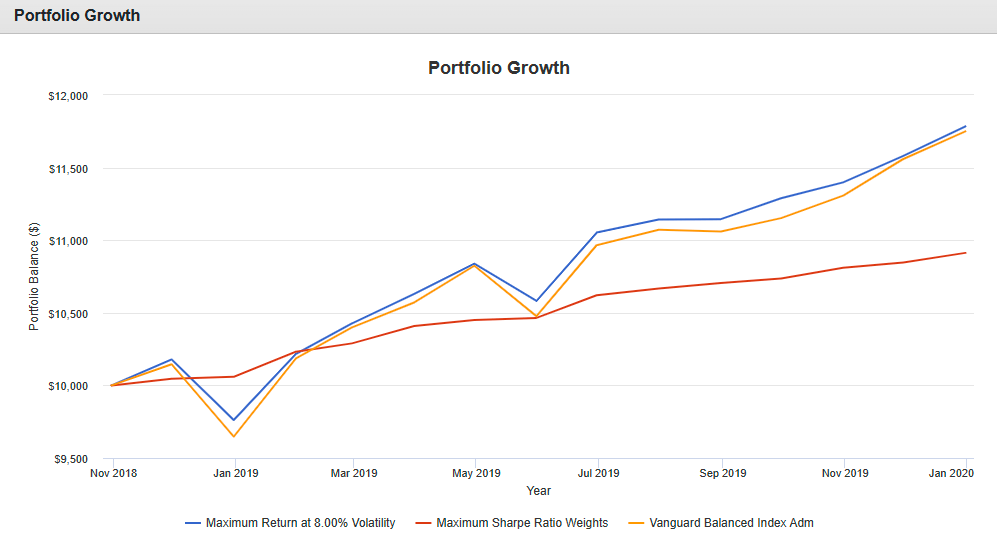
I then ran Portfolio Visualizer to backtest the same two portfolios with the time extended to the end of the bear market in March 2020. All three ended with about the same overall return. With so many risks in the current environment, I prefer to be overweight in bonds, especially with yields at these high levels.
Chart #3: Portfolio Visualizer Backtest Portfolio
Portfolio Backtest (November 2018 to March 2020) (Portfolio Visualizer – Backtest)
Table #1 shows the construction of the two portfolios and the baseline Vanguard Balanced Fund (VBIAX). Note that the “Maximize Return” portfolio has sixty percent allocated to stocks which is similar to VBIAX. The “Maximum Sharpe Ratio” only has sixteen percent allocated to stocks. I am at my minimum allocation to stocks of 35% because the current high yield of bonds provides a less risky alternative to stocks.
Table #1: Portfolio Backtest Funds and Exposures
| Symbol | Name | Maximum Return at 8.00% Volatility |
Maximum Sharpe Ratio |
VBIAX |
| DODIX | Dodge & Cox Income | 10% | 10% | |
| COTZX | Columbia Thermostat | 10% | 10% | |
| DODLX | Dodge & Cox Global Bond | 10% | 10% | |
| XLP | Consumer Staples | 10% | ||
| VTV | Vanguard Value ETF | 10% | ||
| VIGI | Vanguard Intl Div Appr | 10% | ||
| DIVI | Franklin Intl Core Div Tlt | 10% | ||
| FLLV | Franklin Liberty U.S. Low Vol | 10% | ||
| DIVO | Amplify CWP Enh Div Inc | 10% | ||
| VTEB | Vanguard Tax-Ex Bond | 10% | ||
| FSTGX | Fidelity Interm Gov Inc | 10% | ||
| PCBAX | BlackRock Tact Oppor | 10% | ||
| RPIEX | T. Rowe Price Dyn Global Bond | 10% | ||
| VTEB | Vanguard Tax-Ex Bond | 10% | ||
| BMNSX | Baird Core Interm Muni Bd | 10% | ||
| DIVI | Franklin Intl Cor Div Tilt | 10% | ||
| ARBIX | Absolute Conv Arb | 10% | ||
| US Stocks | 40% | 4% | 59% | |
| International Stocks | 20% | 12% | 1% | |
| US Bonds | 29% | 54% | 36% | |
| International Bonds | 7% | 8% | 3% | |
| Other | 1% | 10% | 0% | |
| Cash | 3% | 13% | 1% | |
Source: Author Using Portfolio Visualizer
2023 Investment environment
I track timely indicators on a weekly basis including the KC Fed Labor Market Conditions Index, the yield curve, and the Weekly Lewis-Mertens-Stock Economic Index. Labor conditions and economic growth are below their long-term trend, and the yield curve is strongly inverted. The US economy is moving closer to a recession.
Tajinder Dhillon at Lipper Alpha Insight wrote “S&P 500 Q4 2022 Earnings Preview: A Reset in Growth Expectation” which describes forecasts that earnings will decline in the fourth quarter of 2022 by -2.2% year over year and -3.6% compared to the third quarter.
In addition to declining profits, high inflation, rising rates, the possibility of a recession, Russian invasion in Ukraine, and deglobalization, there is political drama about the Federal debt ceiling. Natasha Solo-Lyons at Bloomberg reported that Treasury Secretary Janet Yellen warned the Treasury “will begin taking special accounting maneuvers on January 19 to avoid breaching the US debt limit, urging lawmakers to boost the ceiling to avert a devastating payments default.” “The Looming Debt Ceiling Crisis” by Richard McGahey in Forbes describes the current political climate that is likely to increase volatility in the first half of the year. One bipartisan solution that I believe has potential is reported by Sara Dorn at Forbes which is to tie the debt limit to gross domestic product.
Fixed income in 2023
Last year as interest rates were rising, I began using the Fidelity Fixed Income, Bonds & CDs Search tool to build ladders of short-term Treasuries and certificates of deposit. As the rates of longer duration bonds became attractive, I began increasing duration to match withdrawal needs in order to reduce drawdown risk in the future. I expand on buying individual bonds in this article.
Don’t Fight the Fed
Chart #4 shows how the yield curve behaved before and after the Federal Reserve raised interest rates on December 14th. The 10-year Treasury yield fell from nearly 4.2% to about 3.5% and rebounded after the announcement to about 3.9% before falling to nearly 3.4%. As short-term Treasuries and certificates of deposit mature in my portfolios, I have been investing the funds in longer duration Treasuries locking in returns higher than 4%. The Federal Reserve’s next rate hike announcement will be on February 1st where they are expected to raise rates by a quarter percent. Volatility may present opportunities along with risks.
Chart #4: Yield Curve Before and After December 14th Rate Hikes
Yield Curve Before and After Federal Reserve December Rate Hike (Author Based on St. Louis Federal Reserve Database)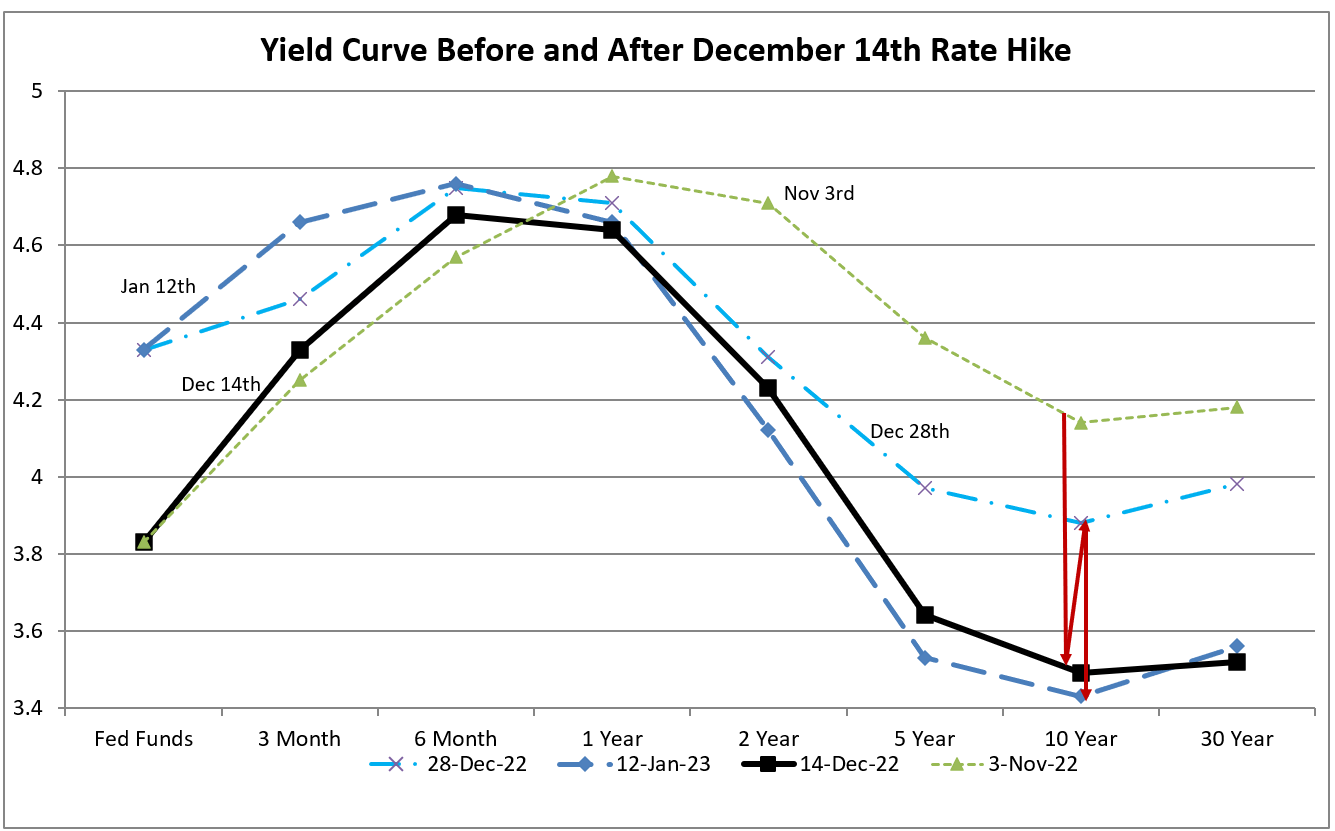
Treasury Inflation Protected Bonds
Devesh Shah wrote “Long-dated TIPS bonds: A Margin of Safety” in the Mutual Fund Observer January Newsletter that describes why TIPs did not perform well in 2023 in spite of inflation but are situated for better performance going forward. TIPs are indexed to the Consumer Price Index so that if inflation is higher, the yields will increase; however, they carry rate risk. Of the Inflation protected bonds, short duration TIPs made no money in 2022 as rates rose, while longer duration inflation bonds lost. He provides some good arguments for why TIPs may perform well in the future. I study this idea below.
Treasury Inflation Protected funds are relatively new. I used Portfolio Visualizer to compare the performance of short (STPZ), intermediate (TIPZ) and long duration (LTPZ) ETFs for the past thirteen years in Chart #5. The link to Portfolio Visualizer is provided here.
Chart #5: TIP Performance by Duration
Performance of Short, Intermediate, and Long-Term TIPs (Author Using Portfolio Visualizer and St Louis Federal Reserve Database)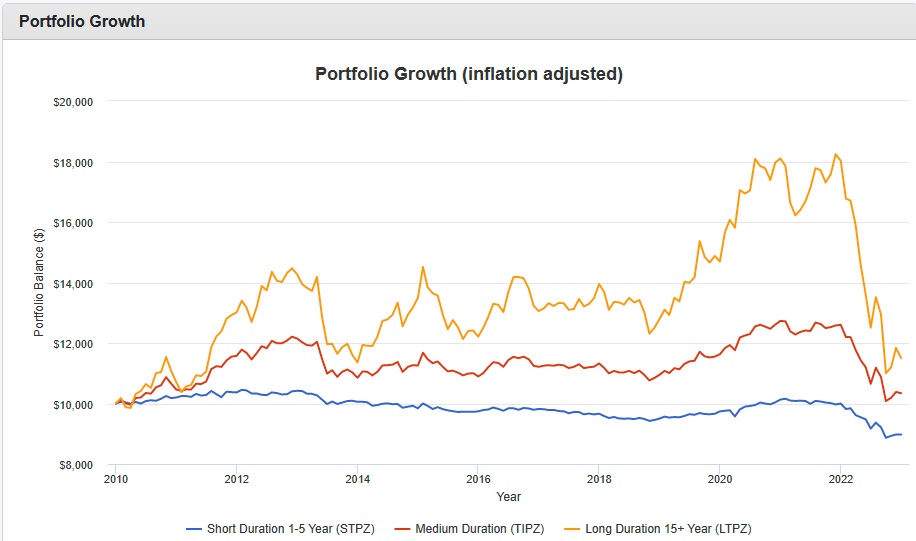
Over the past thirteen years, inflation and the Federal Funds rate had a correlation of 0.69. This means that if inflation goes up the Federal Reserve raises interest rates to cool the economy. Inflation protected bonds are negatively correlated to the inflation rate, but even more negatively correlated to the Federal Funds rate. It seems counterintuitive that if inflation goes up, TIPS have negative returns, but it makes more sense that when the Federal Funds rate goes up to combat inflation then longer duration bonds have negative returns.
Chart #6: Annual Performance of TIPs Compared to CPI and Fed Funds Rate
TIPS Returns vs Inflation & Federal Funds Rate (Author Using Portfolio Visualizer and St Louis Federal Reserve Database)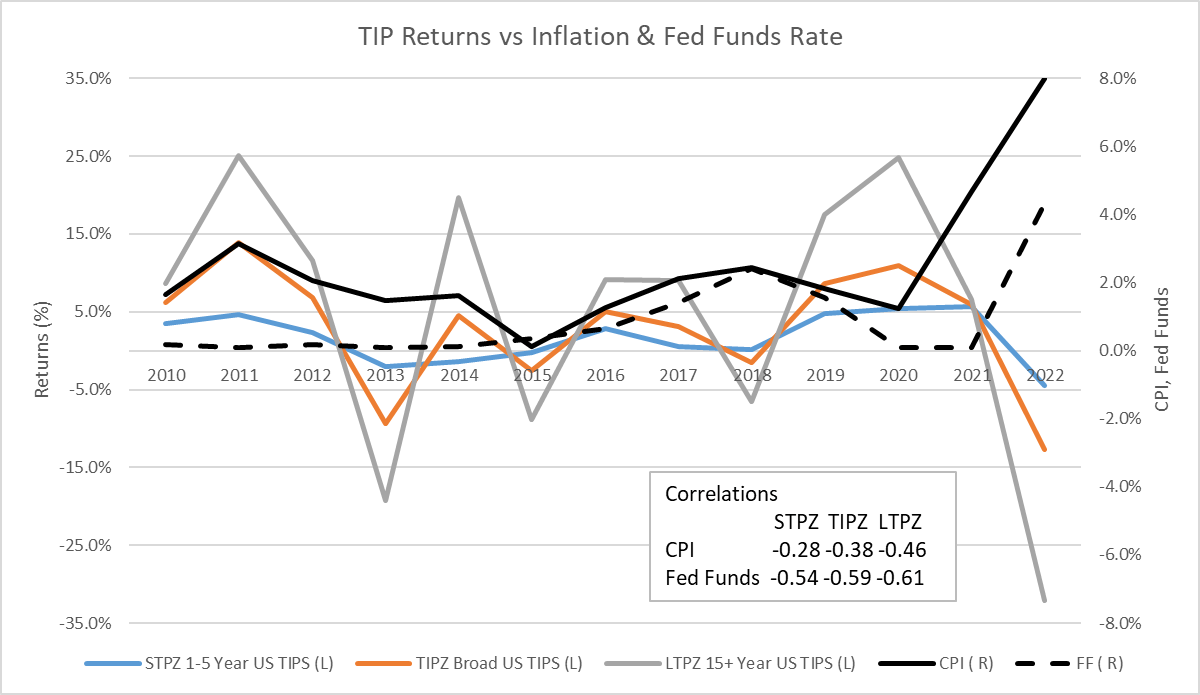
Chart #7 shows a scatter plot of the PIMCO 15+ Year US TIPS ETF (LTPZ) to the annual change in the Federal Funds Rate. The correlation is 0.57. The higher the Federal Funds rate rises the further LTPZ falls.
Chart #7: TIPs vs Change in Federal Funds Rate
PIMCO 15+ Year US TIPS ETF vs Change in Fed Funds Rate (Author Using Portfolio Visualizer and St Louis Federal Reserve Database)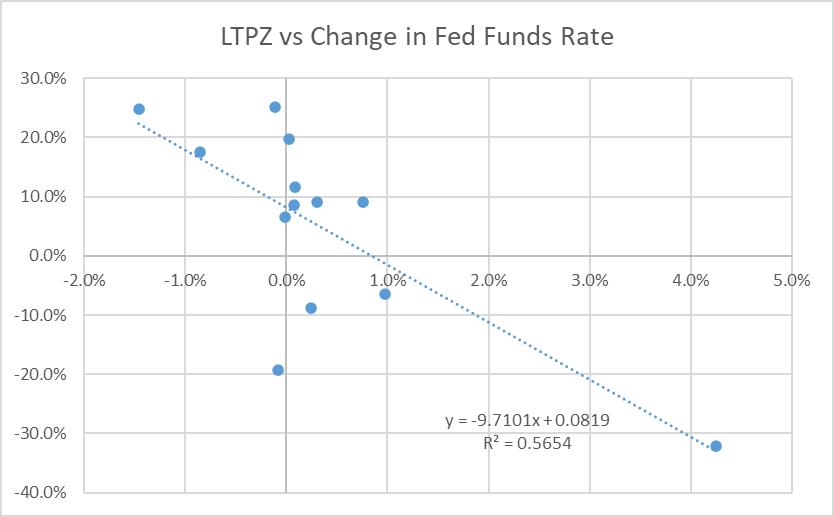
Inflation appears to have plateaued with interest rates high and likely to begin falling by 2024. This is a good reason to increase allocations to bonds, but why buy inflation protected bonds over bonds with nominal yields? Chart #8 shows how the Vanguard Long-Term Bond ETF (BLV) compares to the PIMCO 15+ Year US TIPS ETF (LTPZ). While both returns end up at essentially the same place over the thirteen-year period, the long-term TIP performs better during inflationary periods.
Chart #8: Nominal Bond Fund Performance vs TIPs
Long Term Bonds – Nominal vs TIPS (Author Using Portfolio Visualizer and St Louis Federal Reserve Database)
I believe that deglobalization, costs associated with climate change, and depletion of natural resources will lead to higher inflation over the next few decades. I have been buying nominal treasuries because of the higher rates to match with withdrawal needs. I will supplement this approach to include individual intermediate Inflation Protected Treasury bonds that I can hold to maturity to match withdrawal needs. Inflation Protected ETFs that I currently track are shown below:
Table #2: Inflation Protected Funds
| Symbol | Name | Yield %/yr | 30d Yield % | Div Freq | Effective Maturity Years | AUM $M | APR 3mo % | APR 2022 % |
| Vanguard Short-Term Inf-Prot Sec | 6.8 | 2.3 | Quarterly | 2.5 | 53,609 | 1.2 | -2.9 | |
| TDTT | Northern Trust FlexShares iBoxx 3-Yr Target Dur | 7 | 6.6 | Monthly | 3.5 | 2,045 | 1.3 | -4.6 |
| TIPX | State Street 1-10 Yr TIPS | 6.1 | 1.6 | Monthly | 4.6 | 1,363 | 1.4 | -7.6 |
| TDTF | Northern Trust FlexShares iBoxx 5-Yr Trgt Dur TIPS | 7.6 | 6.4 | Monthly | 6 | 716 | 1.7 | -9.5 |
| SPIP | State Street SPDR Portfolio TIPS | 7.1 | 1.6 | Monthly | 7.6 | 2,237 | 1.9 | -12.8 |
| LTPZ | Allianz PIMCO 15+ Yr US TIPS | 8.4 | 6.9 | Monthly | 22.3 | 631 | 4.7 | -31.6 |
Source: Author Using Mutual Fund Observer and Morningstar
Chart #9: Inflation Protected Funds
Author’s Selected Inflation Protected Bonds (Author Using Mutual Fund Observer)
Searching for Higher Yields with Safety
Because Ten-year yields on Treasuries have fallen from around 4% to 3.4%, I have been searching for higher yields but without much more risk. Table #3 is the average yield derived from Fidelity for bonds with call protection. The lower part of the chart shows the spread between agency and corporate bonds compared to Treasuries. Municipal bond spreads are compared to the highest rated municipal bond funds. Up to three years duration, Treasuries appear the most attractive given the likelihood of a recession. Beyond that, quality agency and corporate bonds have potential.
Table #3: Average Bond Yields and Spreads
Average Bond Yields (Author Using Fidelity)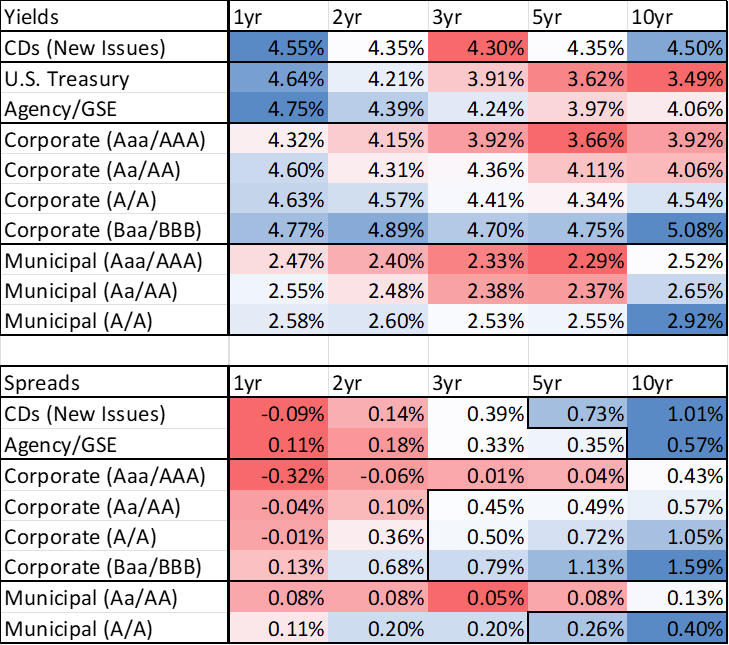
I used the Fidelity bond screen to identify individual bonds offering competitive yields for their rating with call protection. I then used the Fidelity stock screen to eliminate companies with high debt to equity ratios. Table #4 contains my short list. I will continue to match the maturities with withdrawal needs.
Table #4: Bond Ratings
| Description | Moody’s Rating | S&P Rating |
| Treasuries | AAA | |
| Federal Farm Credit Banks | AAA | AA+ |
| Federal Home Loan Banks | AAA | AA+ |
| Federal National Mortgage Association | AAA | AA+ |
| Tennessee Valley Authority | AAA | AA+ |
| Berkshire Hathaway | AA2 | AA |
| Pfizer | A1 | A+ |
| Paccar Financial Corp | A1 | A+ |
| Bank New York Mellon Corp | A1 | A |
| Northern Trust Corp | A2 | A |
| US Bank Corp | A2 | A |
| National Rural | A2 | A- |
| State Street | A2 | A- |
| Bank Of America | A2 | A- |
| PNC Bank | A3 | A- |
Source: Author Using Fidelity
Bond Funds
After matching bonds with withdrawal needs, I prefer bond funds for remaining allocations. Below are my highest ranked quality bond funds. The names shaded blue signify that the funds are classified as a Great Owl fund by Mutual Fund Observer.
Table #5: Author’s Selected Top-Ranked Bond Funds
| Symbol | Name | Lipper Category | MFO 3 Year Rating | Morningstar Rating | % Total Return 3 Month | 30d Yield % |
| RPIEX | T Rowe Price Dyn Glbl Bond | Absolute Return Bond | 5 | 5 | -2.1 | 6.7 |
| TDTF | Northern Trust 5-Year Target Duration TIP | Inflation Protected Bond | 3 | 4 | 3.7 | 6.4 |
| KORP | American Century Diver Corp Bond | Core Plus Bond | 5 | 5 | 6.8 | 4.9 |
| DODIX | Dodge & Cox Income | Core Bond | 5 | 5 | 8.6 | 4.2 |
| FUAMX | Fidelity Interm Treasury Bond | U.S. Treasury General | 5 | 4 | 6.4 | 3.8 |
| FSTGX | Fidelity Interm Gov Income | U.S. Gov Short-Interm | 1 | 4 | 3.1 | 3.7 |
| MFAEX | American Funds Mortgage | U.S. Gov Intermediate | 5 | 5 | 7.7 | 3.0 |
| VTEB | Vanguard Tax-Ex Bond Index | Muni Gen & Insured Debt | 4 | 3 | 6.4 | 3.4 |
| BMNSX | Baird Core Interm Muni Bond | Muni Interm Debt | 4 | 3 | 5.1 | 3.0 |
Source: Author Using Mutual Fund Observer and Morningstar
Chart #10 shows historical performance of these bond funds.
Chart #10: Author’s Selected Bond Funds
Author’s Selected Bond Funds (Author Using Mutual Fund Observer)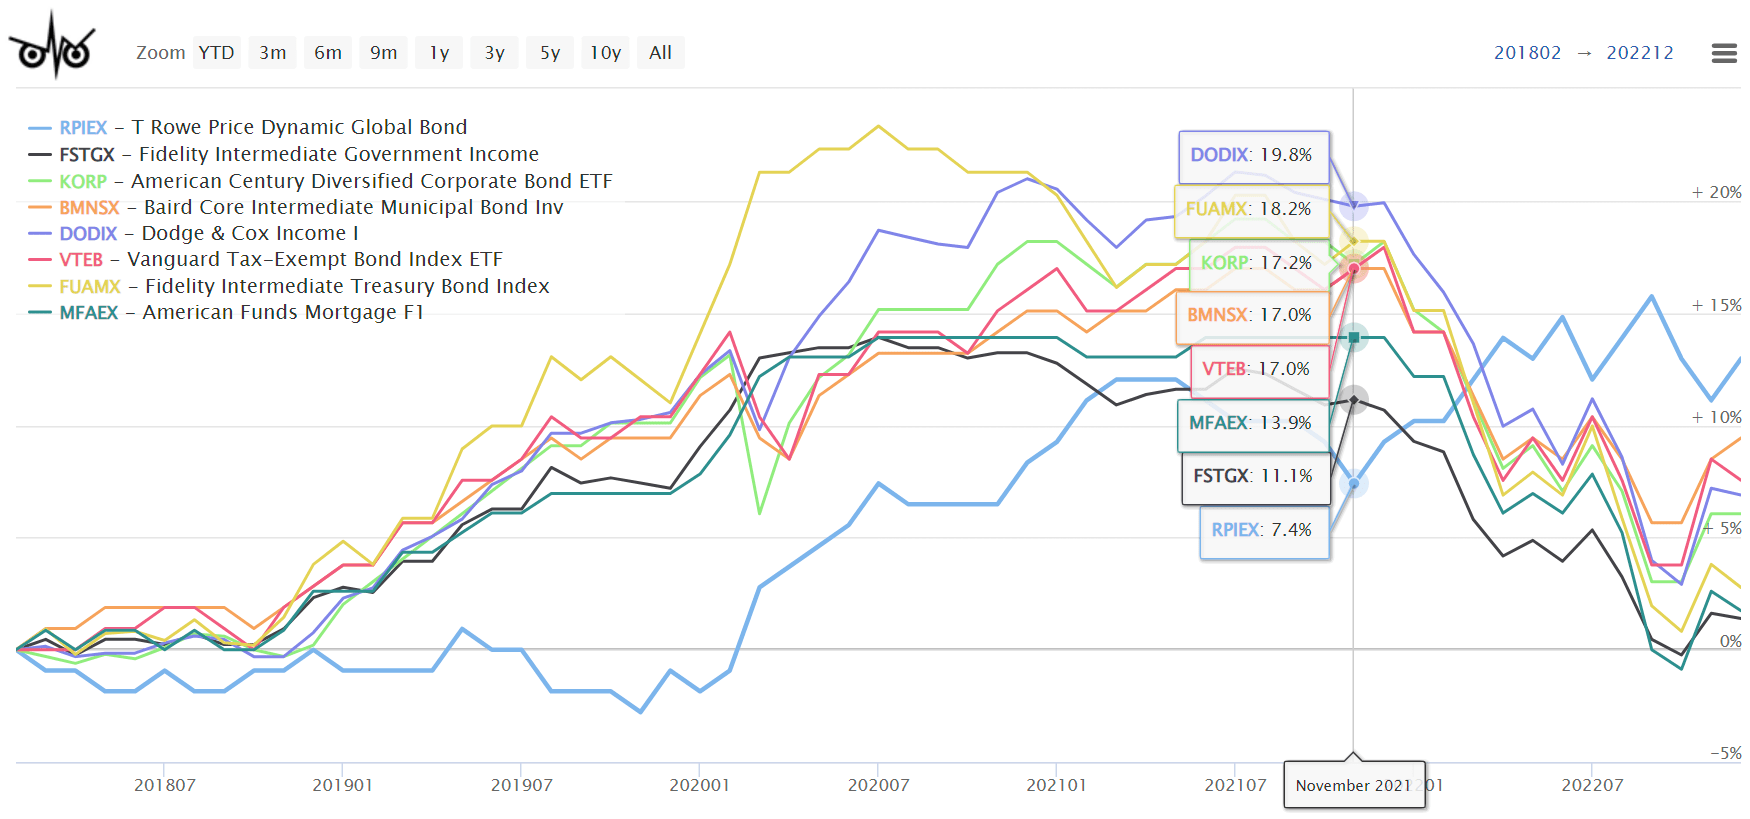
Bullish Bond Funds
I created a screen at Fidelity to identify exchange traded funds that are bullish using technical indicators such as Moving Average Convergence Divergence. I narrowed the list to eight funds shown in Table #6 based on quality rating and volatility among other preferences. I show alternative funds based on my rating system.
Table #6: Bullish Bond Funds
| Sym-bol | Name | Lipper Category | Yield %/yr | 30d Yield % | Ulcer Indx | APR 3mo % | MFO Rating 3 Year | Morning-star | FactSet | Author’s Alternative |
| QLTA | BlackRock iShares Aaa – A Corp Bond | Corp Debt A Rated | 2.8 | 4.75 | 8.6 | 2.98 | 3 | 3 | A | |
| BIV | Vanguard Interm-Term Bond | Core Bond | 2.4 | 4.43 | 7.3 | 1.90 | 3 | 4 | A | FTBFX |
| JAGG | JPMorgan U.S. Agg Bond | Gen Bond | 2.2 | 3.99 | 7.2 | 1.59 | 2 | 3 | A | BAB |
| VGIT | Vanguard Interm-Term Treasury | U.S. Gov Interm | 1.7 | 3.85 | 6.5 | 0.98 | 3 | 4 | A | MFAEX |
| SPTI | State Street Port Interm Term Treasury | U.S. Treas Gen | 1.4 | 3.75 | 6.5 | 1.01 | 5 | 4 | A | FUAMX |
| CMBS | BlackRock iShares CMBS ETF | U.S. Mort | 2.6 | 3.66 | 6 | 0.90 | 3 | 4 | A | LMBS |
| NY Life IQ MacKay Muni Interm ETF | Muni Interm Debt | 2.3 | 3.11 | 4.7 | 4.07 | 4 | 5 | B | FLTMX | |
| SPIP | State Street Port TIPS | Infl Prot Bond | 7.1 | 1.59 | 5.2 | 1.92 | 2 | 3 | A | VTIP |
Source: Author Using Mutual Fund Observer and Morningstar
Chart #11: Bullish Bond Funds
Bullish Bond Funds – Technical Indicators (Author Using Mutual Fund Observer)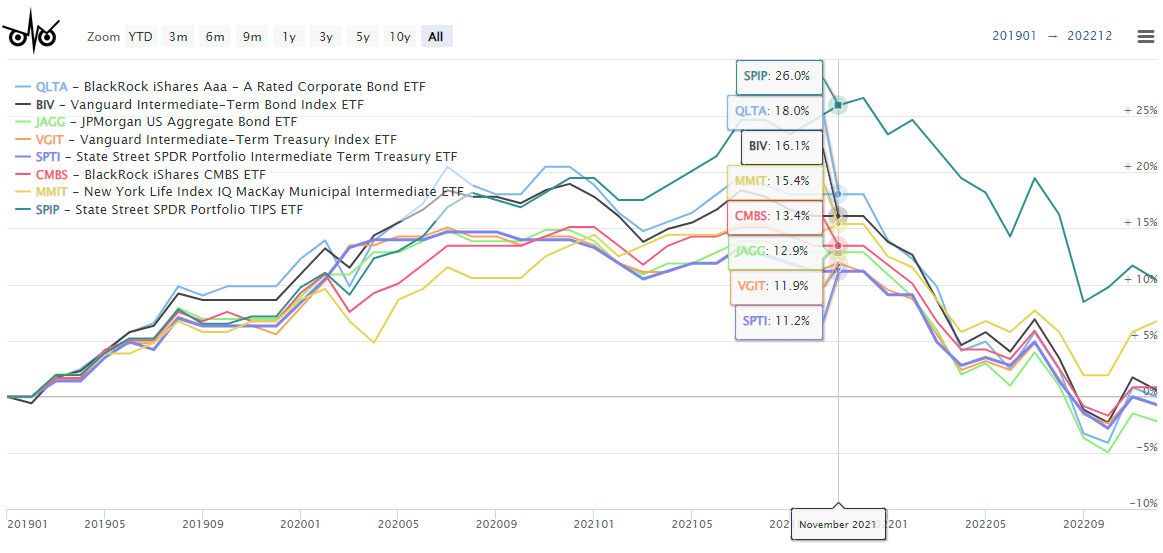
Equity and mixed asset funds
Over the next few years, I expect value to outperform growth, small cap to outperform large cap, and global to outperform domestic funds, but these will probably be more volatile. For this reason, I have included the categories below.
Large and Multi-Cap Value Funds
Table #7 contains my top-ranked large and multi-cap equity funds.
Table #7: Author’s Selected Top-Ranked Large and Multi-Cap Funds
| Symbol | Name | MFO 3 Year Risk | MFO 3 Year Rating | Morningstar Rating | % Total Return 3 Month | 30d Yield % |
| COWZ | Pacer US Cash Cows 100 | 4 | 5 | 5 | 11.7 | 2.2 |
| NOBL | ProFunds S&P 500 Div Aristocrats | 4 | 5 | 5 | 13.3 | 2.0 |
| VTV | Vanguard Value Index | 4 | 4 | 5 | 12.7 | 2.5 |
| FNDX | Schwab Fund U.S. Large Company Index | 4 | 5 | 4 | 12.1 | 2.1 |
| PRF | Invesco FTSE RAFI US 1000 | 4 | 5 | 4 | 11.9 | 2.0 |
| FNDB | Schwab Fund U.S. Broad Market Index | 4 | 5 | 4 | 12.4 | 2.0 |
| MFUS | Allianz PIMCO Dyn Multi-Factor US Eq | 4 | 5 | 4 | 11.6 | 2.2 |
| CDC | VictoryShares US EQ Inc Enh Vol Wtd Indx | 4 | 5 | 5 | 7.2 | 3.8 |
Source: Author Using Mutual Fund Observer and Morningstar
Chart #12: Author’s Selected Large and Multi-Cap Value Funds
Author’s Top Ranked Large and Multi-Cap Value Funds (Author Using Mutual Fund Observer)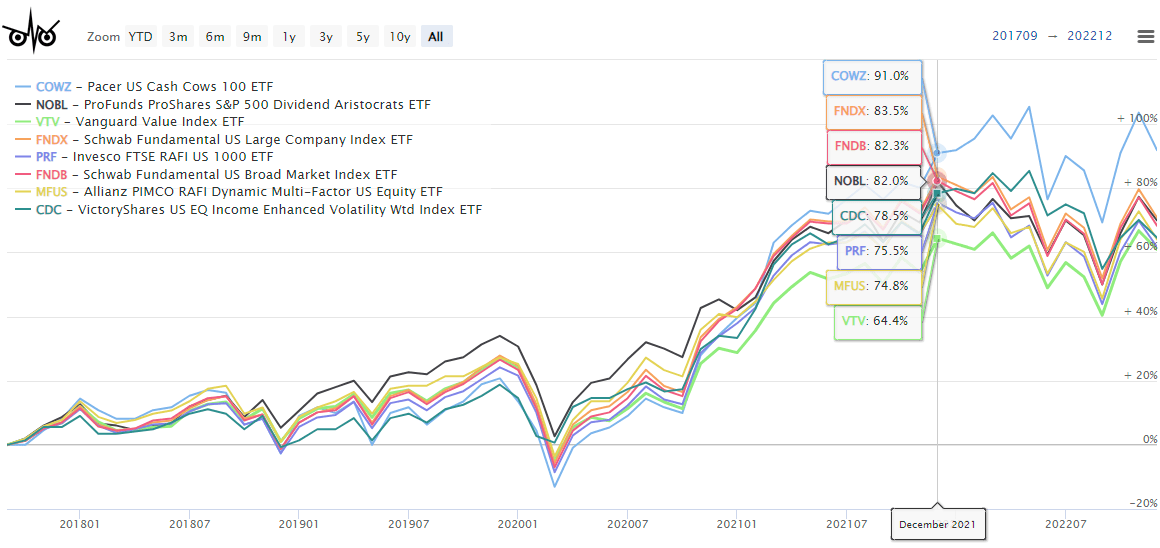
Mixed-Asset Funds
Like many retirees, I like to keep things simple and favor mixed-asset funds. The table below shows Risk (Ulcer Index) and Risk-Adjusted Returns (Martin Ratio) from Mutual Fund Observer for the past three years. I show the highest rated funds from my ranking system. They are sorted from lowest risk to highest.
Table #8: Author’s Selected Top-Ranked Multi-Asset Funds
| Symbol | Name | MFO 3 Year Risk | MFO 3 Year Rating | Morningstar Rating | % Total Return 3 Month | 30d Yield % |
| VWIAX | Vanguard Wellesley Income Admiral | 2 | 5 | 5 | 9.4 | 4.1 |
| REMIX | Standpoint Multi-Asset | 2 | 5 | 5 | -0.1 | |
| COTZX | Columbia Thermostat | 2 | 4 | 5 | 7.4 | 1.7 |
| FAPTX | American Funds 2025 Target Retire | 3 | 5 | 5 | 9.4 | 1.6 |
| VTMFX | Vanguard Tax Managed Balanced | 3 | 5 | 5 | 6.9 | 2.5 |
| TRRIX | T Rowe Price Retire Balanced | 3 | 5 | 4 | 7.2 | 1.5 |
| VGYAX | Vanguard Global Wellesley Income | 3 | 5 | 5 | 11.3 | |
| FSDIX | Fidelity Strategic Div & Income | 4 | 5 | 5 | 10.4 | 2.9 |
Source: Author Using Mutual Fund Observer and Morningstar
Vanguard Wellesley Income (VWIAX) is my safe haven fund because it has a conservative allocation to stocks and is domestic. I also own Vanguard Global Wellesley Income (VGYAX) for global diversification. While Standpoint Multi-Asset (REMIX) has been a good performer, it can have large daily swings. I also like Columbia Thermostat (COTZX, CTFAX) because it increases allocations to stocks as the market falls.
Chart #13: Author’s Selected Top-Ranked Multi-Asset Funds
Selected Top-Rated Multi-Asset Funds (Author Using Mutual Fund Observer)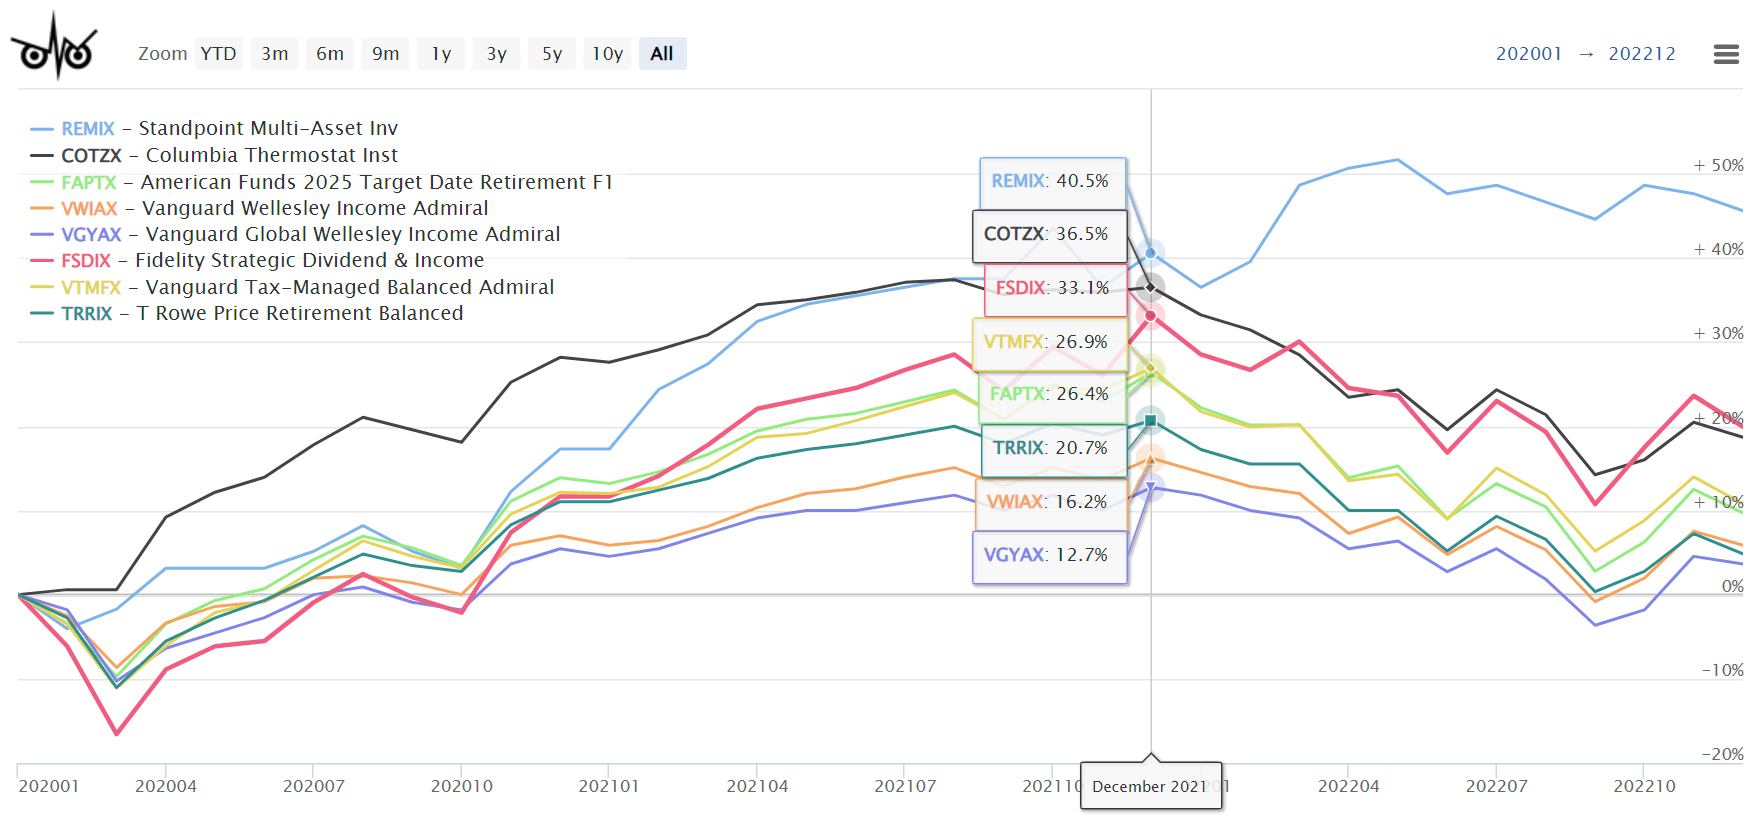
Global and International Equity Funds
The Federal Reserve was more aggressive raising short-term rates than many countries. As they slow down the pace of increases, the dollar may weaken, which will favor international equities which also have lower valuations. BlackRock Tactical Opportunities (PCBAX) is interesting for its low drawdown. State Street S&P Emerging Markets Small Cap (EWX) is also interesting to watch for expected higher growth of emerging markets.
Table #9: Author’s Top-Ranked Global and International Equity Funds
| Symbol | Name | MFO 3 Year Risk | MFO 3 Year Rating | Morningstar Rating | % Total Return 3 Month | 30d Yield % |
| PCBAX | BlackRock Tactical Opportunities | 2 | 5 | 5 | 1.7 | 5.3 |
| DIVI | Franklin Intern Core Div Tilt | 4 | 5 | 5 | 25.5 | 4.4 |
| FMIEX | Wasatch Global Value | 4 | 5 | 5 | 17.7 | 2.2 |
| ISDX | Invesco RAFI Strategic Dev ex-US | 4 | 5 | 5 | 21.0 | 2.7 |
| VIGI | Vanguard Intern Dividend Appreciation | 4 | 4 | 4 | 18.1 | 0.0 |
| FGILX | Fidelity Global Equity Income | 4 | 5 | 5 | 12.1 | 1.1 |
| IOO | BlackRock iShares Global 100 ETF | 4 | 5 | 5 | 9.3 | 1.8 |
| EWX | State Street S&P EM Markets Small Cap | 4 | 5 | 4 | 14.0 | 4.6 |
Source: Author Using Mutual Fund Observer and Morningstar
Chart #14: Author’s Top-Ranked Global and International Equity Funds
Author’s Selected Global and International Equity Funds (Author Using Mutual Fund Observer)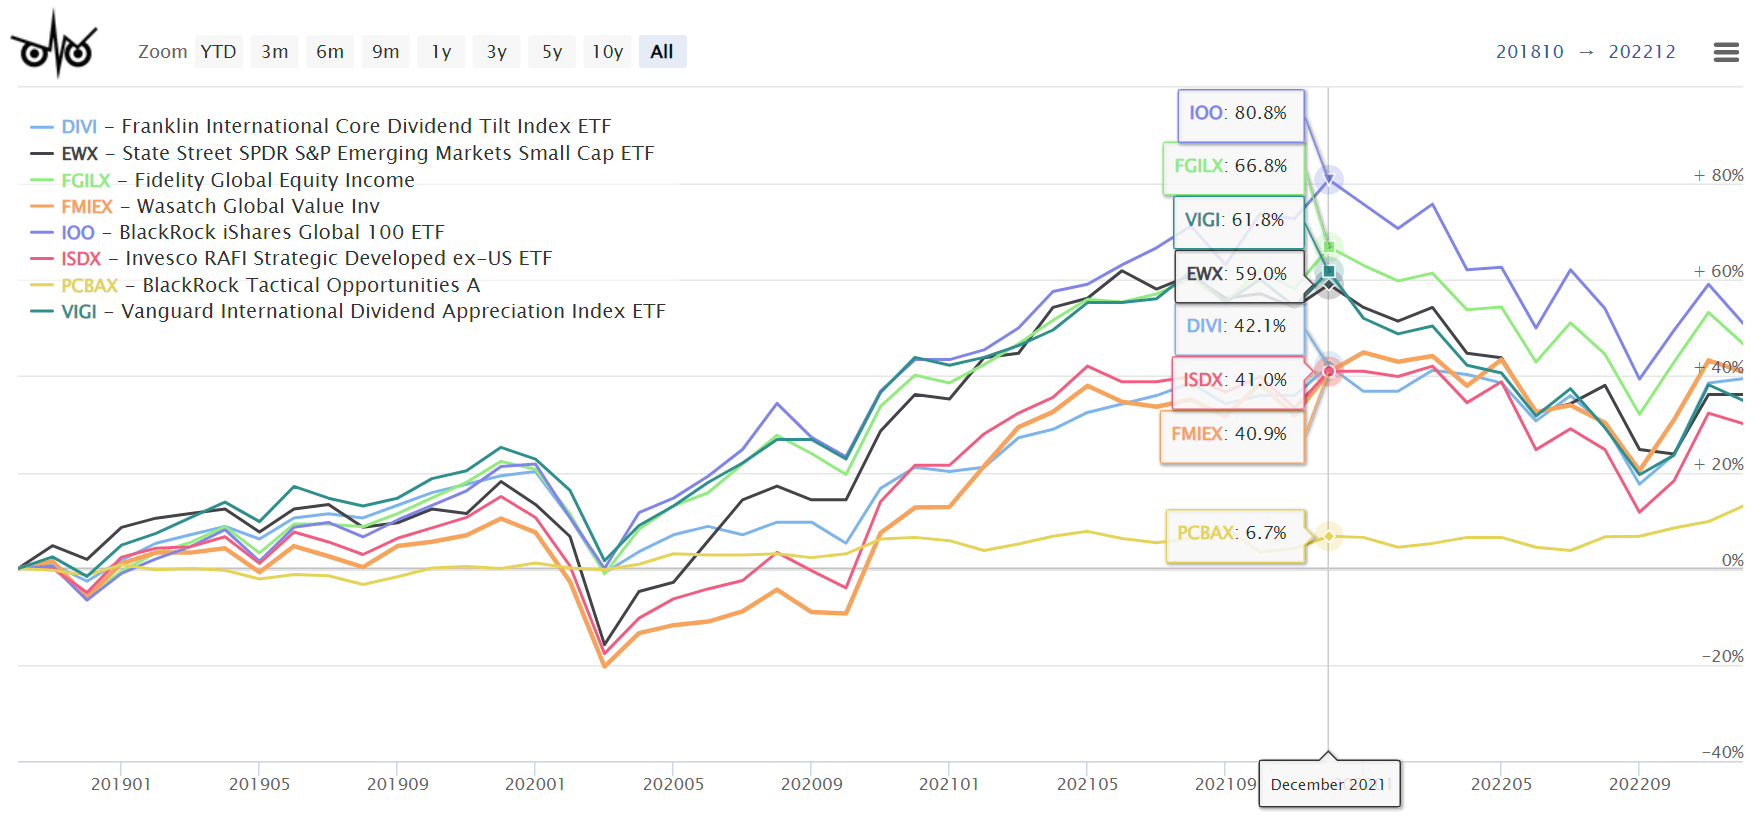
Small and Mid-Cap Equity Funds
Of the small and mid-cap equity funds, Horizon Kinetics Small Cap Opportunities (KSCOX) stands out for its high growth, but also its high volatility. Palm Valley Capital (PVCMX) is another interesting fund because it has had decent three year returns with low drawdown.
Table #10: Author’s Top-Ranked Small and Mid-Cap Equity Funds
| Symbol | Name | Lipper Category | MFO 3 Year Risk | MFO 3 Year Rating | Morningstar Rating | % Total Return 3 Month |
| PVCMX | Palm Valley Capital Inv | Small-Cap Growth | 2 | 5 | 5 | 4.5 |
| KSCOX | Horizon Kinetics Small Cap Opport | Global Small/Mid Cap | 5 | 5 | 5 | 6.5 |
| BOSOX | Boston Trust Walden Small Cap | Small-Cap Core | 4 | 5 | 5 | 11.2 |
| JPME | JPMorgan Diver Rtrn US Mid Cap | Mid-Cap Core | 4 | 5 | 4 | 12.0 |
| FLPSX | Fidelity Low-Priced Stock | Mid-Cap Value | 4 | 4 | 5 | 12.2 |
| VIMCX | Virtus KAR Mid-Cap Core | Mid-Cap Growth | 4 | 5 | 5 | 12.4 |
| QRSVX | FPA Queens Road Small Cap Value | Small-Cap Core | 4 | 5 | 5 | 13.3 |
| ONEV | State Street Russell 1000 Low Vol | Mid-Cap Core | 4 | 5 | 5 | 13.5 |
Source: Author Using Mutual Fund Observer and Morningstar
Chart #15: Author’s Selected Top-Ranked Small and Mid-Cap Equity Funds
Author’s Selected Small and Mid-Cap Equity Funds (Author Using Mutual Fund Observer)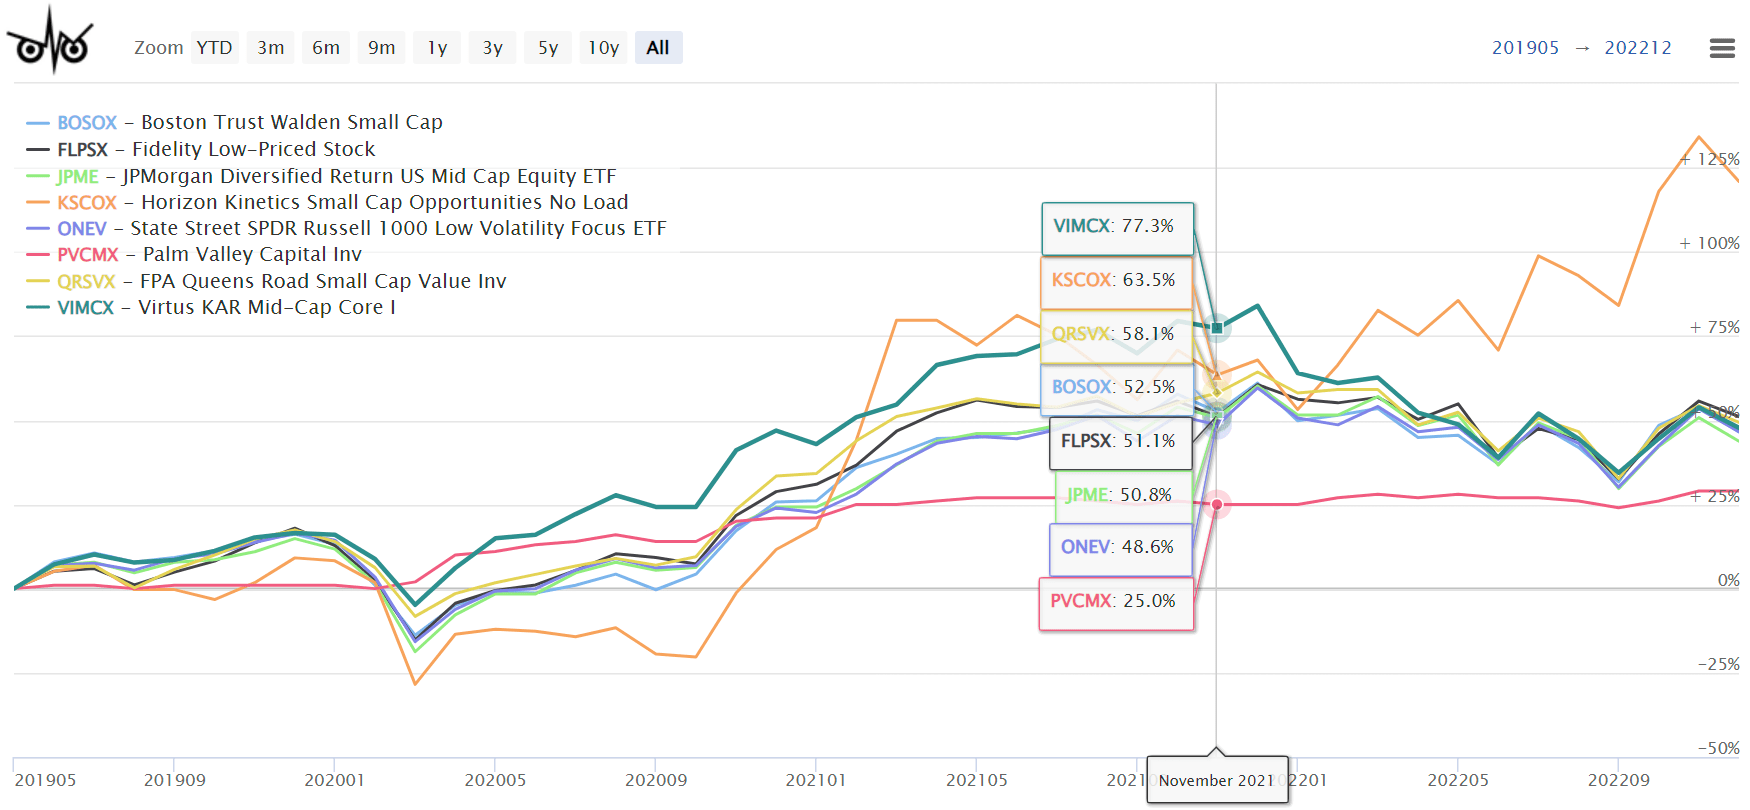
Closing thoughts
I expect 2023 to be a volatile year and believe stocks will see new lows and am underweight equities. I changed my investment approach when yields increased by buying individual bonds to match withdrawal plans. As a result, I will reduce how much I have invested in mixed asset funds. The funds in this article form my watchlist for 2023. I am going to concentrate on buying fixed income in the near term and shifting more to equities after the yield curve starts to steepen.
Best wishes investing in 2023.
Be the first to comment