

Pgiam/iStock via Getty Images
Another year has passed and what a year it has been. It was Wall Street’s worst year since 2008 with the S&P 500 narrowly avoiding a bear market as its YTD return came in at 19.4%. The NASDAQ fared far worse slumping 33.4% whereas the good old Dow Jones only corrected by a moderate 8.5%.
The war in Ukraine, inflation and the Federal Reserve have been the factors dominating market movements in 2022 and it is not unlikely to believe that these factors will also play a major role, possible even the major role again, in 2023.
Markets have repriced risk assets due to the Fed aggressively hiking interest in its fight against inflation. The upcoming earnings season will be interesting but whatever happens I will continue to buy stocks and embrace all the volatility and surprises this year will have in store for us.
My dividend journey continues and investing into stocks never stops and month after month I am grateful for being able to invest a solid amount of my income into building wealth along my journey towards reaching financial independence.
Portfolio Changes in December
December was probably the most active month of the year even though net investment activity only came in at around $560. The main reason for that is that I was forced to sell 6 positions even though it later turned out 4 would have been enough:
On 1st January 2023, the IRS’ new Internal Revenue Code Section 1446(F) will become effective. It will impact proceeds from sales of Publicly Traded Partnerships (PTPs) held by non-U.S. tax residents. All sales will become subject to a 10% withholding tax.
Source: Trading212
With that I had to say goodbye to Energy Transfer (ET), Enterprise Products Partners (EPD), MPLX (MPLX), CVR Partners (UAN) and Brookfield Renewable Partners (BEP) and Brookfield Infrastructure Partners (BIP).
After I had already sold these positions, it turned out that BEP and BIP filed a Qualified Notice which makes them exempt from the 10% withholding tax so I am now contemplating whether to reinvest into BIP or just move on.
I have deployed some of the proceeds from the forced sales and put them mainly into Hercules Capital (HTGC), Enbridge (ENB), NextEra Energy Partners (NEP) and Blackstone (BX) as well as swapped some BEP into BEPC and later back into BEP but overall I have around $1,000 left for investing which is great if stocks were to fall a bit more.
I believe that BEP is a huge bargain right now and I will certainly make sure not only to build back my previous position but significantly expand, at least as long as BEP is trading comfortably below $30.
Apart from that all other purchases were triggered by the almost weekly savings plans.
Due to the nature of how the monthly investment plan process works, I am investing relatively equally into these stocks at two points of time during the month – at the beginning of the month and mid-month – which breaks down as shown below. Figures are in Euro and show that, for instance, at the beginning of the month, I am investing between 50 and 75 EUR each into Microsoft (MSFT), The Home Depot (NYSE:HD), Visa (NYSE:V), W. P. Carey (WPC), and BP (NYSE:BP). Mid-month, I am adding between 33 and 40 EUR each into STAG Industrial (NYSE:STAG), AT&T (T), NextEra Energy (NYSE:NEE), Toronto-Dominion Bank (NYSE:TD), Main Street Capital (NYSE:MAIN) and JPMorgan (NYSE:JPM).
I have added several investment plans starting mid-September 2020 which include AGNC Investment Corp. (NASDAQ:AGNC), Ares Capital (NASDAQ:ARCC), Medical Properties Trust (NYSE:MPW), The Bank of Nova Scotia (NYSE:BNS) and The Trade Desk (NASDAQ:TTD). Investments here will be focused on high-yield as well as high-growth stocks in the technology, therapeutic and renewables sectors.
All those purchases substantially raised my forward annual dividend income, breaking down as follows:
Added Dividend Income (Designed by author)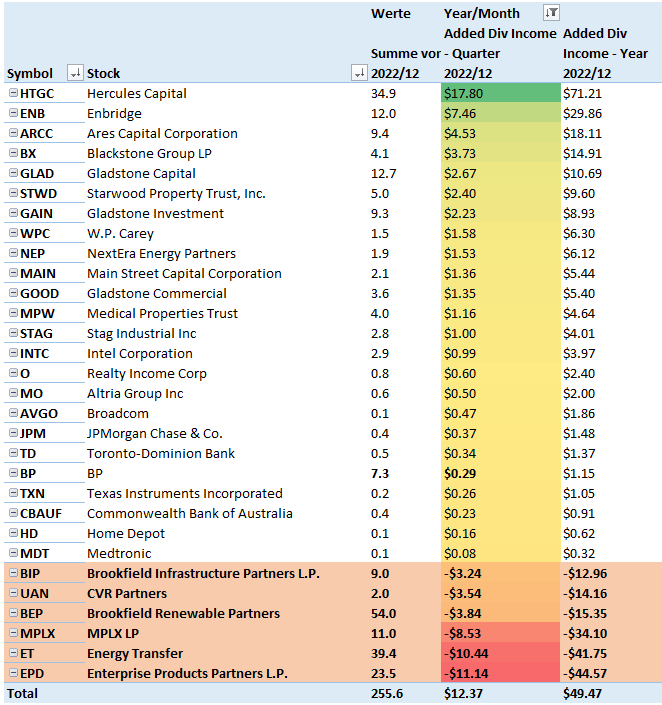
All net purchases in December can be found below:
December 2022 Net Purchases (Designed by author)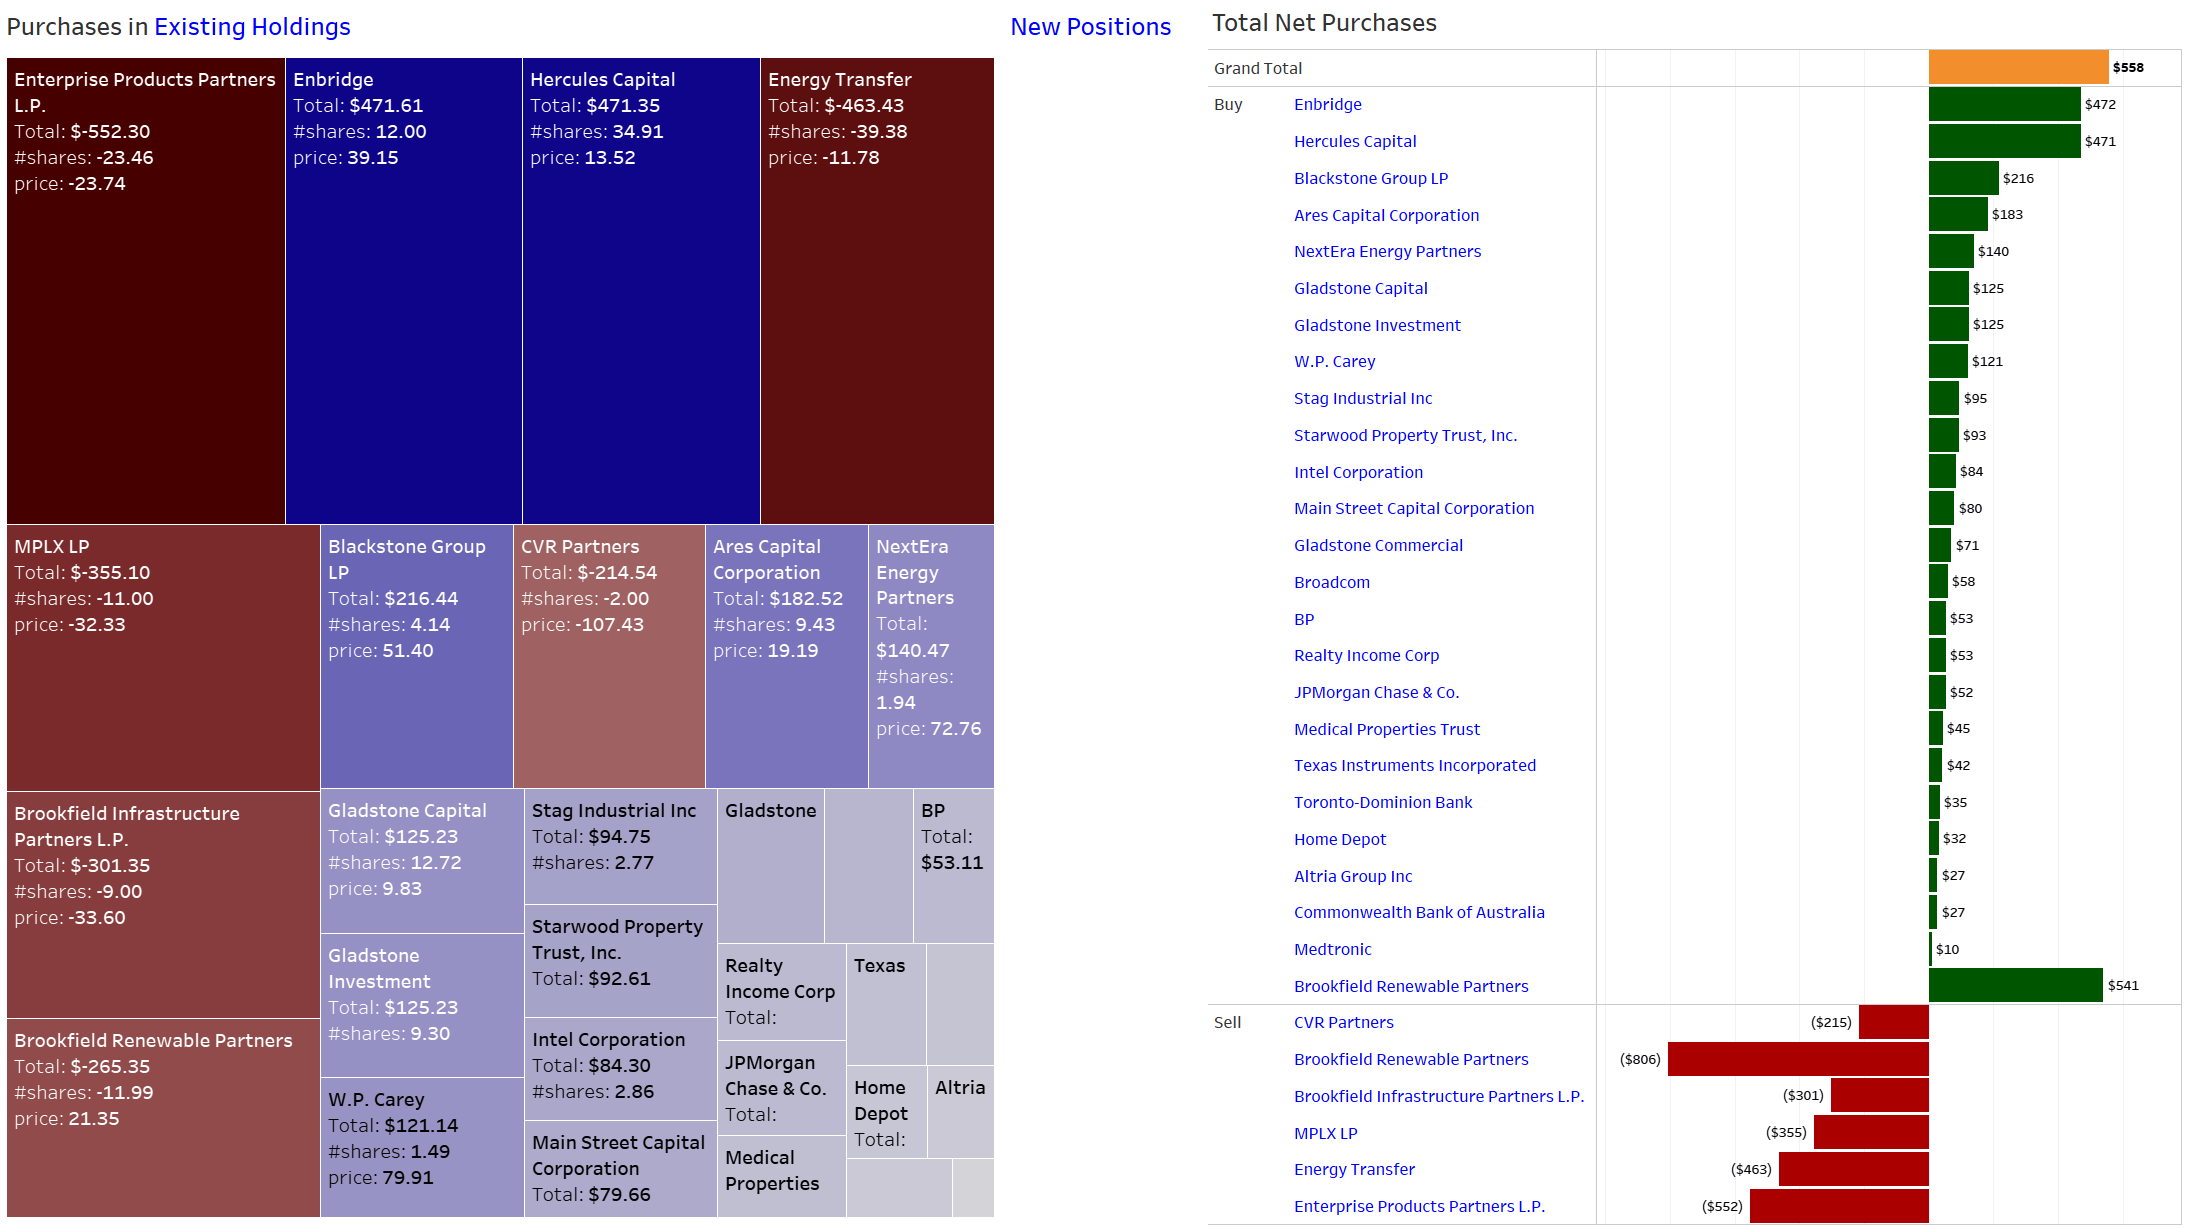
Dividend Income: What Happened on the Dividend Side?
Dividend income hit a new December record of $699 and is up an explosive 60% annually and down 9% sequentially. Adjusting these figures for the semi-annual dividend payment of the Commonwealth Bank of Australia (OTCPK:CBAUF) sequential income is up a very solid 8% fueled by dividend gains driven by ongoing investments across a variety of stocks.
On an annual basis, the biggest income driver is the Ares Capital (ARCC), a stock I am running on a bi-weekly savings plan and where my contributions quickly translated into meaningful dividend income. The goal was to accumulate that position until it generates at least $100 in quarterly dividends which is a psychologically important level for me that no single stock has reached so far on a quarterly basis. Now that this goal has been reached, thanks to the unexpected dividend hike by ARCC, the next goal will be $150 in quarterly dividend income.
October 2022 Dividend Income (Designed by author)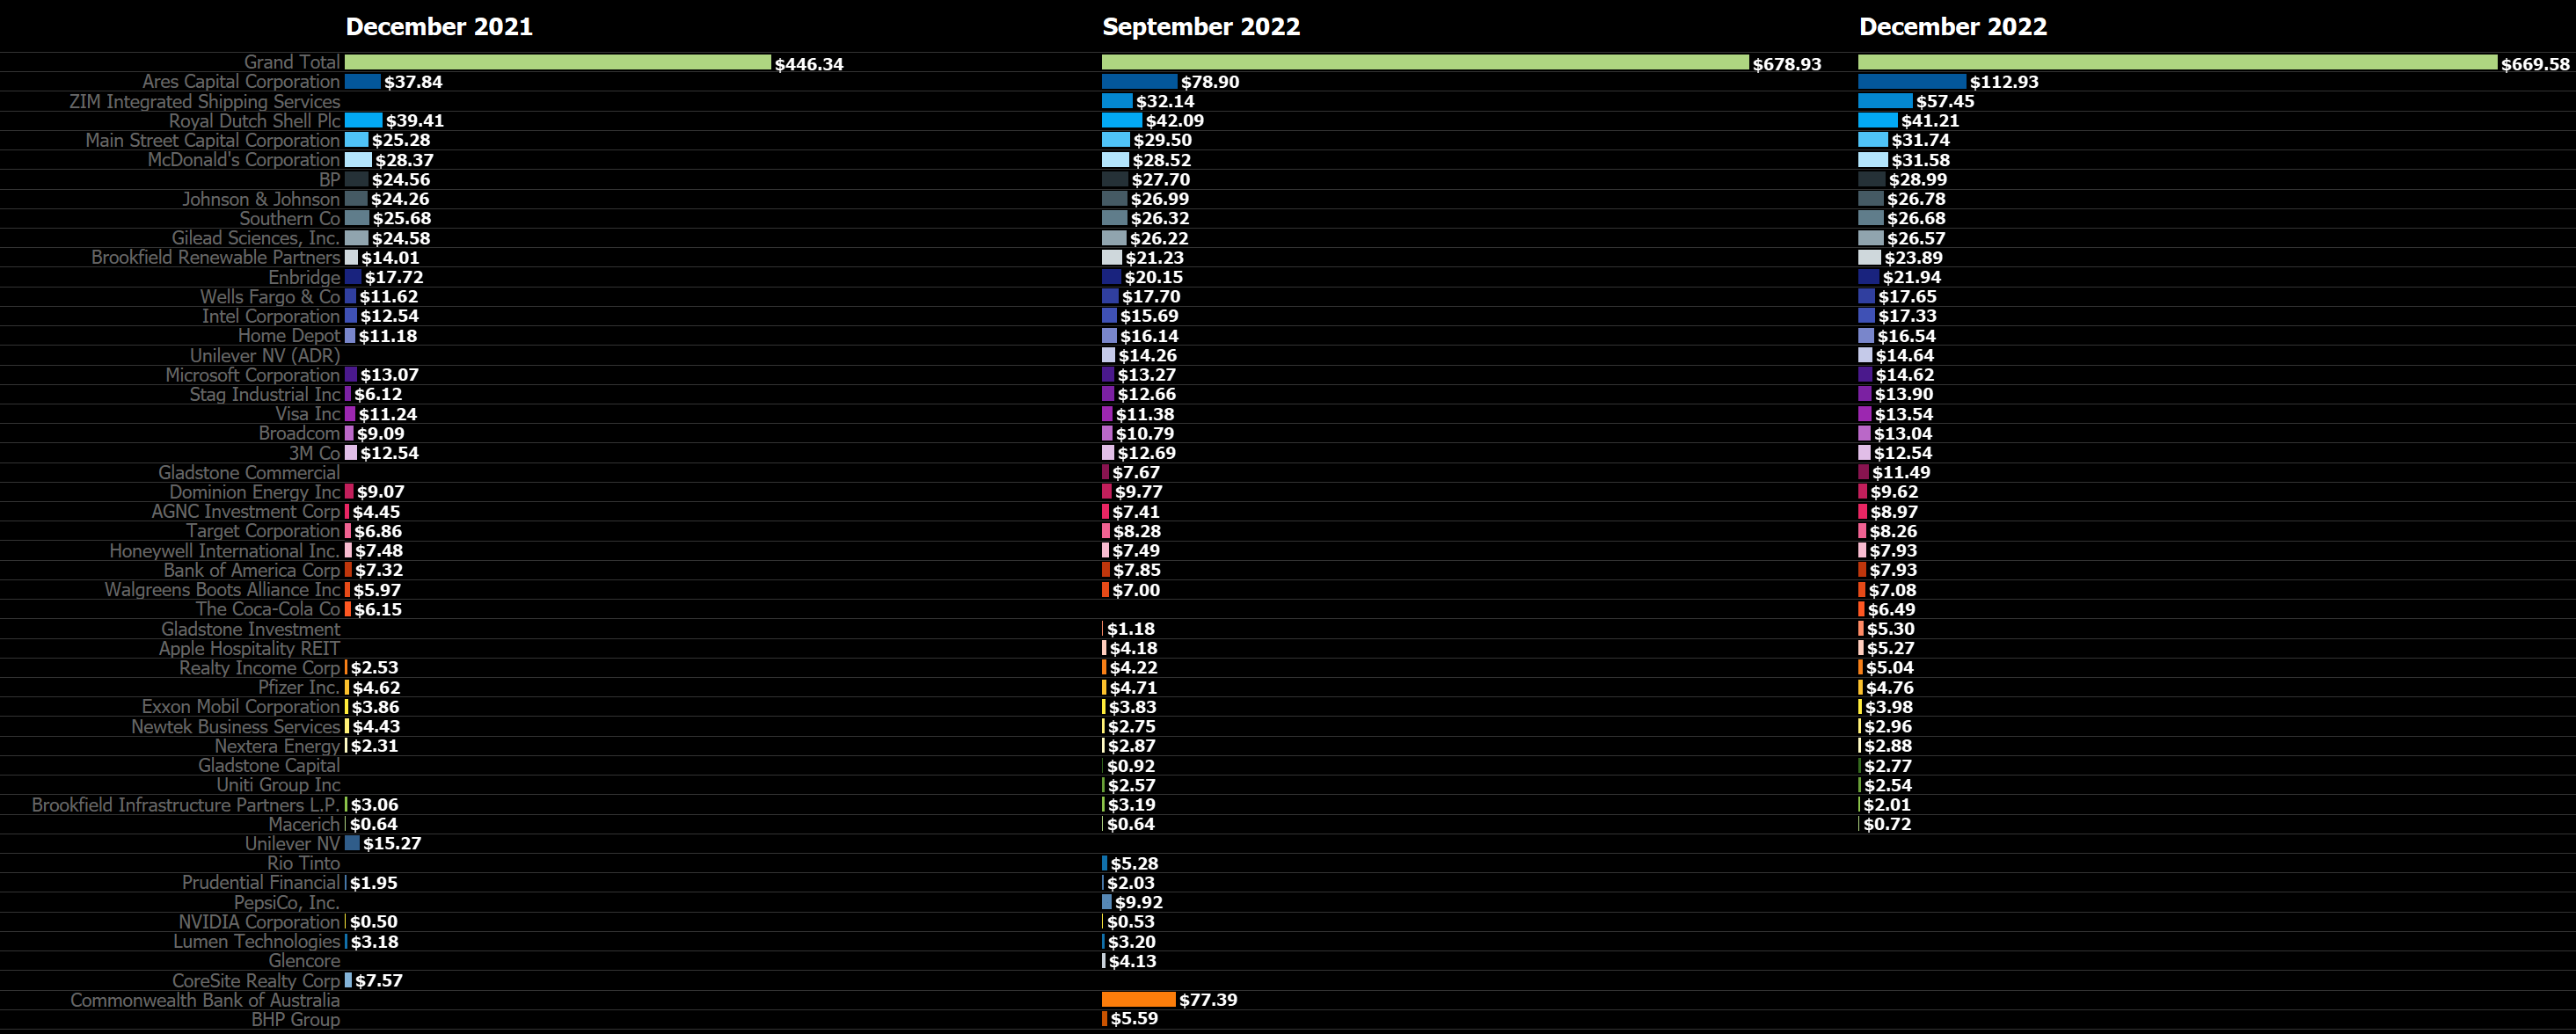
The growing share of ARCC dividends can also be seen when just looking at the top three dividend payers in September and the other quarter-ending months. After two years where the average dividend from the top three 3 stocks didn’t reach past heights, March, June, September and December 2022 each set new all-time records with an average dividend from those three stocks together worth $145 on average on a 2022 YTD basis and amounting to a total of $186 for December 2022 as seen below:
Top 3 Dividend Payers (Designed by author)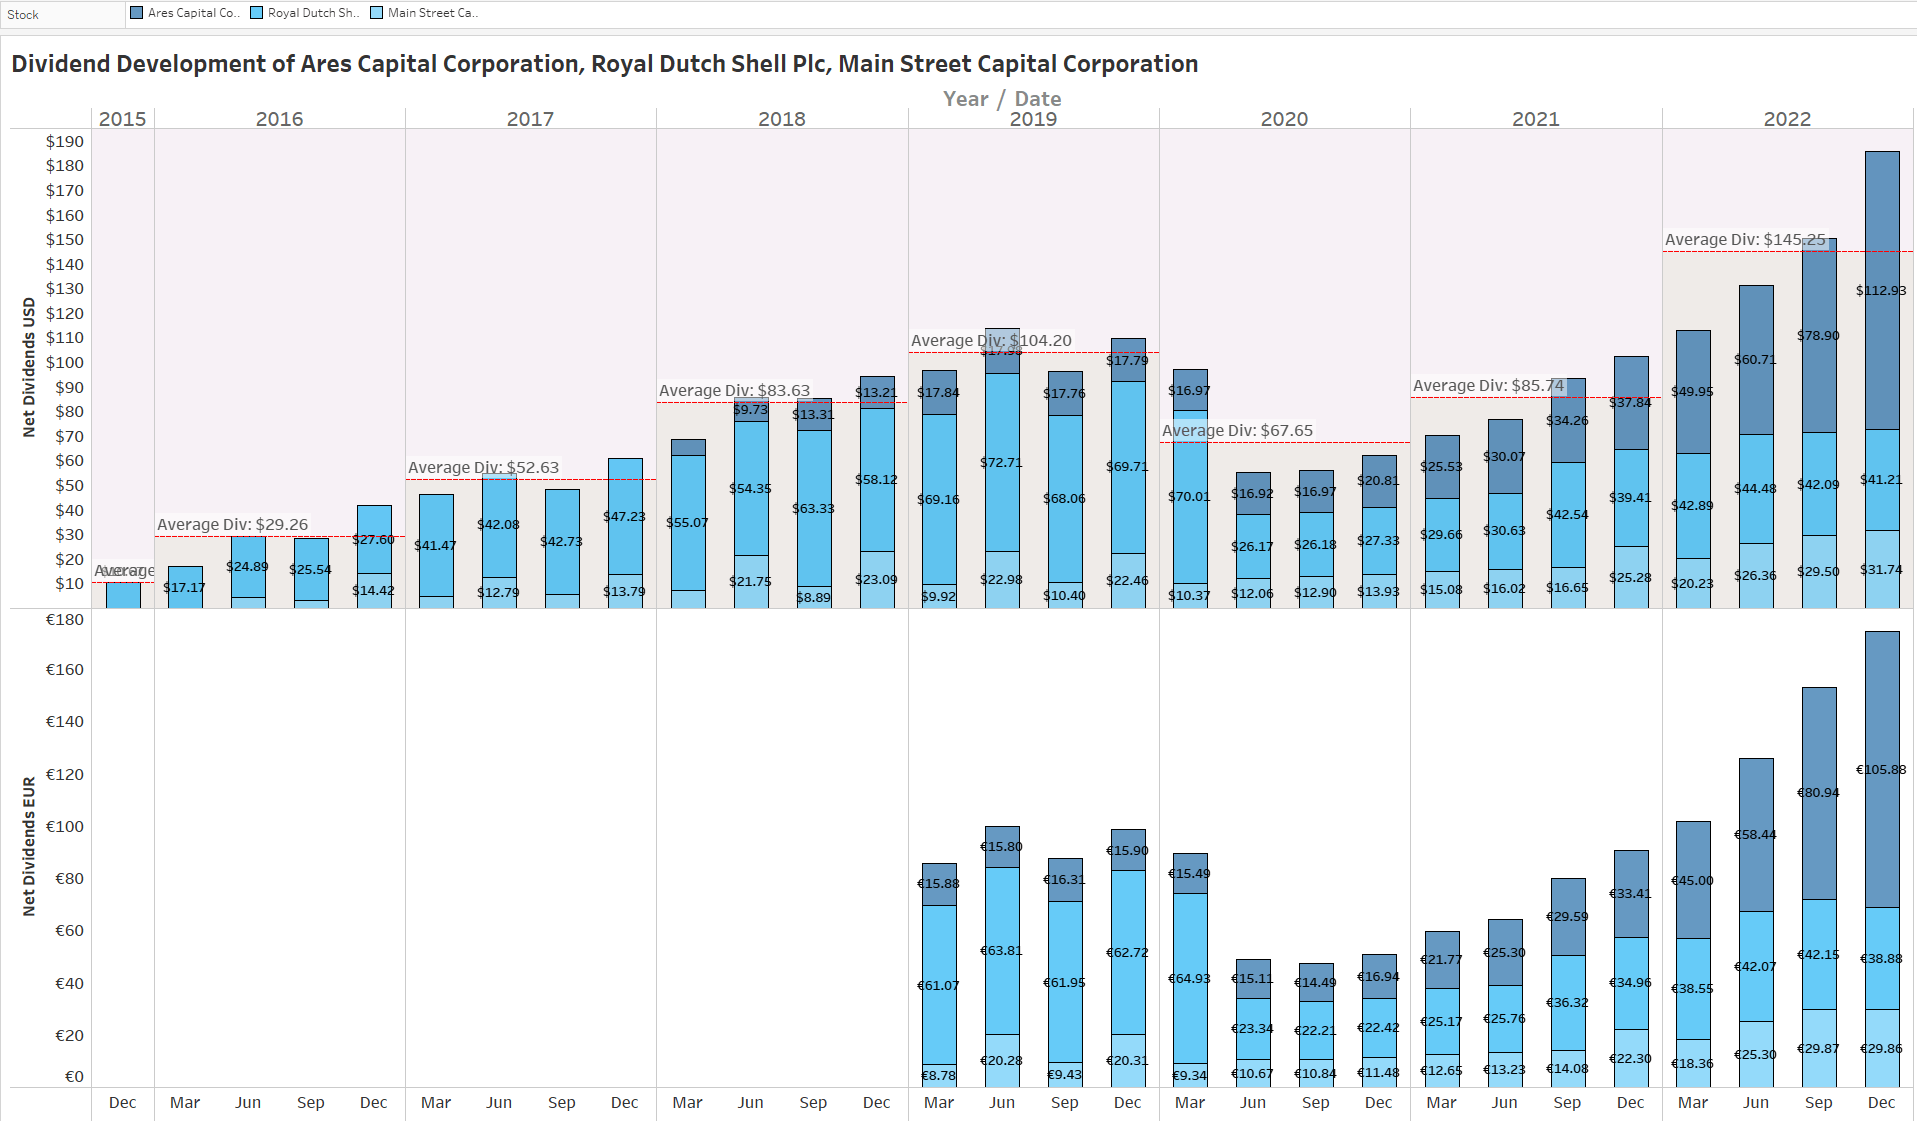
Here is a chart that shows the development of my net dividend income by month over time between 2015 and 2022. You can see the growth of my dividend income and the average annual dividend for each year:
All-time Dividend Development (Designed by author)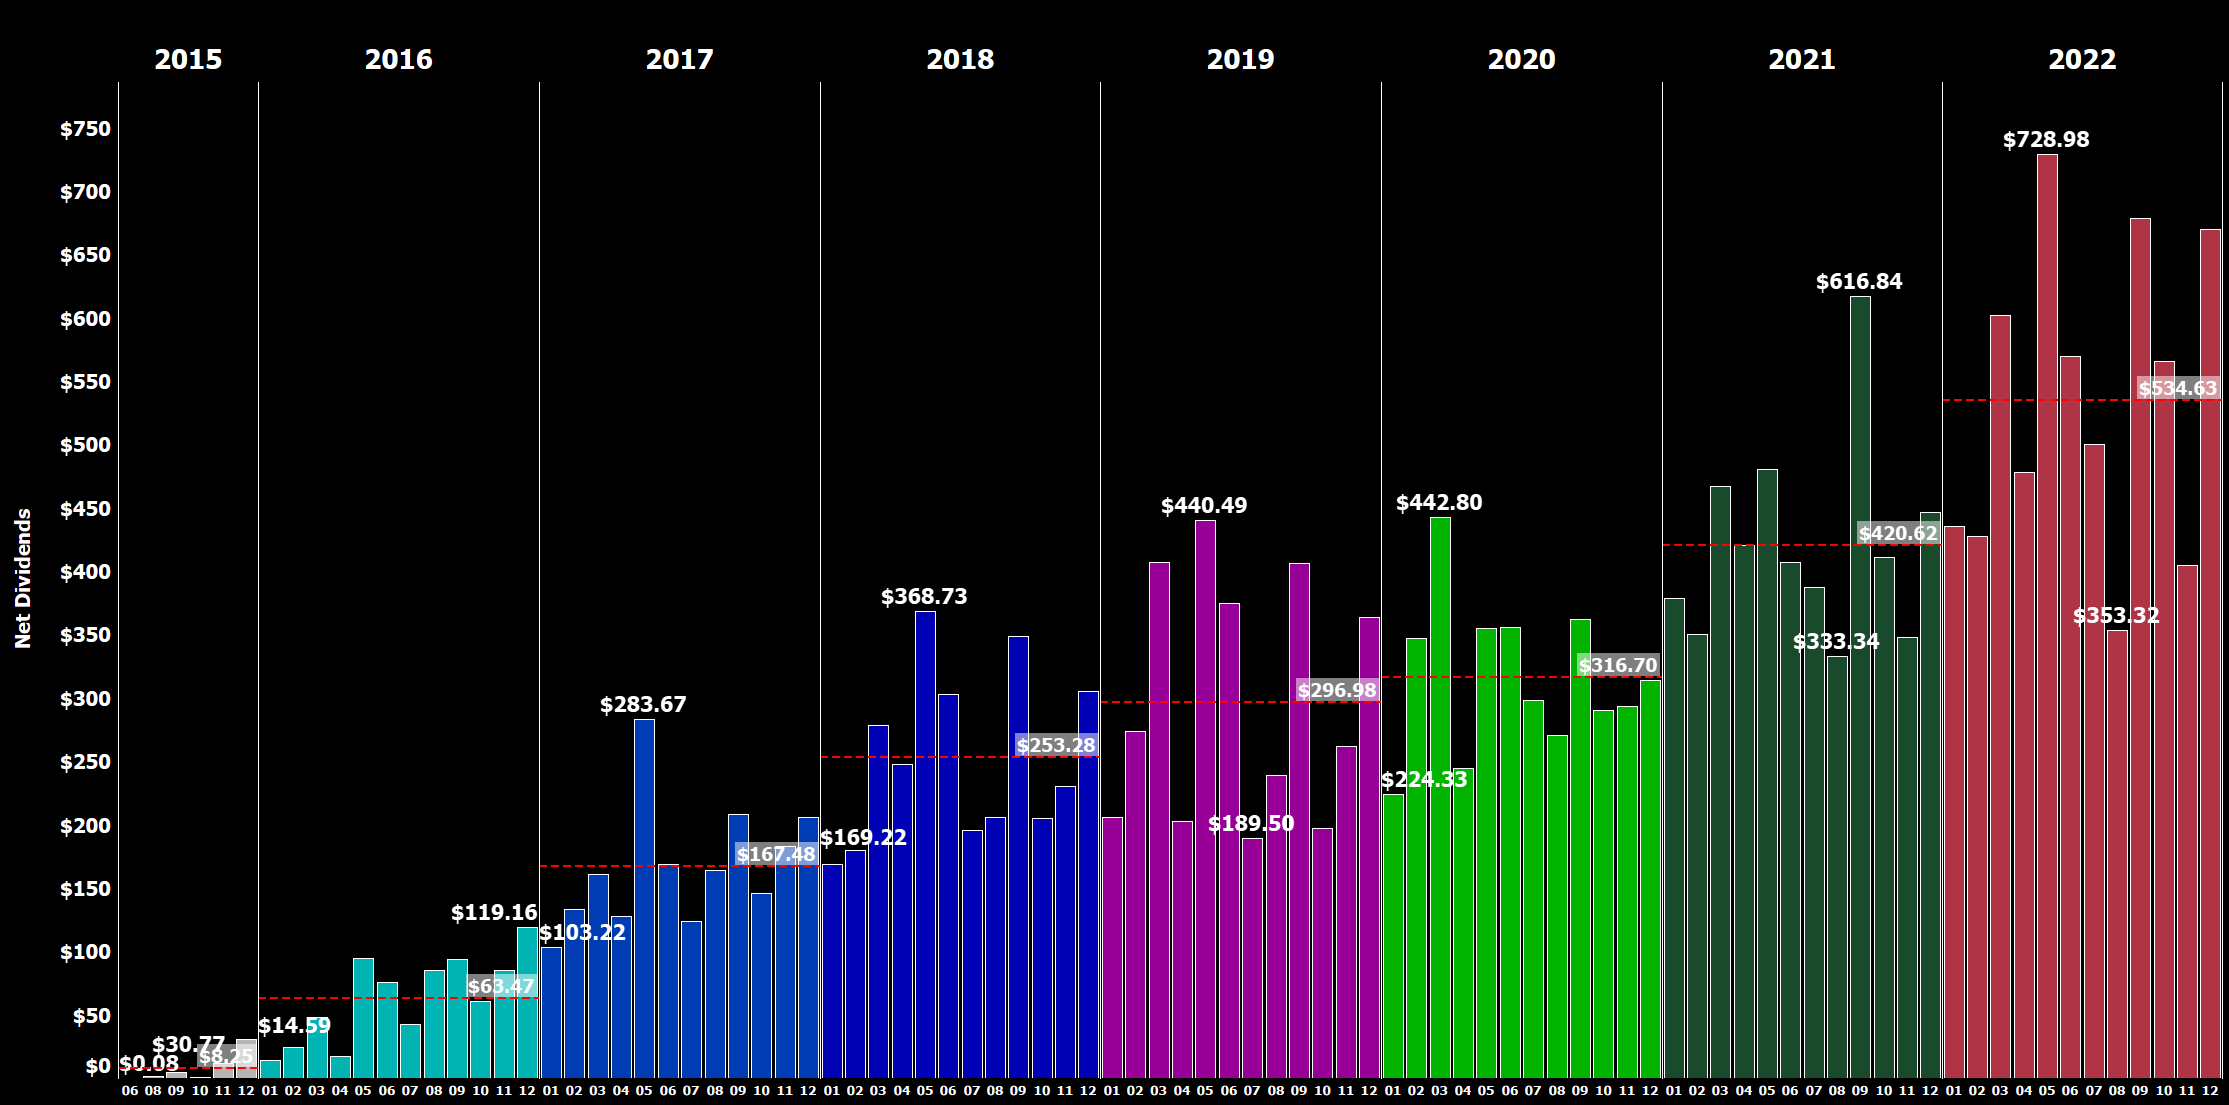
This chart is my favorite because it illustrates the progression of my dividend income over time and allows me to easily see the average annual dividend for each year.
Next, I have plotted all of the individual dividend payments I have received, coloring them by year and arranging the years side by side instead of horizontally as in previous updates. This visualization allows for a more comprehensive analysis of the distribution of my dividend payments over time.
Dividend Bubbles (Designed by author)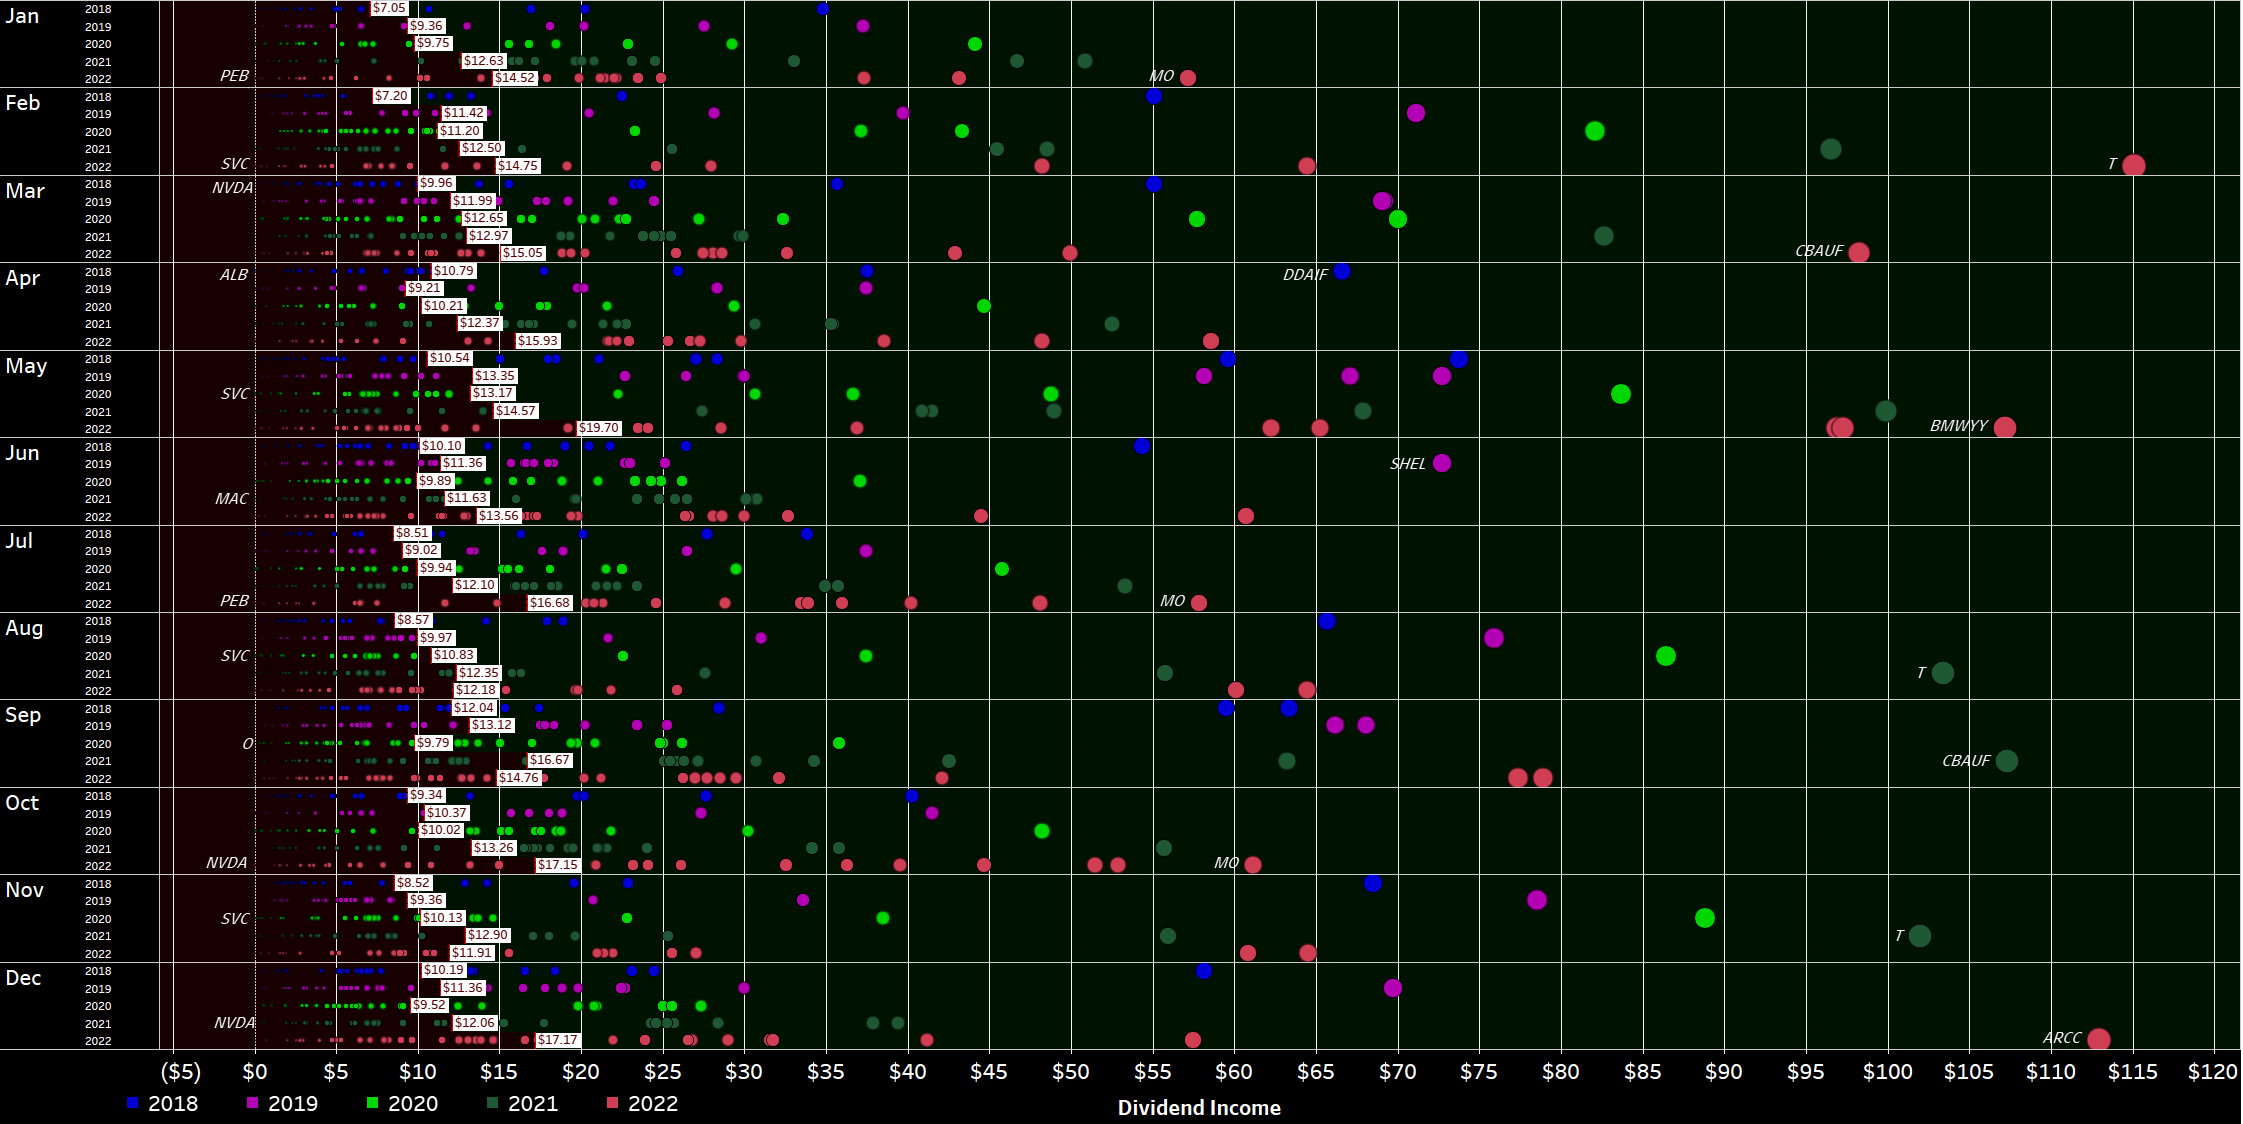
By plotting the data in this way, we can easily see the distribution of dividend payments across different years and gain insights into the overall growth of my dividend income over time.
This visualization is initially quite cluttered, but it contains a wealth of information. It shows every individual dividend payment I have received since I began my investment journey in 2015, represented as a circle that is colored and sized according to its contribution. The view is organized by month and year, allowing for a more comprehensive analysis of the development of my dividend income over time. For each year and month, a white rectangle indicates the average monthly dividend. The area where dividends fall below the average is filled in dark red, while the area above the average is colored dark green. I greatly prefer this redesigned version of my old “bubbles chart” because it makes it much easier to identify trends and developments in my dividend income. This type of data visualization allows for a detailed examination of the distribution of my dividend payments over time and enables me to more easily identify trends and patterns in my income growth.
December 2022 Dividends (Designed by author)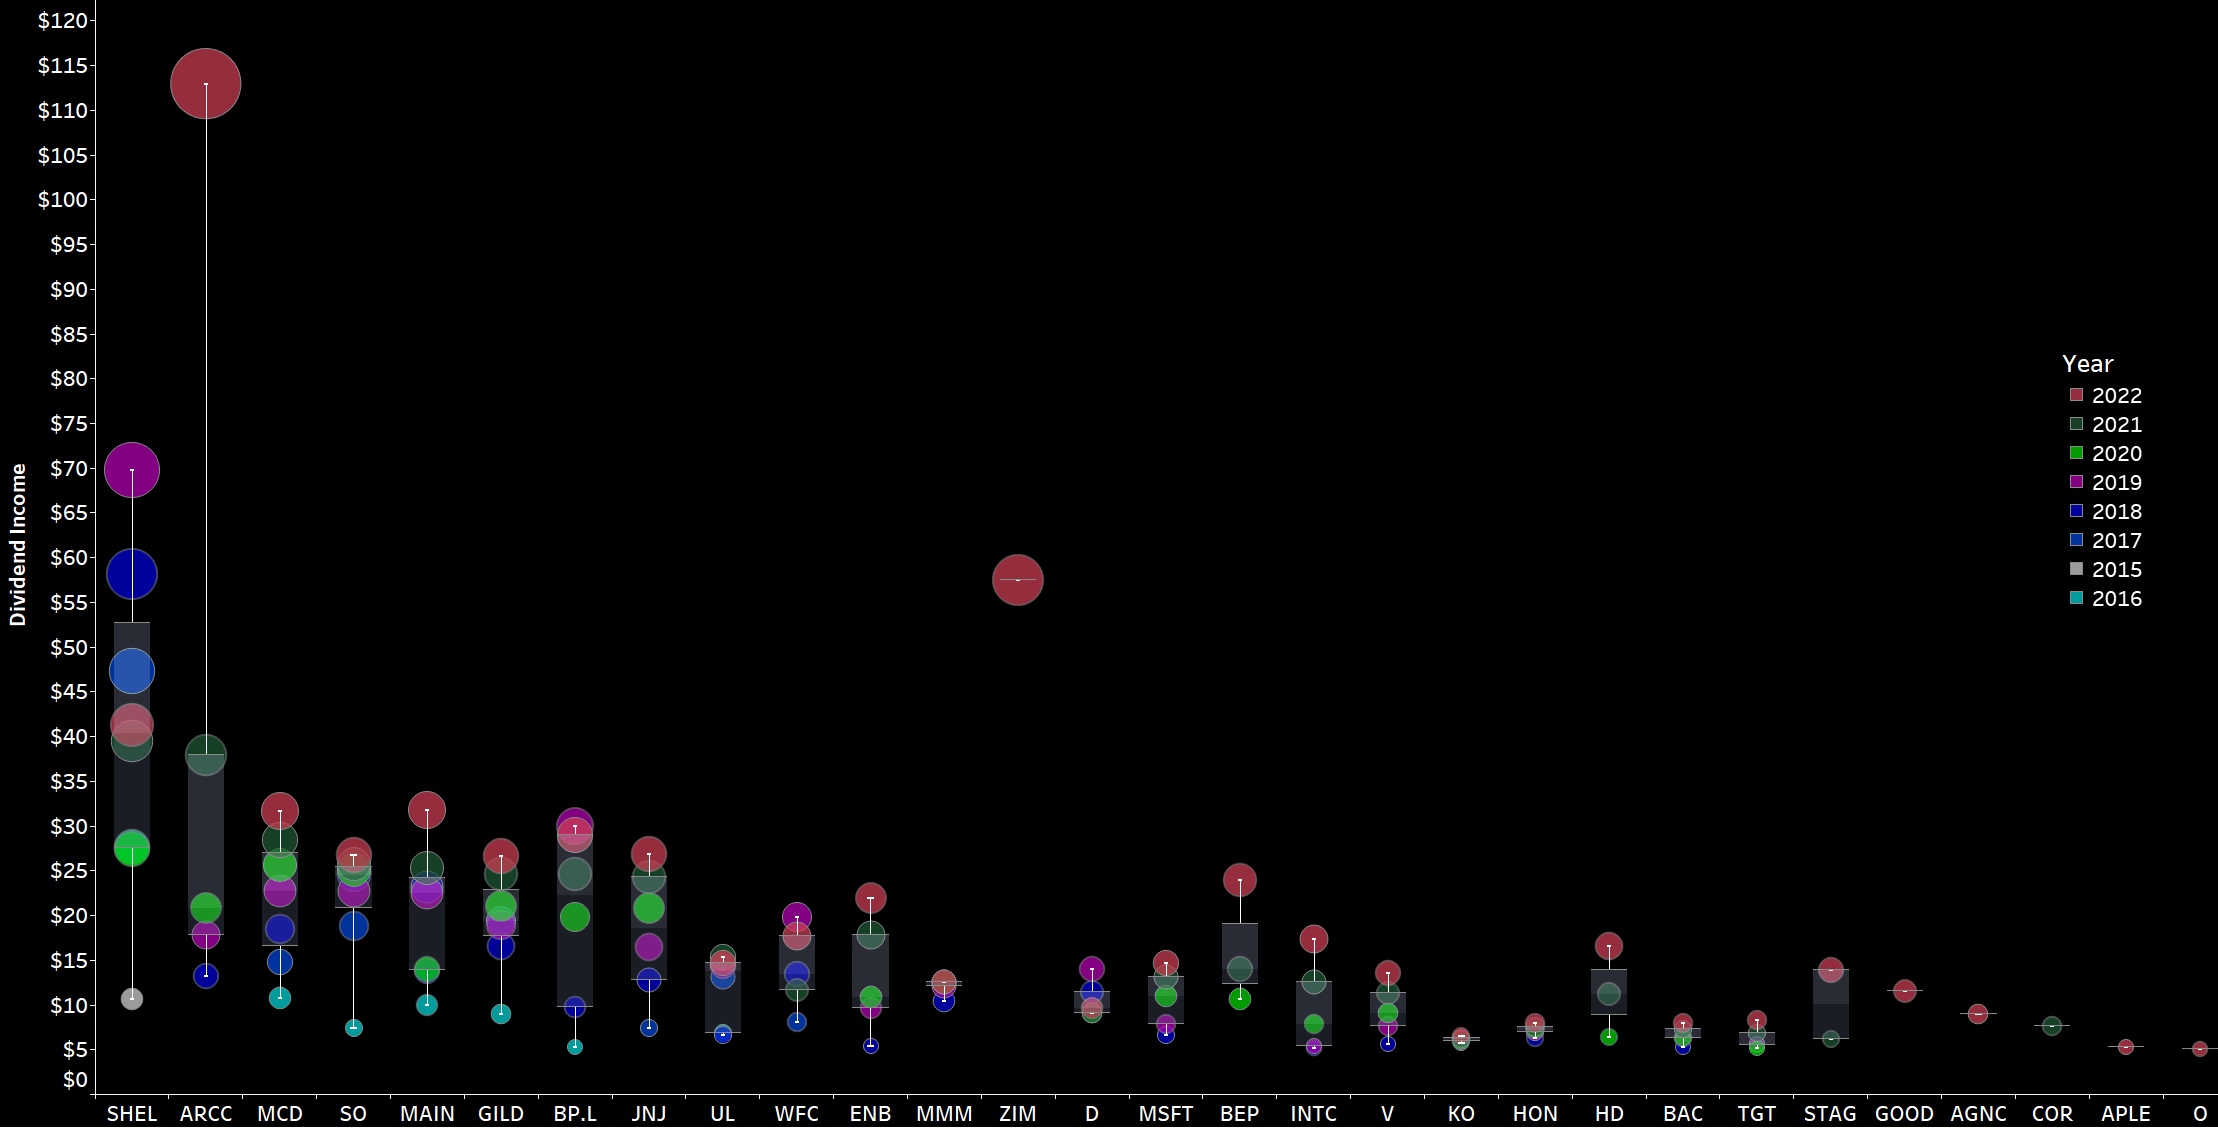
Now, zooming in on December, we can immediately see a number of big green circles in a sea of black. The bigger the circle and the bigger the distance to the previous circle for the same stock, the bigger is the change in dividend income compared to the prior years.
The importance of Ares Capital Corporation is clear, with a reddish circle indicating the massive jump in dividend income over the last 12 months due to heavy ongoing monthly investments. Ares Capital just raised its dividend by double-digits and while I don’t expect that to become the norm, I am more than happy with its current yield and have no plans to stop these monthly savings plans. By the end of the year December 2023 dividends should be somewhere between $150 and $200 I assume.
Overall, I aim to see as many big red circles at the top of the scale as possible, as this indicates rising dividend income. .
Another way to express the monthly dividend income is in terms of Gifted Working Time (GWT). Assuming an average hourly rate of $30.8 for 2022, my GWT and annual net dividends have been as follows:
- 2018: 121 hours GWT, $3,000 in annual net dividends
- 2019: 142 hours GWT, $3,600 in annual net dividends
- 2020: 152 hours GWT, $3,800 in annual net dividends
- 2021: 180 hours GWT, $5,050 in annual net dividends
- 2022: Targeting at least 179 hours GWT, $5,500 in annual net dividends
I expect overall GWT to decrease in 2022 due to higher calculated hourly rates, as I project a 10% increase in the hourly rate due to inflation. My initial target for the year was conservative, as I needed more visibility into how the year was progressing, particularly with ongoing monthly investments expected to decline due to elevated stock levels and rising inflationary and geopolitical pressures.
Across the years, my YTD Dividend Race has been as follows:
- 2018: Disappointing
- 2019: Phenomenal, benefiting from a low baseline in the prior year
- 2020: Fairly disappointing
- 2021: Phenomenal
- 2022: Targeting a conservative high single-digit growth rate
With the year now closed, I am very happy not only to have reached my annual goal of $5,500 in net dividends but actually vastly exceeded it with realized net dividends for the full year of $6,415. I haven’t yet finalized my target for 2023 but I would expect it to be well above $7,000 and probably closer to the next $8,000 than $7,000. That also means that the next major milestone and the biggest by far of reaching a 5-digit level of passive income is likely to be reached within the next 2-3 years.
YTD Dividend Growth (Designed by author)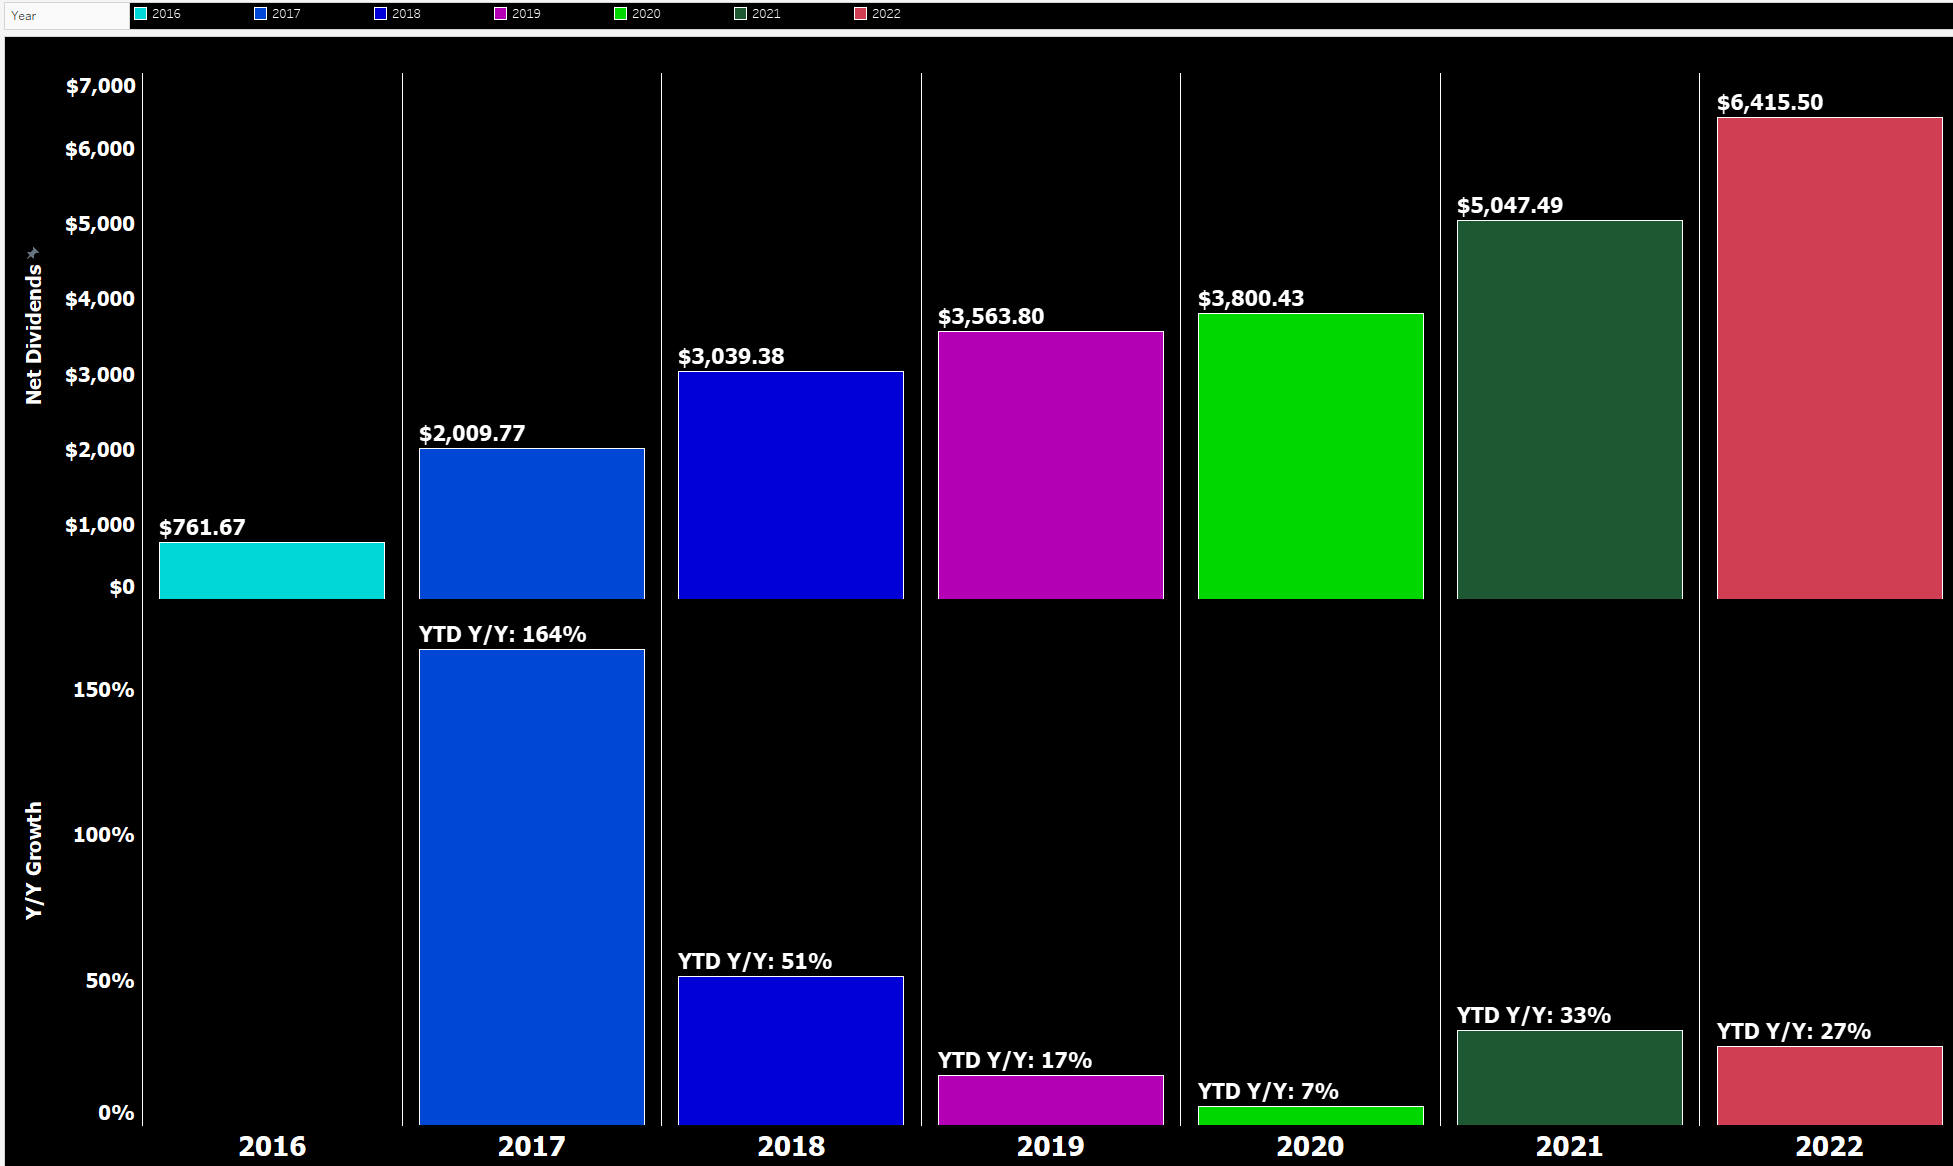
I have updated the YTD Dividend Race chart to show the development of YTD dividend income on a daily basis, allowing us to see that most of my dividend income is generated mid-month and towards the end of the month. The chart also breaks down the development by month for the current year, making it easy to identify significant jumps in income. The old format of the chart is shown in the top left.
YTD Dividend Race (Designed by Author)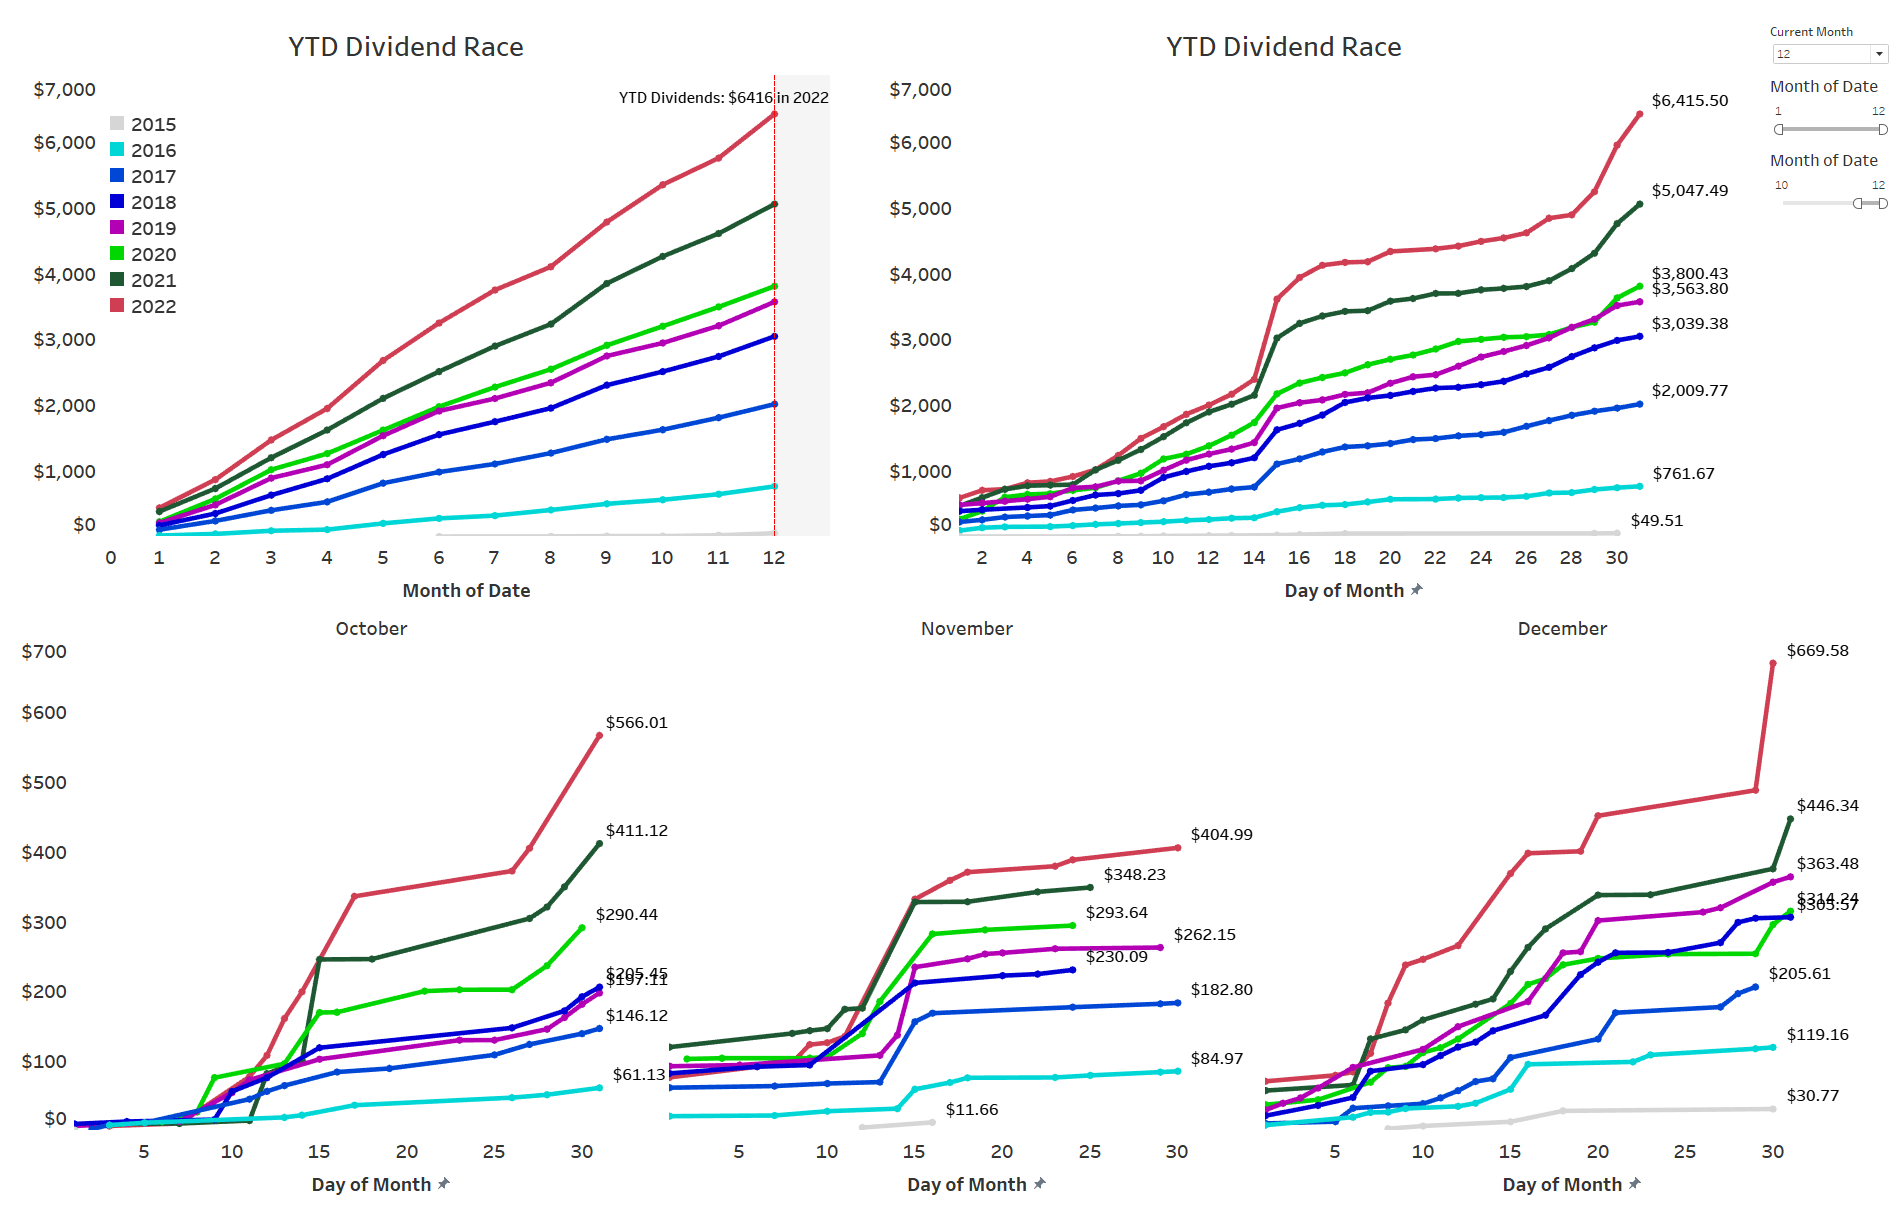
Expressed in GWT, it presents itself as follows:
Gifted Working Time in Hours (Designed by author)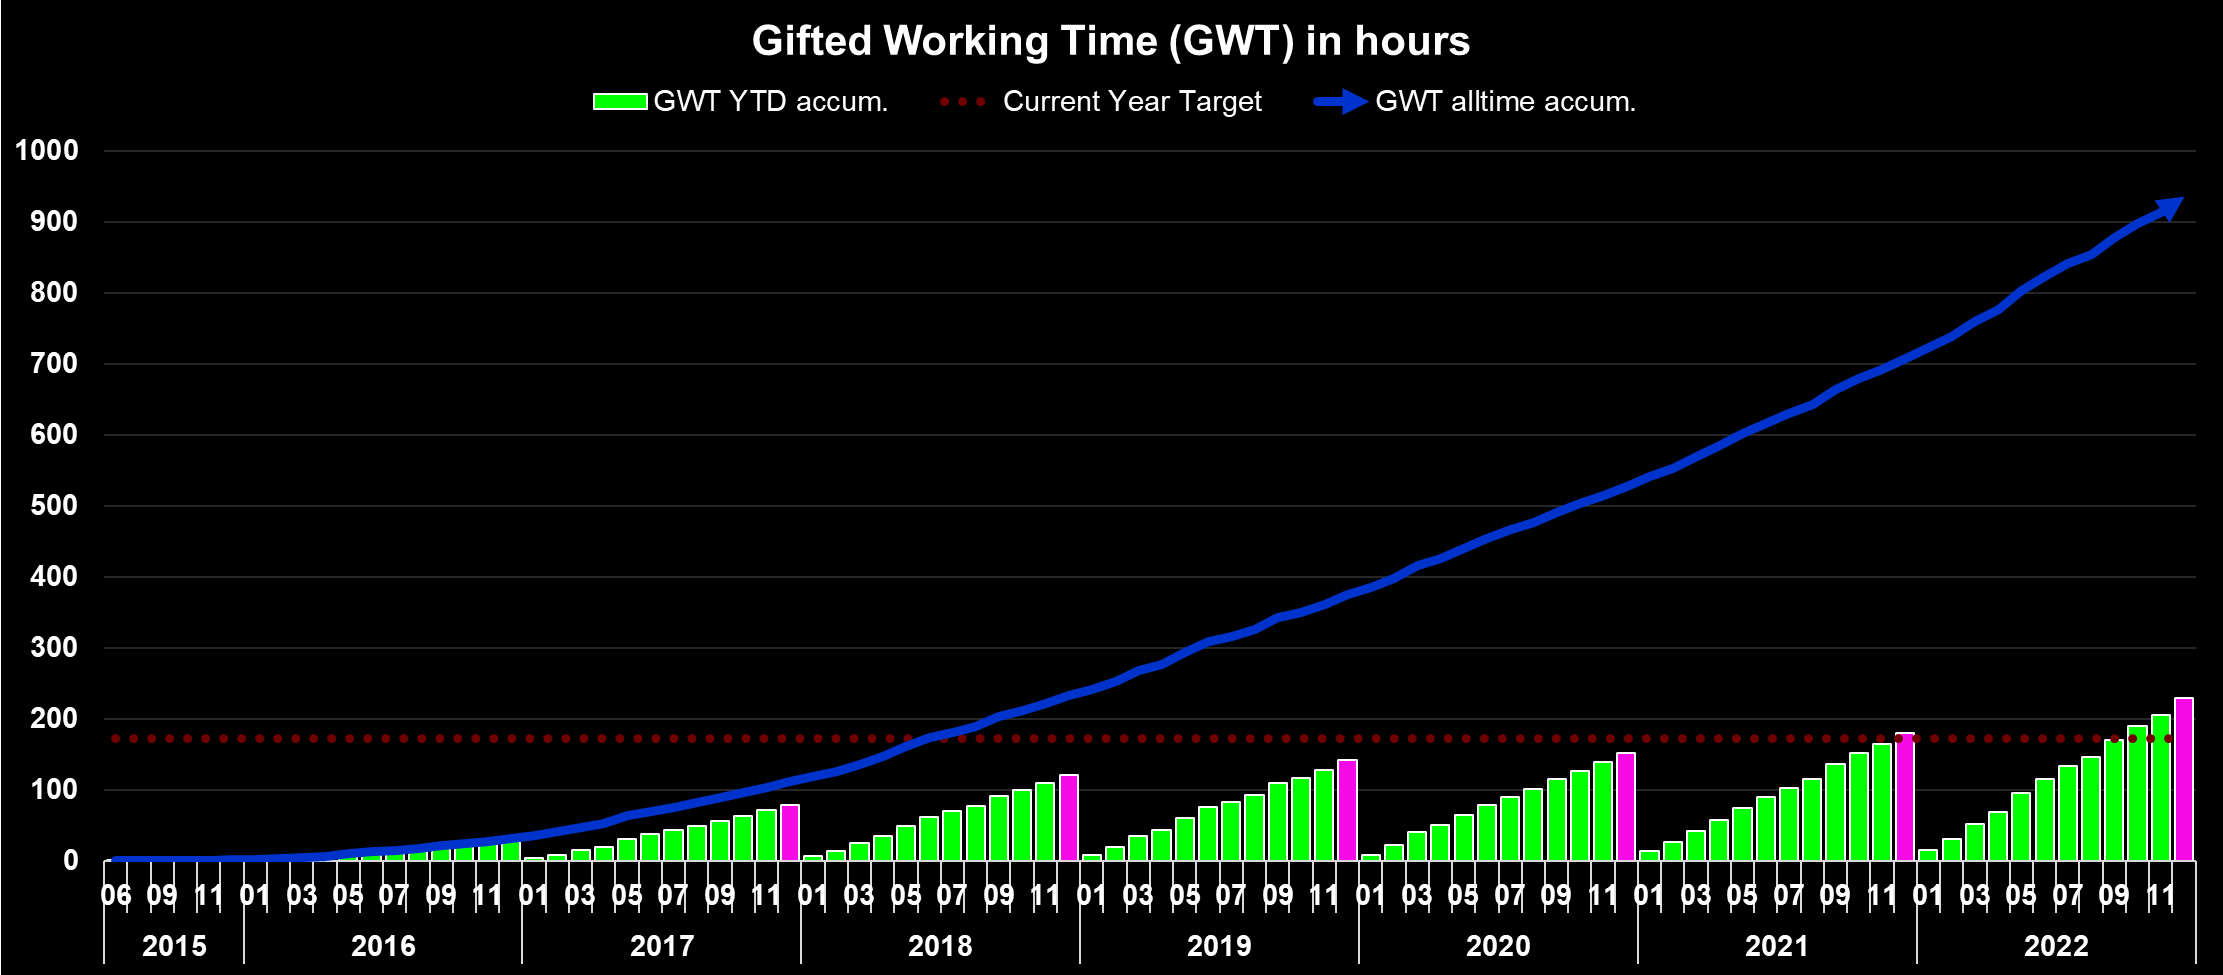
What this shows is as follows:
- All time (blue area) – Around 936 hours, or 117 days, of active work have been replaced with passive income since the start of my dividend journey. Assuming a five-day workweek, this translates into more than 23 weeks of vacation funded via dividends.
- Full-year 2022 (green bars) – Around 229 hours, or 28.6 days, of active work have been replaced with passive income in 2022 already, which almost an entire month funded with dividends or to put differently my passive income amount gifted me an entire month.
- Highlighted in pink is the accumulated YTD total at the end of the current reporting month (December).
This visualization allows us to see the overall impact of my dividend income on the amount of active work I am able to replace with passive income. It also enables us to see the progress made year-to-date, as well as the accumulated total at the end of the current reporting month.
Upcoming January Dividends
As every month, January is packed with dividend payments heavily concentrated around the 15th and at month-end when the dividend checks from Canada’s big banks as well as JPMorgan will be arriving over a period of just 3-4 days.
Given the majority of my savings plans feature companies that pay dividends in January such as W. P. Carey, Altria (MO), Cisco Systems (CSCO), JPMorgan, Toronto-Dominion Bank, Bank of Nova Scotia, Stryker (SYK), Medtronic (MDT) as well as ongoing investments into stocks like Rithm Capital (RITM) and Annaly Capital (NLY), it surely is going to be a big month that should easily set a new all-time dividend record for the month of January.
The snapshot below is taken from my free-for-all released Dividend Calendar (make sure to follow instructions in the video) and shows my expected dividend payments in January.
My Dividend Calendar (Designed by Author)
At the end of December, my dividend portfolio is composed as follows:
| Company Name | Ticker | % Market Value | Market Value (€) |
| Apple Inc. | (AAPL) | 9.47% | 16,642 |
| AbbVie Inc | (ABBV) | 4.43% | 7,786 |
| Visa Inc | (V) | 4.31% | 7,569 |
| McDonald’s Corp | (MCD) | 3.70% | 6,508 |
| Microsoft Corporation | (MSFT) | 3.19% | 5,612 |
| Cisco Systems, Inc. | (CSCO) | 2.94% | 5,170 |
| Johnson & Johnson | (JNJ) | 2.83% | 4,972 |
| W. P. Carey | (WPC) | 2.50% | 4,403 |
| AT&T Inc. | (T) | 2.47% | 4,350 |
| Ares Capital | (ARCC) | 2.25% | 3,953 |
| Shell | (SHEL) | 2.21% | 3,878 |
| STAG Industrial Inc | (STAG) | 2.15% | 3,777 |
| Main Street Capital | (MAIN) | 2.14% | 3,768 |
| JPMorgan Chase & Co. | (JPM) | 2.07% | 3,633 |
| Gilead Sciences, Inc. | (GILD) | 1.96% | 3,453 |
| Southern Co | (SO) | 1.86% | 3,267 |
| Texas Instruments Incorporated | (TXN) | 1.85% | 3,257 |
| Home Depot | (HD) | 1.83% | 3,216 |
| Altria Group Inc | (MO) | 1.78% | 3,135 |
| Toronto-Dominion Bank | (TD) | 1.69% | 2,971 |
| Wells Fargo & Co | (WFC) | 1.65% | 2,907 |
| Allianz SE | (OTCPK:ALIZF) | 1.56% | 2,738 |
| Medical Properties Trust | (MPW) | 1.55% | 2,718 |
| Bank of Nova Scotia | (BNS) | 1.38% | 2,427 |
| Siemens Healthineers | (OTCPK:SEMHF) | 1.34% | 2,350 |
| Commonwealth Bank of Australia | (OTCPK:CBAUF) | 1.28% | 2,258 |
| NVIDIA Corporation | (NVDA) | 1.21% | 2,132 |
| Enbridge | (ENB) | 1.19% | 2,099 |
| BMW | (OTCPK:BMWYY) | 1.12% | 1,970 |
| Blackstone Inc. | (BX) | 1.08% | 1,904 |
| PepsiCo, Inc. | (PEP) | 1.06% | 1,870 |
| Broadcom Inc | (AVGO) | 1.04% | 1,828 |
| Morgan Stanley | (MS) | 1.01% | 1,769 |
| Procter & Gamble Co | (PG) | 0.99% | 1,745 |
| Rithm Capital Corp. | (RITM) | 0.98% | 1,727 |
| Gladstone Commercial Corporation | (GOOD) | 0.90% | 1,586 |
| Philip Morris International Inc. | (PM) | 0.90% | 1,577 |
| Honeywell International Inc. | (HON) | 0.87% | 1,534 |
| Intel Corporation | (INTC) | 0.87% | 1,525 |
| BP1 | (BP) | 0.85% | 1,500 |
| BP2 | (BP) | 0.85% | 1,492 |
| Bank of America Corp | (BAC) | 0.77% | 1,355 |
| Annaly Capital Management | (NLY) | 0.75% | 1,327 |
| STORE Capital | (STOR) | 0.73% | 1,283 |
| Daimler | (OTCPK:DTRUY) | 0.73% | 1,280 |
| Starwood Property Trust, Inc. | (STWD) | 0.71% | 1,244 |
| Realty Income Corp | (O) | 0.67% | 1,179 |
| The Coca-Cola Co | (KO) | 0.63% | 1,113 |
| Target Corporation | (TGT) | 0.62% | 1,094 |
| 3M Co | (MMM) | 0.62% | 1,093 |
| Hercules Capital | (HTGC) | 0.59% | 1,039 |
| NextEra Energy Partners LP | (NEP) | 0.58% | 1,014 |
| Unilever NV ADR | (UL) | 0.57% | 998 |
| Stryker | (SYK) | 0.52% | 922 |
| CVS Health Corp | (CVS) | 0.51% | 895 |
| Dominion Energy Inc | (D) | 0.48% | 846 |
| Royal Bank of Canada | (RY) | 0.48% | 844 |
| Apple Hospitality REIT | (APLE) | 0.48% | 837 |
| Verizon Communications Inc. | (VZ) | 0.44% | 772 |
| Brookfield Renewable Partners | (BEP) | 0.44% | 767 |
| BASF | (OTCQX:BASFY) | 0.39% | 687 |
| Pfizer Inc. | (PFE) | 0.37% | 644 |
| Sino AG | (XTP.F) | 0.36% | 641 |
| NextEra Energy | (NEE) | 0.36% | 640 |
| AGNC Investment Corporation | (AGNC) | 0.36% | 635 |
| Walgreens Boots Alliance Inc | (WBA) | 0.35% | 624 |
| Medtronic | (MDT) | 0.33% | 586 |
| Canadian Imperial Bank of Commerce | (CM) | 0.33% | 584 |
| Exxon Mobil Corporation | (XOM) | 0.32% | 568 |
| Spirit Realty Corporation | (SRC) | 0.30% | 536 |
| General Electric Company | (GE) | 0.30% | 533 |
| Antero Midstream Corporation | (AM) | 0.30% | 524 |
| B&G Foods, Inc. | (BGS) | 0.28% | 487 |
| Kinder Morgan Inc | (KMI) | 0.28% | 487 |
| Apollo Commercial Real Est. Finance Inc | (ARI) | 0.26% | 452 |
| Alibaba Group Holding Ltd | (BABA) | 0.23% | 411 |
| MidCap Financial Investment Corp | (MFIC) | 0.20% | 358 |
| Colgate-Palmolive Company | (CL) | 0.20% | 351 |
| ZIM Integrated Shipping Services | (ZIM) | 0.20% | 349 |
| SIXT | (OTC:SXTSY) | 0.19% | 336 |
| Mastercard | (MA) | 0.19% | 328 |
| Omega Healthcare Investors Inc | (OHI) | 0.17% | 300 |
| BRT Apartment Corp | (BRT) | 0.17% | 296 |
| Bayer AG | (OTCPK:BAYZF) | 0.17% | 296 |
| Vonovia | (OTCPK:VONOY) | 0.14% | 255 |
| Fresenius SE | (OTCPK:FSNUF) | 0.09% | 155 |
| Blue Owl Capital | (OWL) | 0.08% | 138 |
| Boeing | (BA) | 0.07% | 128 |
| Uniti Group Inc | (UNIT) | 0.06% | 102 |
| Equitrans Midstream Corporation | (ETRN) | 0.05% | 83 |
| Bank of Montreal | (BMO) | 0.05% | 82 |
| Walt Disney Co | (DIS) | 0.05% | 79 |
| Newtek Business Services | (NEWT) | 0.04% | 74 |
| The GEO Group Inc | (GEO) | 0.04% | 68 |
| Fresenius Medical Care | (FMS) | 0.03% | 60 |
| Service Properties Trust | (SVC) | 0.02% | 32 |
| Diversified Healthcare Trust | (DHC) | 0.01% | 26 |
Editor’s Note: This article discusses one or more securities that do not trade on a major U.S. exchange. Please be aware of the risks associated with these stocks.
Be the first to comment