

landbysea/iStock via Getty Images
Introduction
Murphy Oil Corp. (NYSE:MUR) released fourth-quarter and full-year 2021 results on January 27, 2022.
1 – 1Q22 Results Snapshot
The company posted a first-quarter 2022 adjusted net income, which excludes discontinued operations and other one-off items, was $113.34 million, or $0.73 net income per diluted share, compared to a loss of $1.87 in 1Q21.
MUR 1Q22 financial snapshot Presentation (Murphy Oil)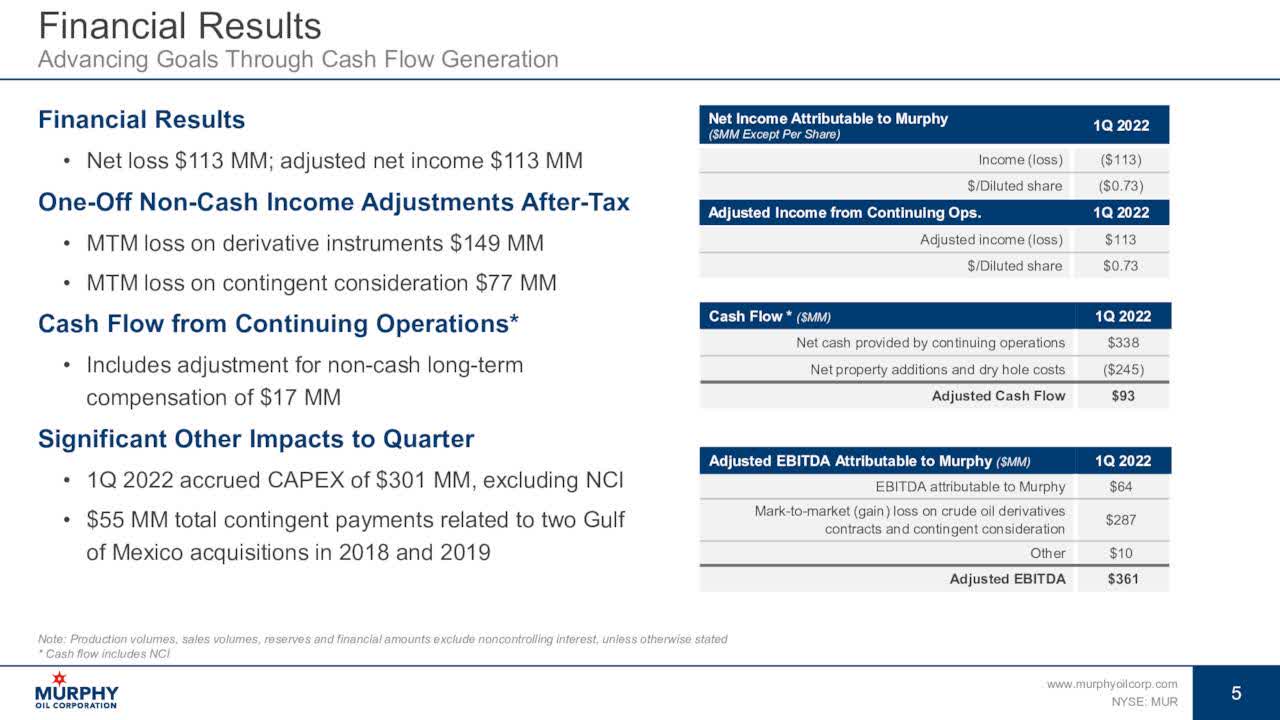
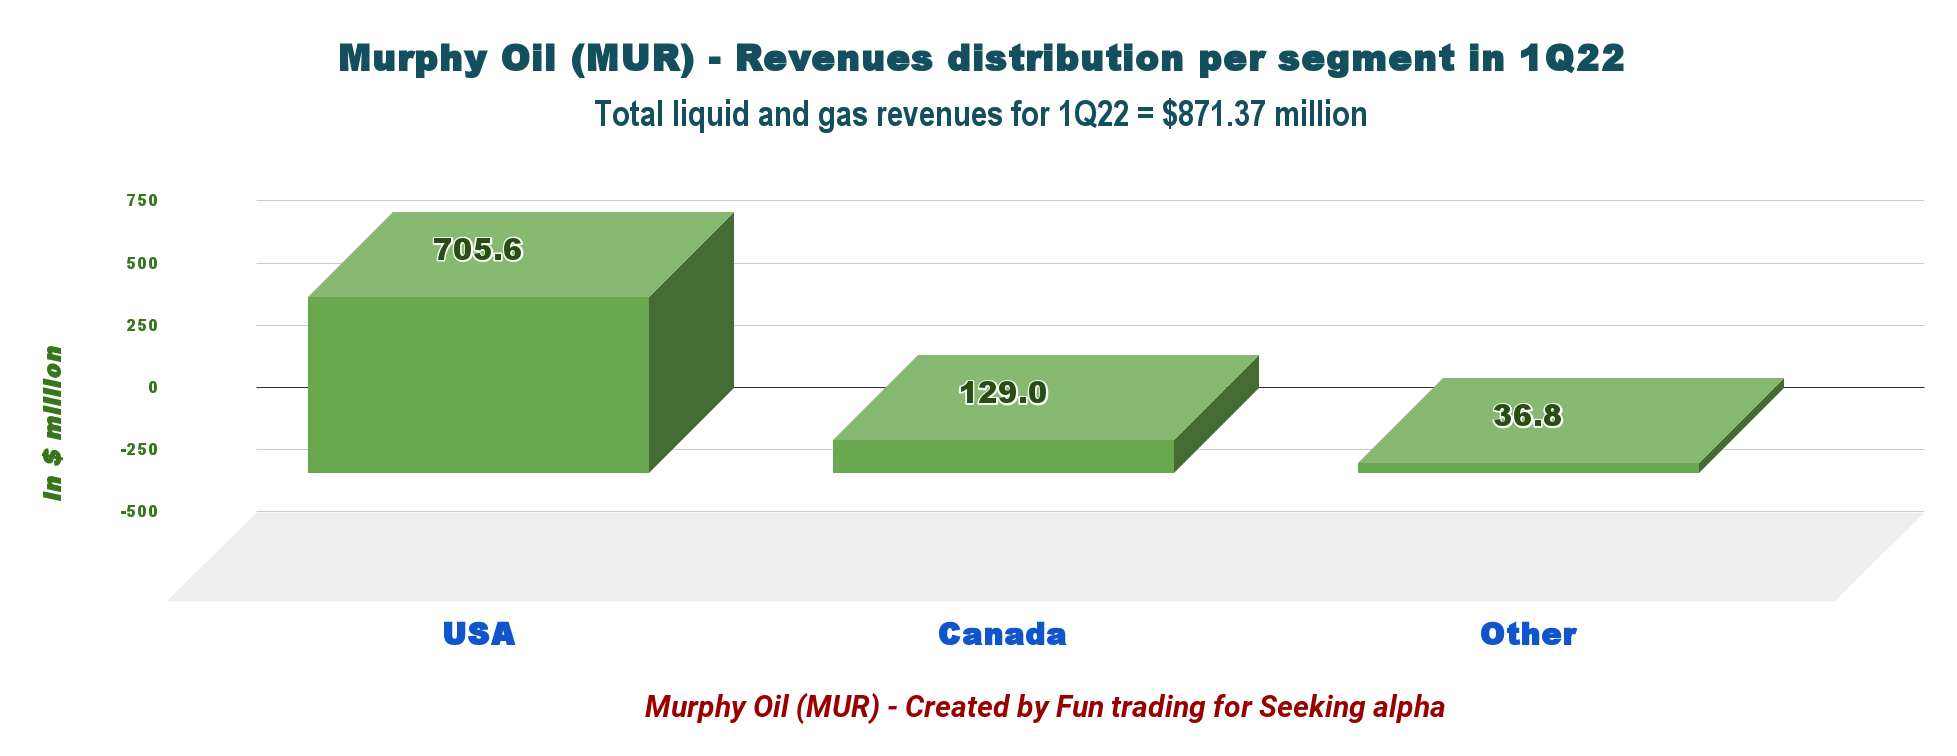
Murphy Oil’s revenues of $871.37 million were better than expectations. Revenues improved from the prior-year quarter of $592.53 million.
The E&P company produced 141.0k boepd in the first quarter, comprising 60% of liquids. Murphy Oil’s total costs and expenses were $595.085 million, down 7.3% from $641.735 million in the prior-year quarter.
On the debt side, Murphy raised its 2022 debt reduction goal to $600 million to $650 million from $300 million as a continuation of the deleveraging strategy, assuming an $85 per barrel West Texas Intermediate oil price. Also, the company announced the redemption of $200 million of 6.875% senior notes due 2024.
Roger Jenkins, President, and Chief Executive Officer, said in the conference call:
Overall, we believe this goal is achievable at an $85 per barrel WTI price and current production guidance for the year. Longer term, we have forecasts having the optionality of up to an additional $1 billion of debt reduction, in 2023 assuming only $75 per barrel pricing. We continue to review our overall debt target for additional accelerated reductions.
Finally, Murphy Oil declared a 17% increase in the quarterly dividend to $0.175 per share, representing a 40% increase from the fourth quarter of 2021
2 – Stock Performance And Commentary
MUR is now up 13% on a one-year basis, down sharply from last month. The stock is following the general trend in this sector, entering a period of consolidation as recession fears are weighing down on markets.
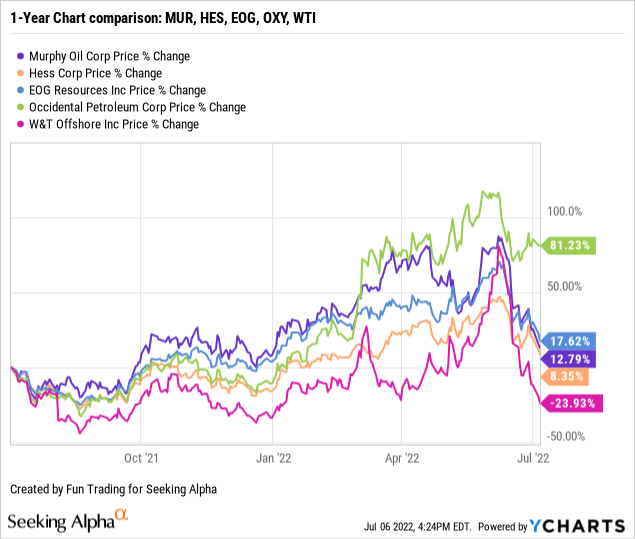
I like MUR because it is a dependable E&P company with a significant segment in the Eagle Ford basin, Gulf of Mexico, and other domestic assets.
Holding a long-term MUR position can be considered and could significantly pay off if a bigger fish acquired the E&P company.
MUR Gulf of Mexico assets Presentation (Murphy Oil)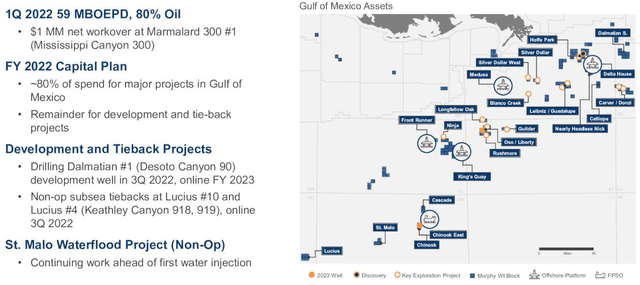
As I said in my preceding article, Murphy’s exposure to the US is turning increasingly attractive, and I would not be surprised if Murphy Oil gets acquired in 2022. The recent oil price pullback is another element that could trigger an acquisition.
However, oil prices remain volatile and have corrected to $100 per barrel. The threat of a recession is growing, and oil prices could drop further down to $85 per barrel in a not distant future. Thus, it’s essential to trade LIFO about 50% of your position due to the oil volatility and uncertainty about the economy suffering from rampant inflation and may fall into recession.
Murphy Oil – Financial Table 1Q22 – The Raw Numbers
| Murphy Oil | 1Q21 | 2Q21 | 3Q21 | 4Q21 | 1Q22 |
| Total oil and gas revenues in $ million | 592.53 | 758.83 | 687.55 | 762.3 | 871.37 |
| Total Revenues and others in $ Million | 379.99 | 549.64 | 630.70 | 739.0 | 552.96 |
| Net Income in $ Million | -287.44 | -63.08 | 108.46 | 168.4 | -113.34 |
| EBITDA $ Million | -68.81 | 237.07 | 413.18 | 489.76 | 119.51 |
| EPS diluted in $/share | -1.87 | -0.41 | 0.70 | 1.08 | -0.73 |
| Operating cash flow in $ Million | 237.77 | 448.52 | 405.00 | 330.9 | 338.33 |
| CapEx in $ Million | 258.28 | 204.77 | 118.92 | 106.2 | 244.91 |
| Free Cash Flow in $ Million | -21 | 243.75 | 286.09 | 224.63 | 93.42 |
| Total cash $ Billion | 0.23 | 0.42 | 0.51 | 0.52 | 0.48 |
| Long-Term Debt in $ Billion | 2.76 | 2.76 | 2.61 | 2.47 | 2.47 |
| Dividend per share in $ | 0.125 | 0.125 | 0.125 | 0.15 | 0.175 |
| Shares outstanding (diluted) in Million | 153.95 | 154.40 | 155.93 | 154.45 | 154.92 |
| Oil Production | 1Q21 | 2Q21 | 3Q21 | 4Q21 | 1Q22 |
| Oil Equivalent Production in K Boe/d | 155.0 | 171.0 | 155.0 | 150.2 | 141.0 |
| US Onshore Crude oil price ($/b) | 57.41 | 65.53 | 68.88 | 76.28 | 93.87 |
Source: Murphy Oil 10-Q filing
Analysis: Revenues, Earnings Details, Free Cash Flow, Debt, An Oil & Gas Production
1 – Total Revenue And Others (Hedging) Was $552.96 Million In 1Q22
MUR Quarterly Revenues history (Fun Trading) Note: Revenues from oil and gas were $871.37 million. The company posted a loss on crude contracts of $320.777 million in 1Q22. MUR Quarterly revenue per region in 1Q22 (Fun Trading) Murphy Oil reported a net loss of $113.34 million, or $0.73 per diluted share, for the first quarter of 2022. MUR reported an adjusted net income of $0.73 per share.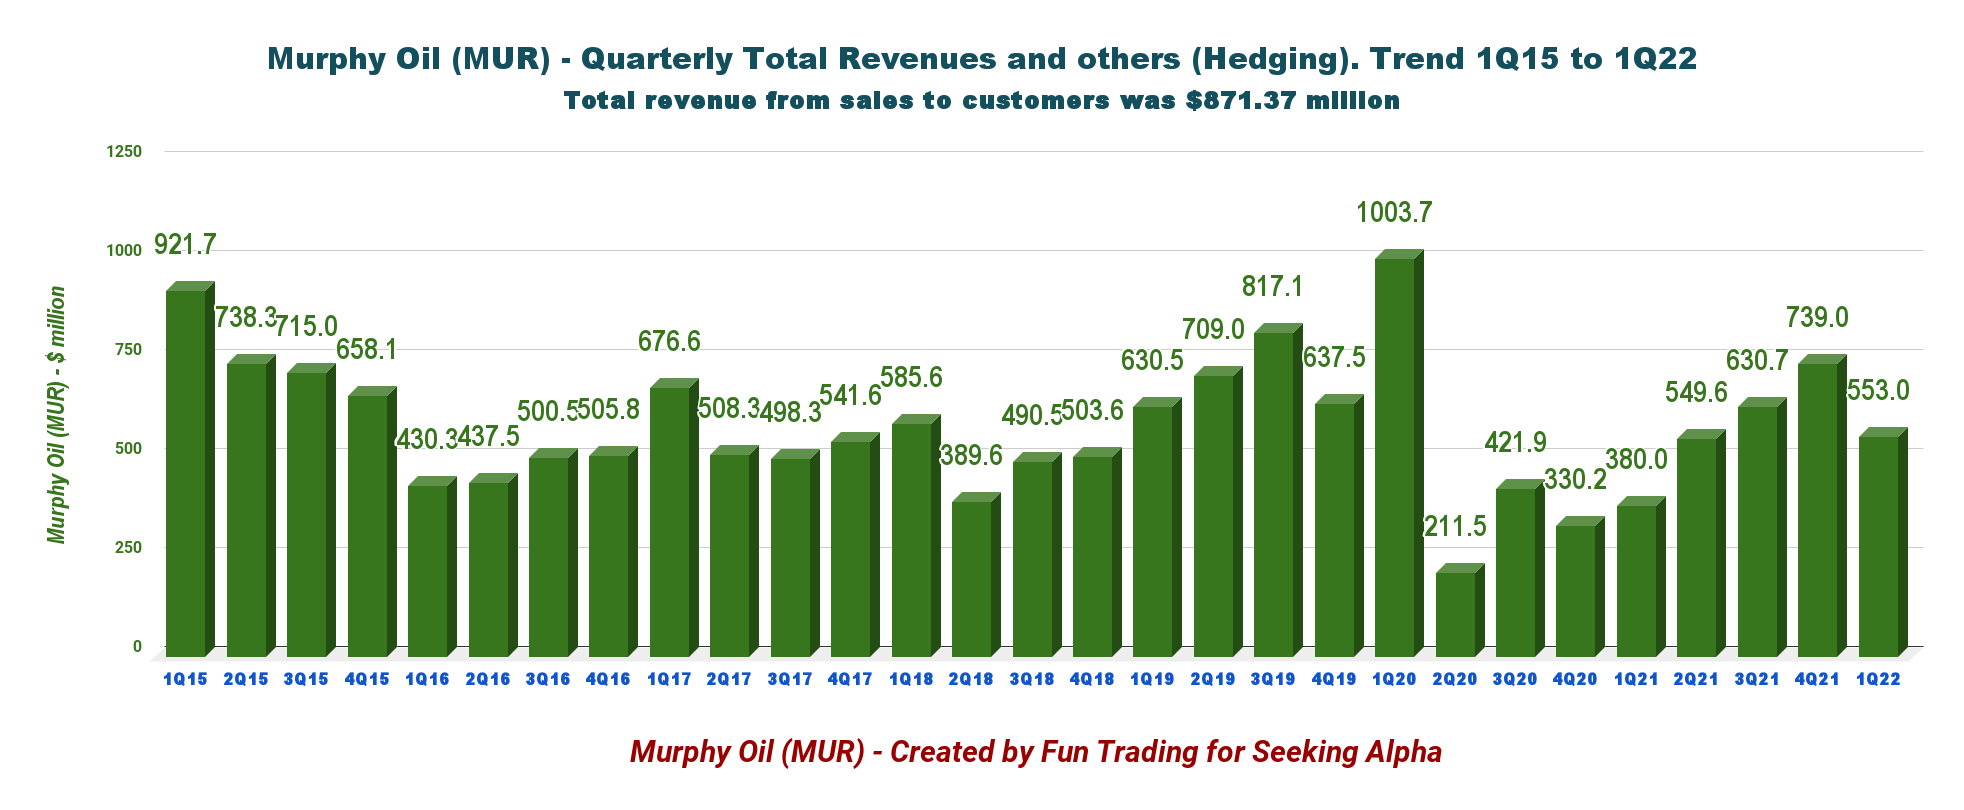
The net cash provided by continuing operations activities in 1Q22 was $338.33 million, compared with $237.77 million in 1Q21.
Roger Jenkins, President, and Chief Executive Officer, said in the conference call:
We continue to generate strong cash flow with higher oil prices realized this year, we’ve been able to increase our shareholder returns through quarterly dividend raises as well as accelerate our debt reduction goals. Lastly, our meaningful level of board, management ownership highlights our personal interests in the company’s long-term success.
2 – Free Cash Flow Was $93.42 Million In 1Q22
MUR Quarterly Free cash flow history (Fun Trading) Note: The generic free cash flow is cash from operating activities minus CapEx. The company has a different calculation, including divestiture.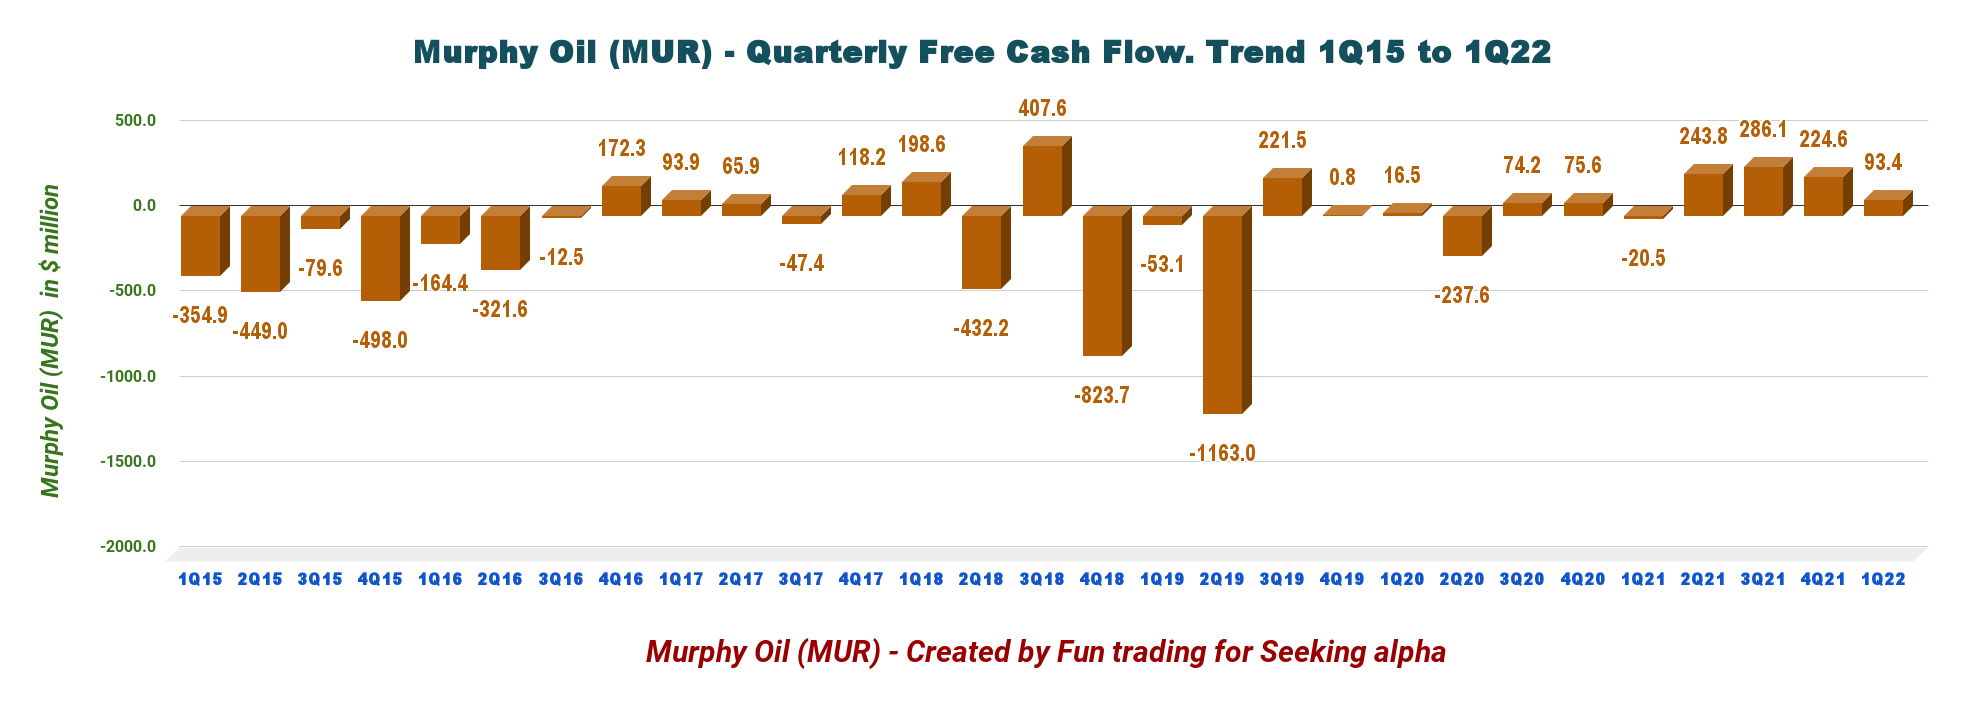
In Murphy Oil’s case, the generic free cash flow was $93.42 million in 1Q22. Trailing 12 months’ free cash flow is $847.89 million, which is large enough to cover the increased dividend.
The company now pays a quarterly dividend of $0.175 per share, representing a yearly cost of $108 million. The dividend yield is currently 2.57%.
3 – Production Was A Total Of 141.0k boepd In 1Q22
MUR Quarterly oil equivalent history (Fun Trading) The company produced 141.0 boepd in the first quarter, comprising 60% of liquids. The offshore section, mainly the Gulf of Mexico, represents 45.4% of the total output in 1Q22. MUR Oil equivalent production per segment in 1Q22 (Fun Trading) CEO Roger Jenkins said in the conference call: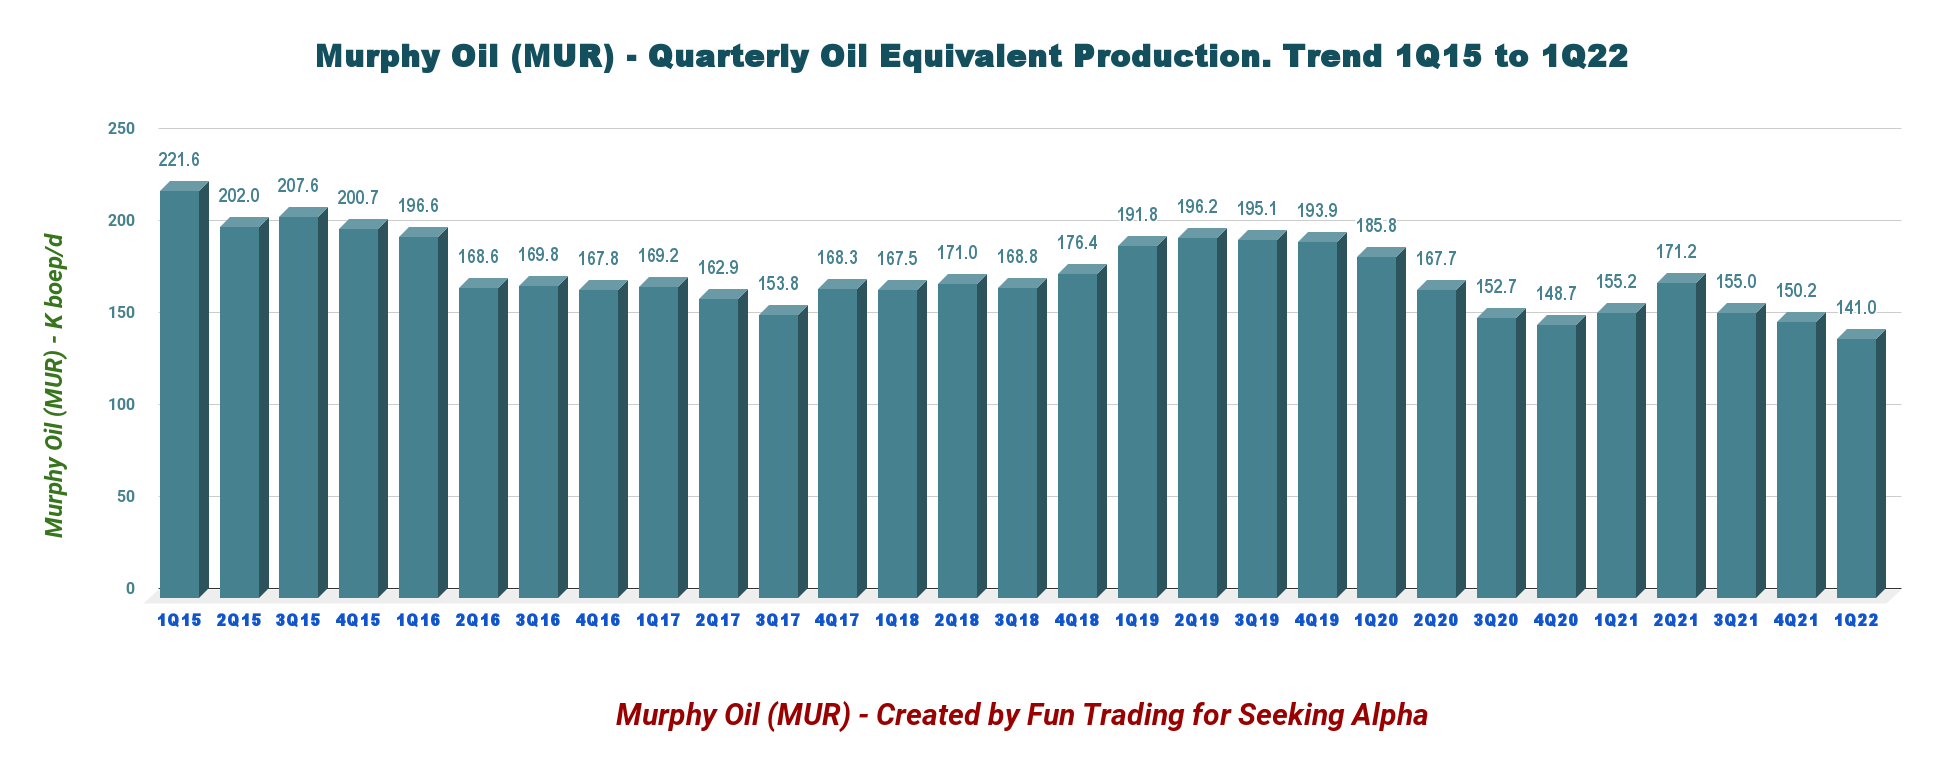
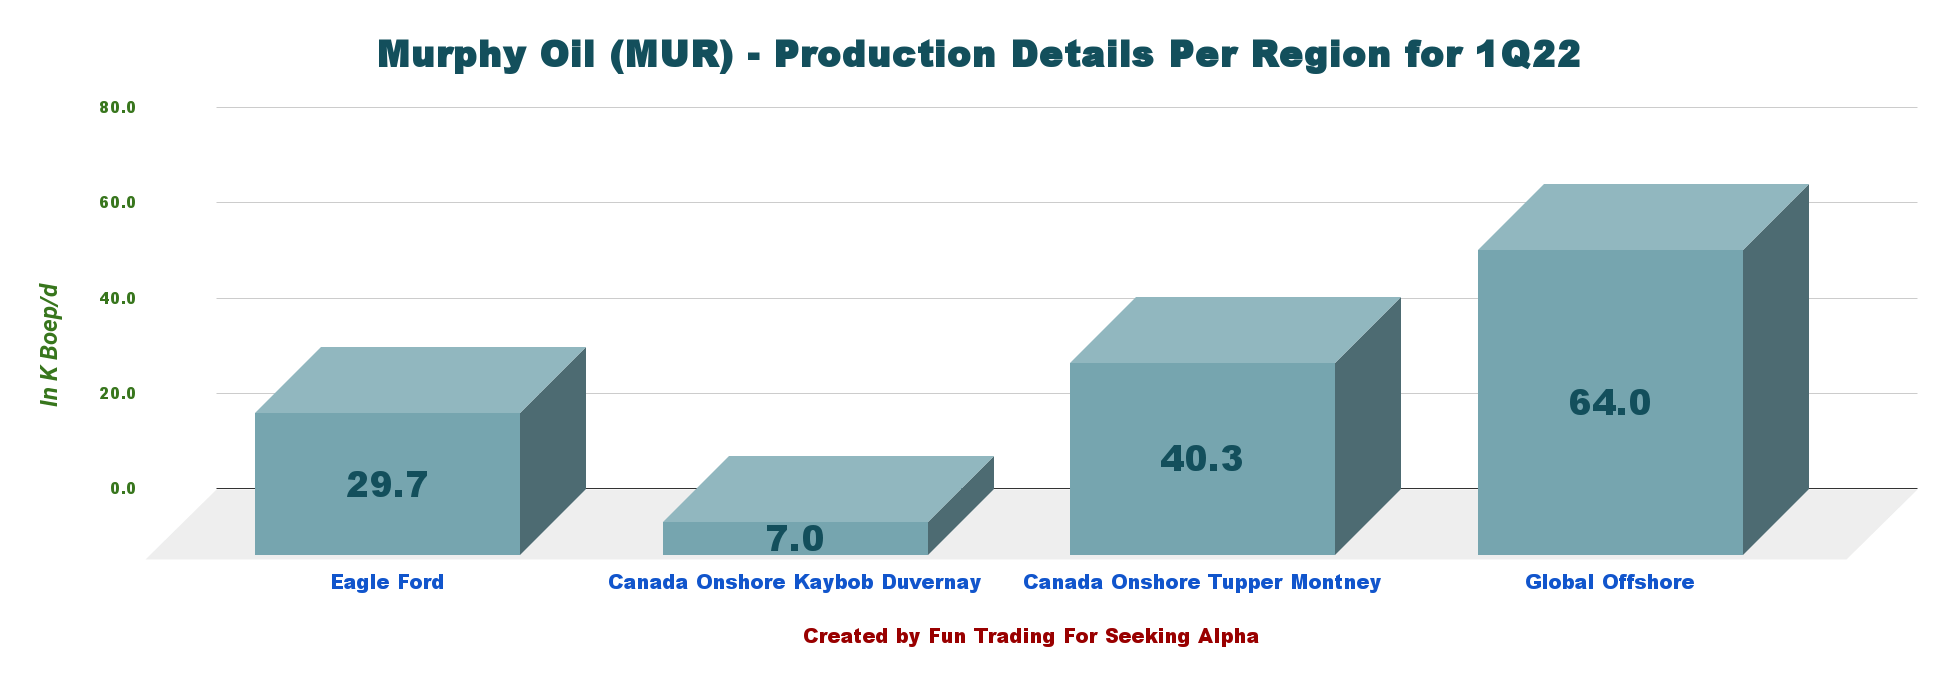
Gulf of Mexico, our assets there produce 59,000 barrels equivalent per day for the quarter with 80% oil, overall, approximately 80% of our 2022 capital plan is designating for advancing our major projects, with remainder spending on development and tieback wells and activity scheduled later this year, The non-operated St. Malo Waterflood Project is also ongoing.
Below is how it is spread between oil, NGL, and natural gas.
MUR Oil production detail in 1Q22 (Fun Trading)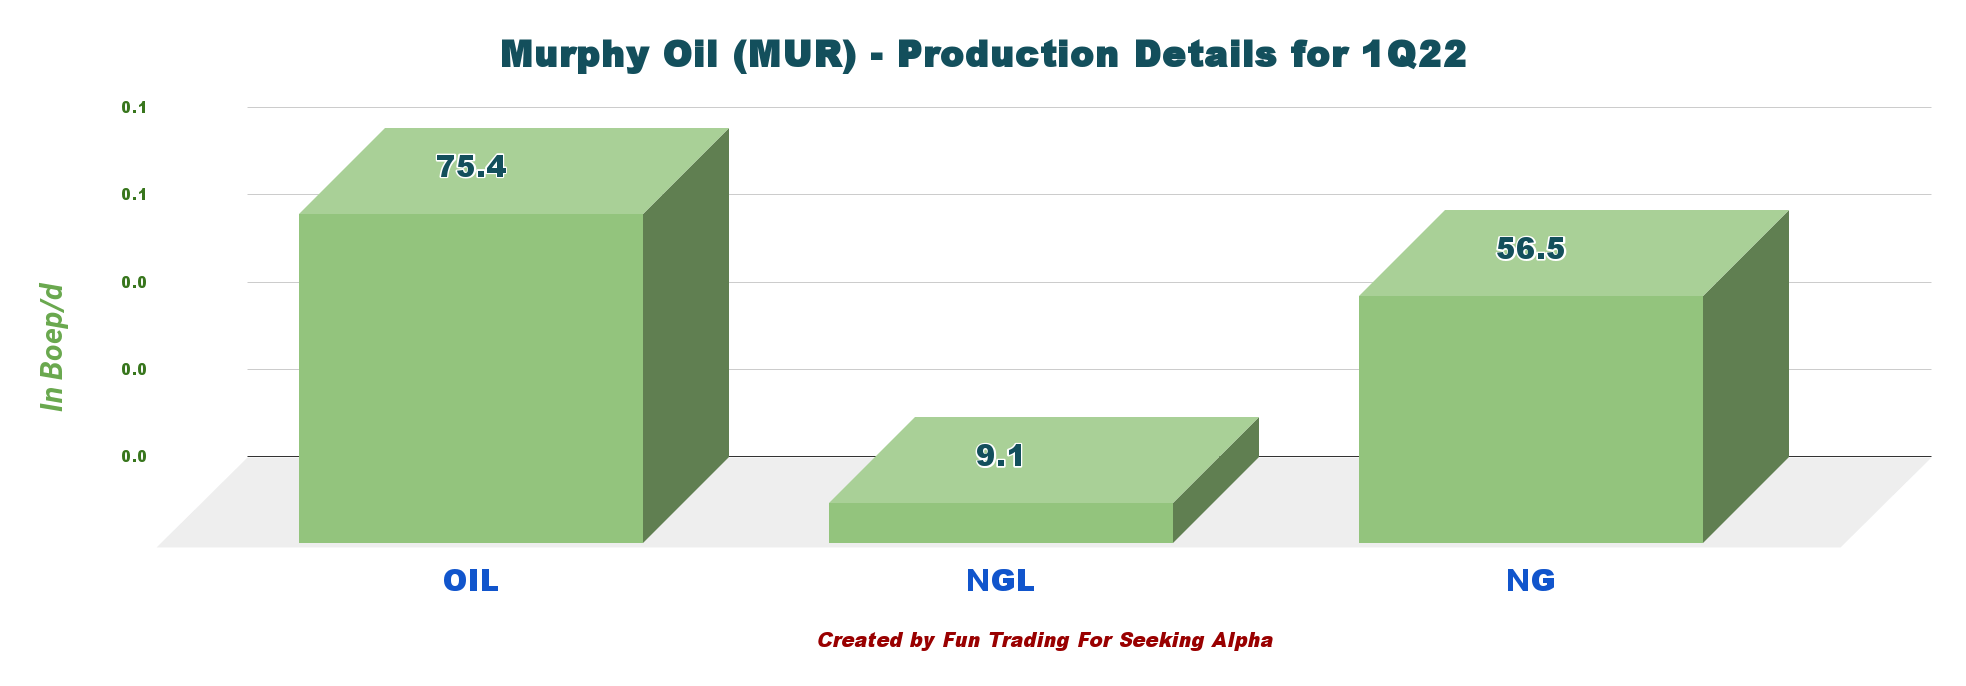
4 – Net Debt Under Control
Murphy Oil had cash and cash equivalents of $480.59 million as of March 31, 2022, compared with $230.87 million as of March 31, 2021.
At the end of the first quarter, the company’s total liquidity was $2.1 billion. Long-term debt was $2,466 million on March 31, 2022, compared with $2,755 million as of March 31, 2021.
MUR Quarterly Cash versus Debt history (Fun Trading) Net debt is $1.99 billion at the end of March 2022. All debt is unsecured senior credit facility, not subject to semi-annual borrowing base redetermination.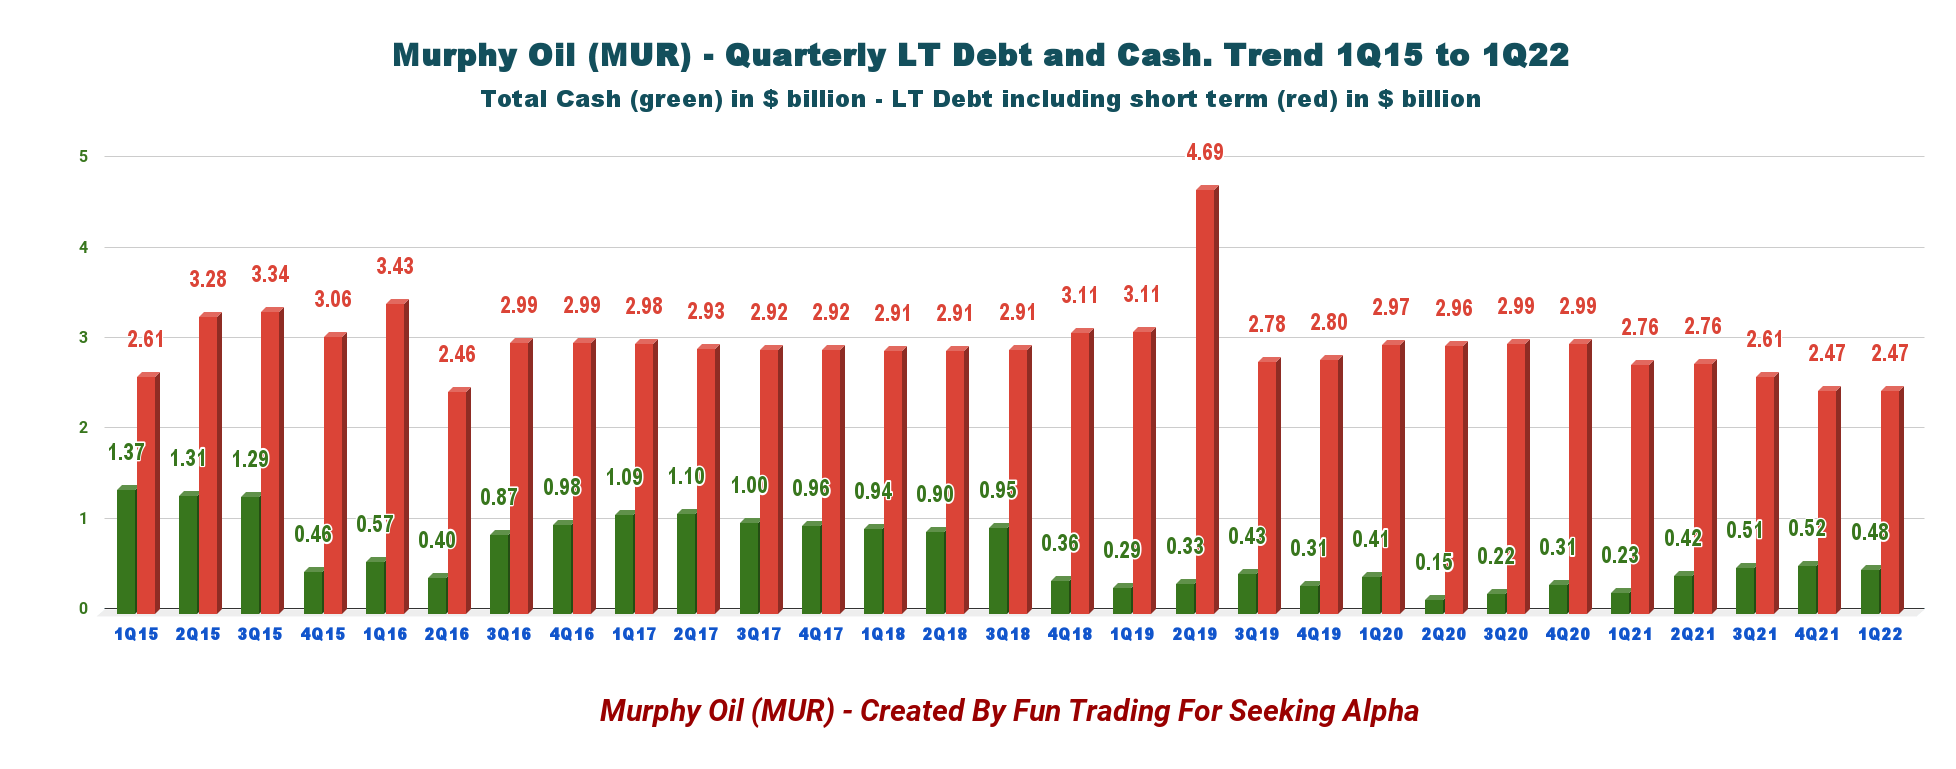
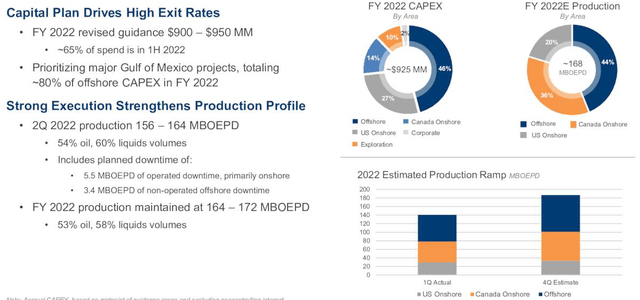
5 – 2Q22 Guidance
MUR expects its production to be 156-164k boepd in 2Q22.
Murphy Oil expects its current planned CapEx range of $900-$950 million.
MUR 2Q22 guidance (Murphy Oil) MUR FY Comp guidance Presentation (Murphy Oil)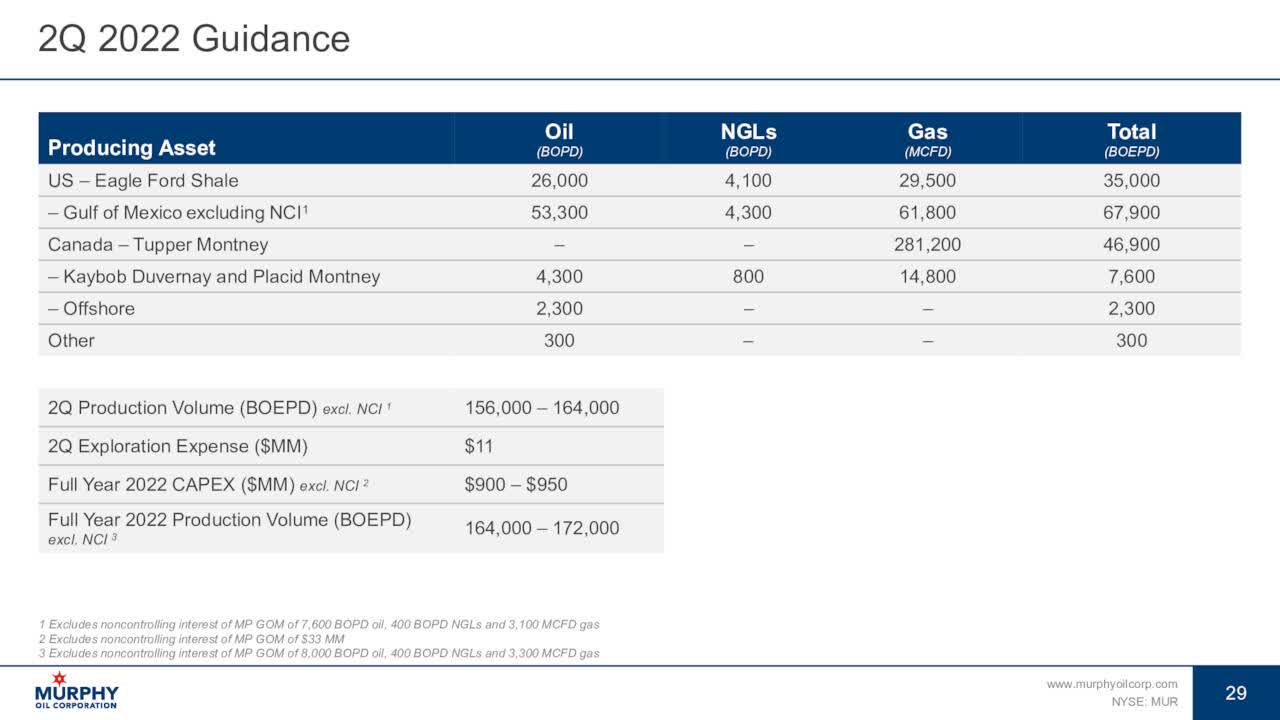
Technical Analysis (Short Term) And Commentary
MUR TA Chart Short-term (Fun Trading)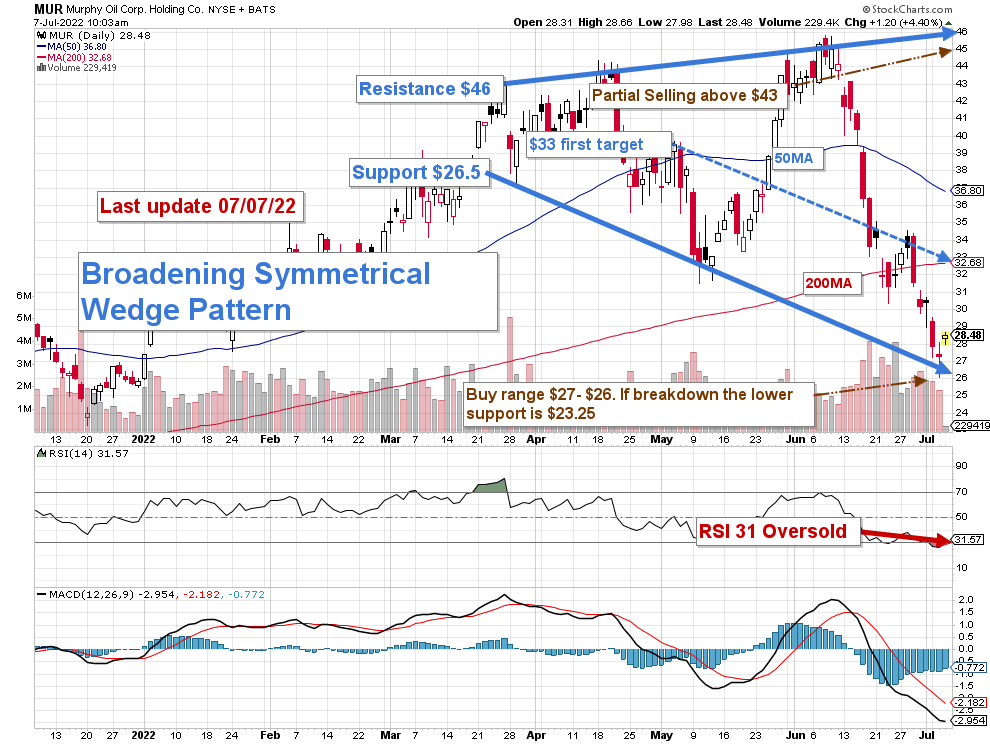
Note: The chart is adjusted for the dividend.
MUR forms a broadening symmetrical wedge pattern with resistance at $46 and support at $26.5
It is not easy to predict the future, but we can see that the global economy is weakening faster. As an investor, you cannot ignore those early signs, and you have to protect your investment by adopting a strategy that takes the “best of both worlds.” Thus, trading LIFO is the most suitable solution, in my opinion.
The trading strategy is to sell LIFO about 50% of your position between $43 and $46. However, I believe the first resistance could be set at $33, and I recommend selling about 25% at this level, which is at the 200MA. It is the general strategy that I recommend in my marketplace, “The gold and oil corner.”
I suggest accumulating between $27 and $26 with potential lower support at $23.25 if oil prices fall later this year.
The risk of recession later this year will affect the oil demand and, therefore, pressure oil prices. The question is, how sharp will be the global slowdown?
Expectations of faster monetary tightening in the United States could trigger financial stress in EMDEs starting in the third quarter of this year. In this scenario, the Federal Reserve would see no choice but to raise the policy rate to 4 percent by the first quarter of 2023.
Note: The LIFO method is prohibited under International Financial Reporting Standards (IFRS), though it is permitted in the United States to generally accepted accounting principles (GAAP). Therefore, only US traders can apply this method. Those who cannot trade LIFO can use an alternative by setting two different accounts for the same stocks, one for the long term and one for short-term trading.
Warning: The TA chart must be updated frequently to be relevant. It is what I am doing in my stock tracker. The chart above has a possible validity of about a week. Remember, the TA chart is a tool only to help you adopt the right strategy. It is not a way to foresee the future. No one and nothing can.
Author’s note: If you find value in this article and would like to encourage such continued efforts, please click the “Like” button below as a vote of support. Thanks.
Be the first to comment