

designer491/iStock via Getty Images
This article was first released to Systematic Income subscribers and free trials on June 21.
In this Muni update, we look at some of the themes driving markets and highlight our allocation stance. In this update, we also take a look at some of the misconceptions we have come across, particularly with respect to the PIMCO and Nuveen tax-exempt funds.
Mind These Muni Misconceptions
One set of misconceptions when thinking about Municipal tax-exempt CEF allocations has to do with allocating to funds of different managers. In this section, we take a look at some of the ideas we have come across recently having to do with two of the larger Muni managers – PIMCO and Nuveen. We focus on these managers’ national funds (PML, PMF, PMX for PIMCO) and the larger national Nuveen funds (NAD, NEA, NVG), though the discussion applies more broadly as well.
As an aside, one thing we don’t do is include NZF in the discussion. This is for the simple reason that NZF is a “credit” Municipal fund, i.e. a fund that has a significant allocation to unrated / high-yield municipal bonds – twice the sector average at 20%. We highlighted this pocket of funds in an earlier article. Therefore, any comparison of NZF to the broader national Municipal sector is tricky as it’s not an apples-to-apples kind of analysis.
For the rest of this section, we first state the misconception in bold and discuss it immediately after.
PIMCO funds have higher NAV distribution rates than the Nuveen funds and, hence, will have more difficulty covering it.
There are two basic facts that everyone can agree on. First, the PIMCO funds have a higher NAV distribution rate (this is occasionally called NAV yield which can be confused with NAV net investment income yield or NII yield so we use the term distribution rate to make it clear that this relates to the fund’s distribution rather than its NII). We can see this in the chart below.
Systematic Income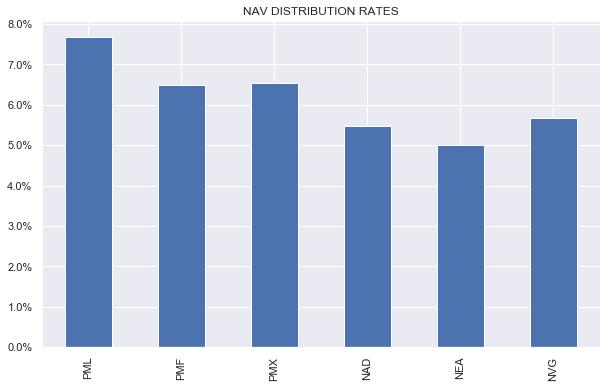
The second basic fact is that, all else equal, a higher NAV distribution rate for a given fund will lower its distribution coverage. This is not particularly interesting since it’s a mathematical tautology. Distribution coverage is just NAV Net Investment Income / NAV Distribution Rate, so the higher the denominator the lower the coverage is.
The point here is that this argument is correct in the context of a single fund. However, once you start looking at two different funds, particularly across two different managers, it can totally break down. The basic reason for this is that distribution coverage is not a function of just the fund’s NAV distribution rate.
A quick way to dismiss the view that the higher NAV distribution rates of the PIMCO funds mean they are going to have more difficulty covering it is to just look at the funds’ latest distribution coverage figures. If a higher NAV distribution rate for the PIMCO funds relative to Nuveen funds made it more difficult for PIMCO to cover it, then why do two of the three PIMCO funds have the highest coverage across these six funds? Perhaps, it’s not actually all that difficult.
Systematic Income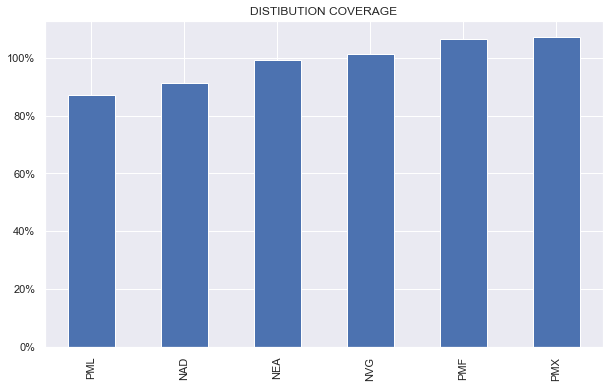
Let’s consider all the different ways a fund can increase its distribution coverage for a given level of NAV distribution rate. It can run at a higher leverage level, it can run at a lower expense level, it can tilt to higher-coupon bonds, it can tilt to lower-quality bonds, it can use a lower cost leverage facility (with more covenants perhaps), etc. When it comes to the PIMCO funds, much of the heavy lifting is done by a higher leverage level over its Nuveen counterparts.
The best we can say is that a higher NAV distribution rate is one of many factors that affect distribution coverage. Saying that a higher NAV distribution rate “makes it more difficult” for a given fund to cover its distribution is true but is not very useful because it can’t say anything about whether a given distribution is covered or not nor how well covered it is. In addition, knowing the NAV distribution rate of two different funds in a given sector tells you almost nothing about its distribution coverage in either absolute or relative terms. Knowing the NAV distribution rate is not useless but we shouldn’t ask it to do all of our heavy lifting for us.
An environment of rising rates makes it much more difficult for PIMCO funds to cover their higher NAV distribution rates.
A lot of CEF analysis focuses on whether or not a fund is able to cover its distribution or not. And, granted, distribution coverage is a fairly useful metric. But by focusing so much on coverage investors can also miss the forest for the trees.
Ultimately, what investors should really care about is how much a given fund is able to generate in income. A fund with higher-leverage can generate a higher level of income than a fund carrying lower leverage. Yes, there are some potential consequences for this such as a greater likelihood of a forced deleveraging but it doesn’t change this simple fact.
It is also true that a fund with fixed-coupon assets (such as a Muni CEF) with a higher leverage level will see a greater erosion of its net investment income when leverage costs rise. However, we need to be precise.
The chart below shows the net investment income for a 50% leveraged fund and a 40% leveraged fund as a function of the Fed Funds rate. Both funds are assumed to have a 0.8% of expenses on total assets as well as a SIFMA + 0.5% leverage cost and a current yield of 4.2% (which roughly aligns with the NAD disclosures). We assume that SIFMA rises as 2/3 of the Funds rate which, given its tax-exempt profile, it tends to.
Systematic Income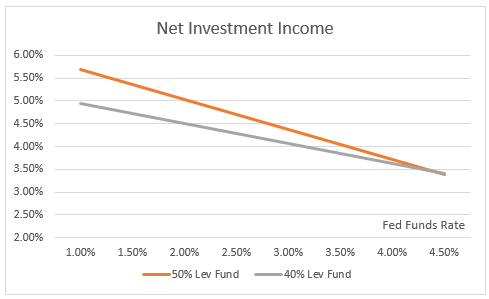
What we see is that a 50%-leveraged fund continues to have a higher level of net investment income until Fed Funds reaches a level of 4.5% – something it’s not actually expected to do by either the Fed itself or by markets (as seen via Fed Fund futures).
So yes, a higher-leveraged fund will see its distribution coverage erode more quickly but the fund will still be generating a higher level of net investment income for any plausible scenario.
Nuveen funds are better positioned to ride out a worst-case scenario for Treasuries.
The view here is that a higher-leverage Municipal fund will underperform a lower-leverage fund in a period of sharply higher Treasury yields.
The main problem with this view is that it is just another tautology masquerading as sage investment advice. PIMCO funds carry much higher leverage levels than the Nuveen funds and they have underperformed this year as the following chart shows.
Systematic Income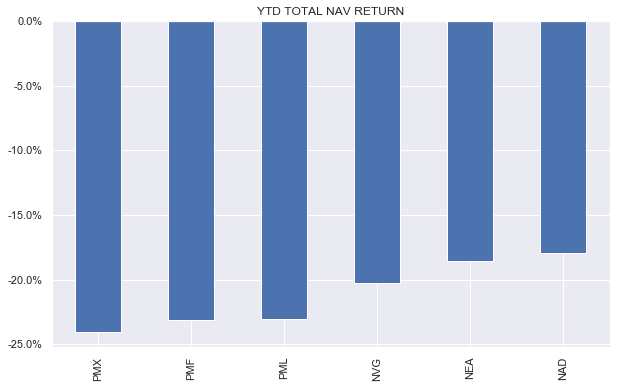
Another key problem with this view is that we are not actually aware of any investor who allocates capital strictly based on a worst-case scenario. An investor who expects a “worst case” scenario for Treasuries should not hold any Municipal fund full stop. Imagine an investor who is looking at the market now and says to herself – well I think the worst case scenario for Treasuries is that yields go to 15% – where they were in the 1980s – and this is why I am going to hold Nuveen Municipal CEFs. It’s hard to know exactly what Municipal CEFs will do but they could very well lose something like 75% of their NAV. If this actually happens, we strongly doubt the investor will pat herself on the back saying – well I did a great job calling that worst case scenario so now I am sitting on a 75% loss versus an 80% loss in the PIMCO funds – well done me.
The reality is that investors allocate capital on a probabilistic basis so the worst case scenario for Treasuries should have a relatively small weight in their decision – for any reasonable definition of “worst case”.
Much more likely than a “worst-case” scenario for Treasuries is a scenario where Treasury yields either remain range-bound or actually move lower, in case we enter a recession, for example. In this case, the PIMCO funds could easily outperform Nuveen funds due to their higher level of income-generating capacity and their higher leverage.
Judging by NAV returns, the Nuveen funds are just better funds than the PIMCO funds
It’s true that if you look at total NAV returns over various periods up to today the PIMCO funds are underperformers. However, we need to understand the key problem of analyzing total returns which is that they are often highly dependent on the period in question.
The reason that the PIMCO funds underperform Nuveen funds up to today over various periods is that Municipal bond yields are at historically high levels. And because the PIMCO funds are higher-leveraged funds they will tend to underperform when Municipal bond yields rise sharply.
S&P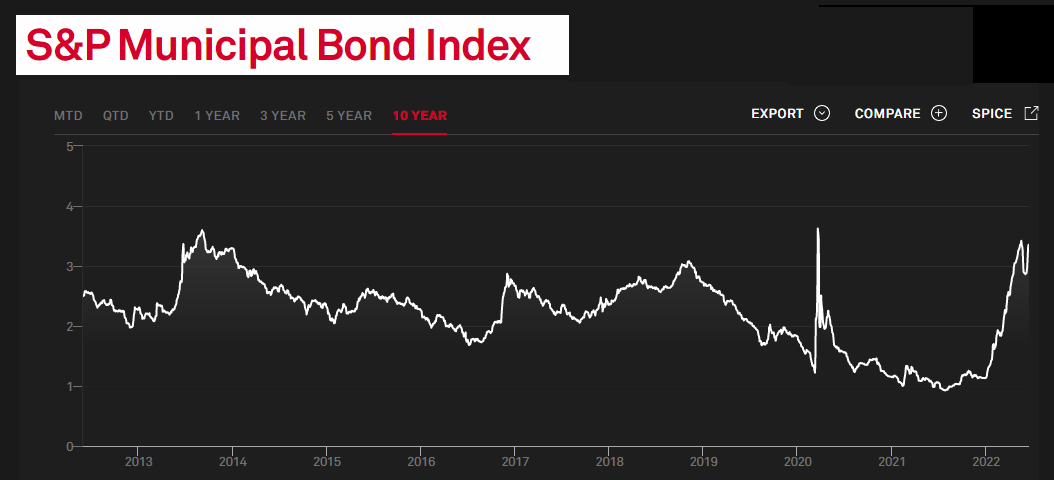
We can just as easily construct even longer periods of outperformance by the PIMCO funds such as in the 2013-2021 period if the endpoint of our analysis is a period of relatively low Municipal yields.
Systematic Income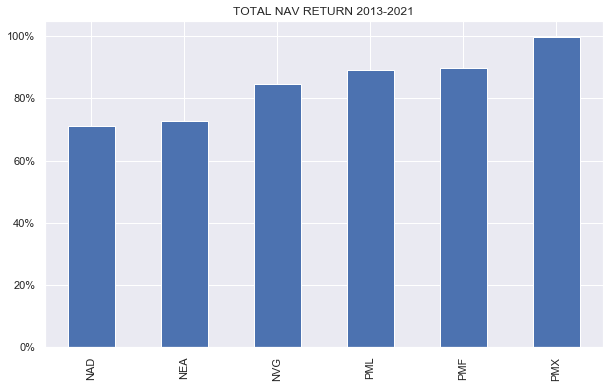
We can also extend this argument to stocks. For example, there have been very long periods where stocks have delivered no gains, e.g. the 15-year period leading up to 2002 or the decade leading up to 2009. However, none of this actually implies that stocks are a bad investment.
The key takeaway here is that you need to control for the underlying market environment when analyzing funds. Just because the PIMCO funds have underperformed in a period of rising yields doesn’t make them bad funds – it’s pretty much a reflection of their higher-leveraged stance. And just because they tend to outperform in a stable or falling yield environment doesn’t make them better funds. As always, investors need to understand the actual profile a given fund has and in which environment that profile will be a tailwind or a headwind.
This is the same point we have made about the Flaherty suite of funds in the Preferreds sector. These funds have been strong outperformers and everyone has tended to get on the bandwagon with how these are the “best” funds to own in the sector. Our view has been consistently that because these funds don’t wear the cost of hedging duration / leverage cost exposure they will tend to outperform in a period of stable or falling yields – the kind of environment we have mostly enjoyed for the last decade. However, they have underperformed this year and, not only that, they have been the most aggressive distribution cutters to boot. And this is a direct result of the choice they have made in how they run their funds.
Our point here is not to suggest that the PIMCO Muni funds are unsung heroes – we don’t actually hold any in our Income Portfolios. Rather, we want to make sure investors have all information at their disposal rather than follow the advice of some who just like to beat up on assets that are down in any given environment.
Stance and Takeaways
In our penultimate Municipal update in April, we adopted a more constructive stance on longer-duration assets such as Municipal bonds. This was not only because of the big move in Treasury yields as well as very attractive Muni valuations but also because of the greater likelihood of a market dislocation in lower-quality assets. Since then, Munis have performed well despite a further rise in Treasury yields as the following chart shows.
Systematic Income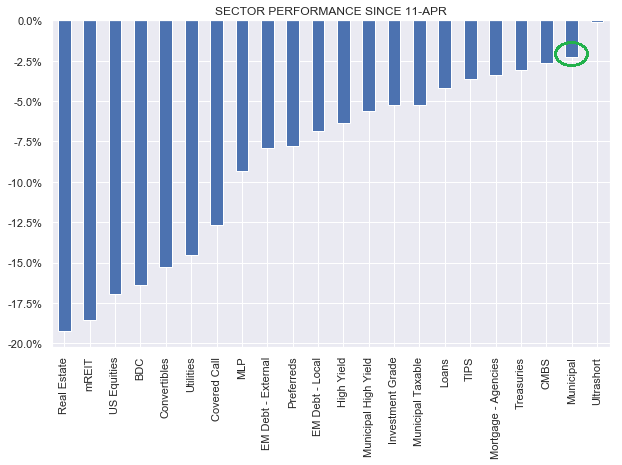
This year we have taken advantage of a much more attractive Muni yield environment by rotating from more resilient positions such as term CEFs and open-end funds which have seen only about half the drawdown of perpetual CEFs. We continue to maintain a reduced allocation to more resilient funds such as the Nuveen Intermediate Duration Municipal Term Fund (NID) and the Nuveen Short Duration High Yield Municipal Bond Fund (NVHAX).
The volatility across the Muni space has given rise to a number of attractive relative value opportunities – allowing investors to generate additional alpha in their portfolios. For instance, we recently took advantage of a sharp rally in two of our holdings – the BNY Mellon Municipal Bond Infrastructure Fund (DMB) and the Invesco Municipal Income Opportunities Trust (OIA) to rotate into the BlackRock MuniAssets Fund (MUA).
Systematic Income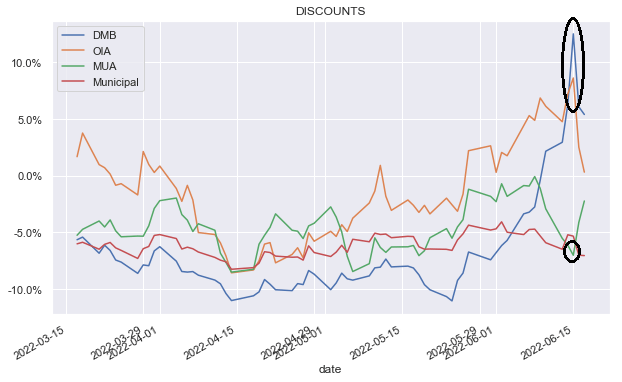
Investors should also consider tax-loss swapping in the sector given the price action this year and the fact that the Municipal sector is by far the largest CEF sector, boasting many very similar funds from a number of issuers. Net capital losses can offset a limited number of ordinary taxable income in any one tax year as well as be carried over indefinitely.
Be the first to comment