

USD/ZAR ANALYSIS
- Rand continues to strengthen irrespective of fiscal woes
- Global factors linger as dominant influence on USD/ZAR
- Key SA economic data scheduled this week
RAND FUNDAMENTAL BACKDROP
Strong start to the week for the Rand as USD/ZAR extends to fresh new lows for 2021. This positive start is a consequence of global optimism and search for yield which has been reflected across Emerging Market (EM) currencies. The South African Rand has benefitted more so than it’s EM peers due to favorable commodity prices which ties into its less popular title as a commodity currency.
Confidence around the ongoing U.S stimulus approval as well as global COVID-19 inoculations has influenced this recent ‘risk-on’ sentiment despite the fact that local economic woes and lack of structural reforms continue to plague South Africa.
This week there a re a few South African specific economic announcements to look out for (see calendar below). The unemployment rate is likely to be the focus and potentially the most influential on USD/ZAR. A large deviation from expectations may result in notable price fluctuations which should reinforce the practice of sound risk management technique.
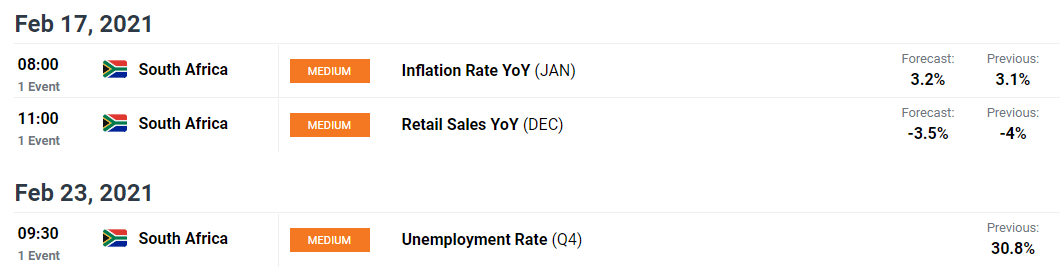
Source: DailyFX economic calendar

Recommended by Warren Venketas
Trading Forex News: The Strategy
TECHNICAL ANALYSIS
Starts in:
Live now:
Feb 16
( 18:02 GMT )

Keep up to date with price action setups!
Trading Price Action
USD/ZAR MONTHLY CHART
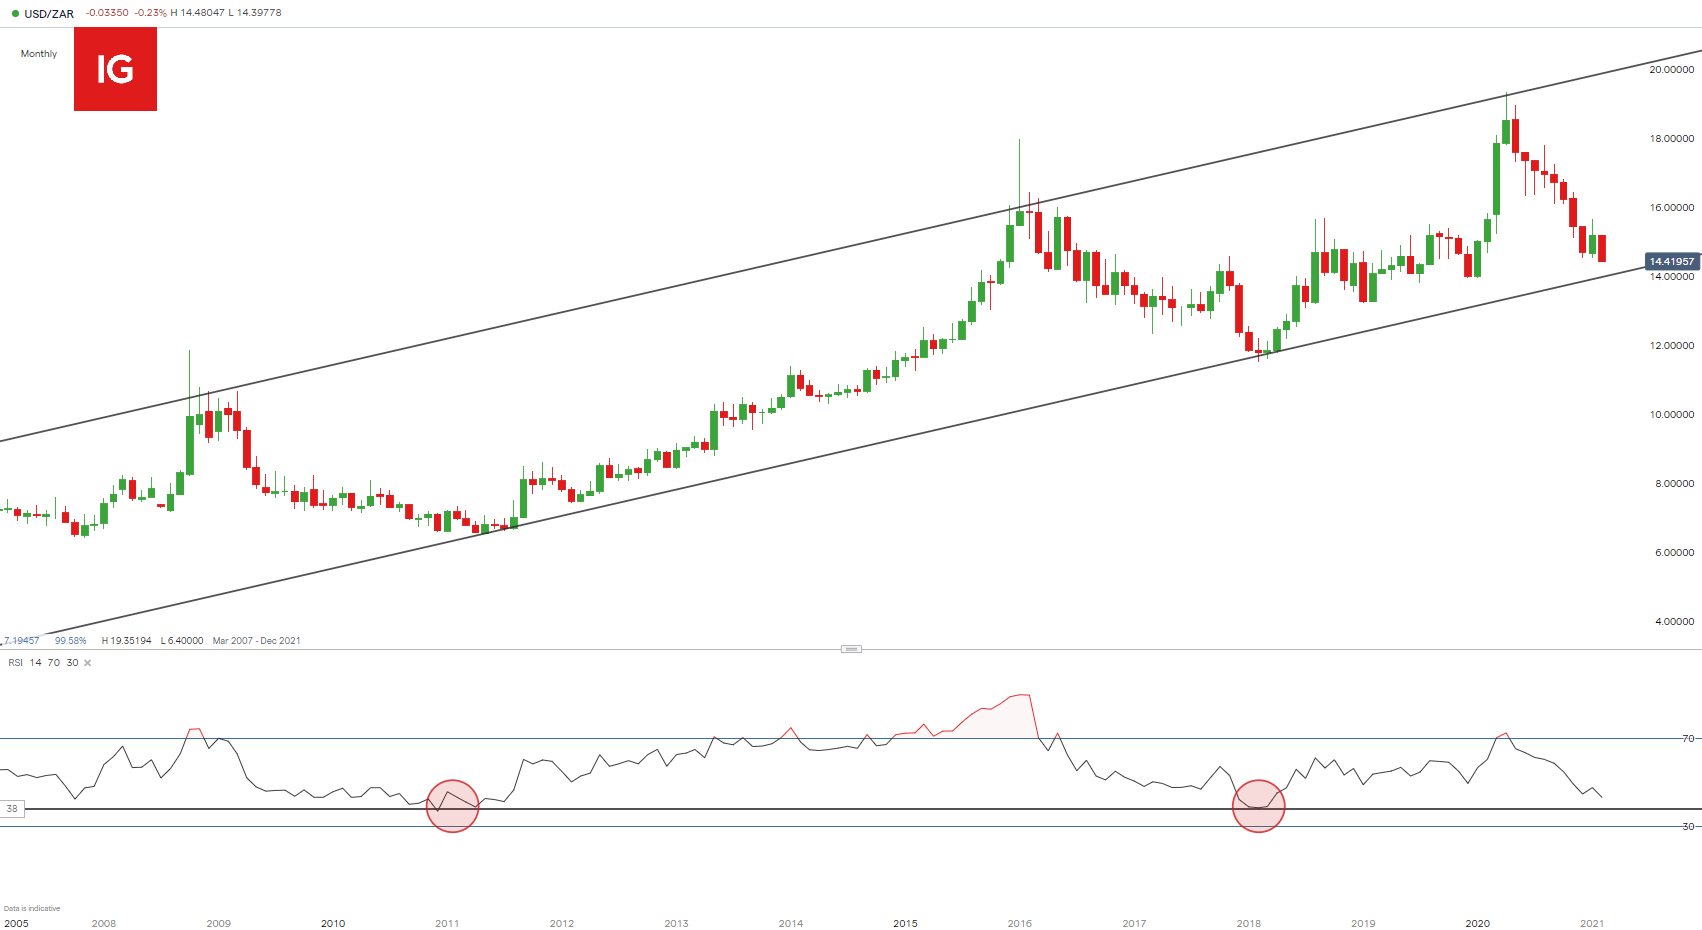
Chart prepared by Warren Venketas, IG
The long-term monthly chart above shows a support and resistance channel which has been adhered to by the USD/ZAR pair over may years. Price action is slowly approaching the lower bounce (support) of the channel which may lead to a price reversal in continuation of prior support breaches or fall through support. The latter may be established by a confirmation candle close below the support trendline which may lead to significant downside.
The Relative Strength Index (RSI) suggests the 38 level (red) to be of some significance as this level acts as a secondary support input. A break below this level could result in further downside while a push off support may lead to a price reversal to the upside.
USD/ZAR DAILY CHART
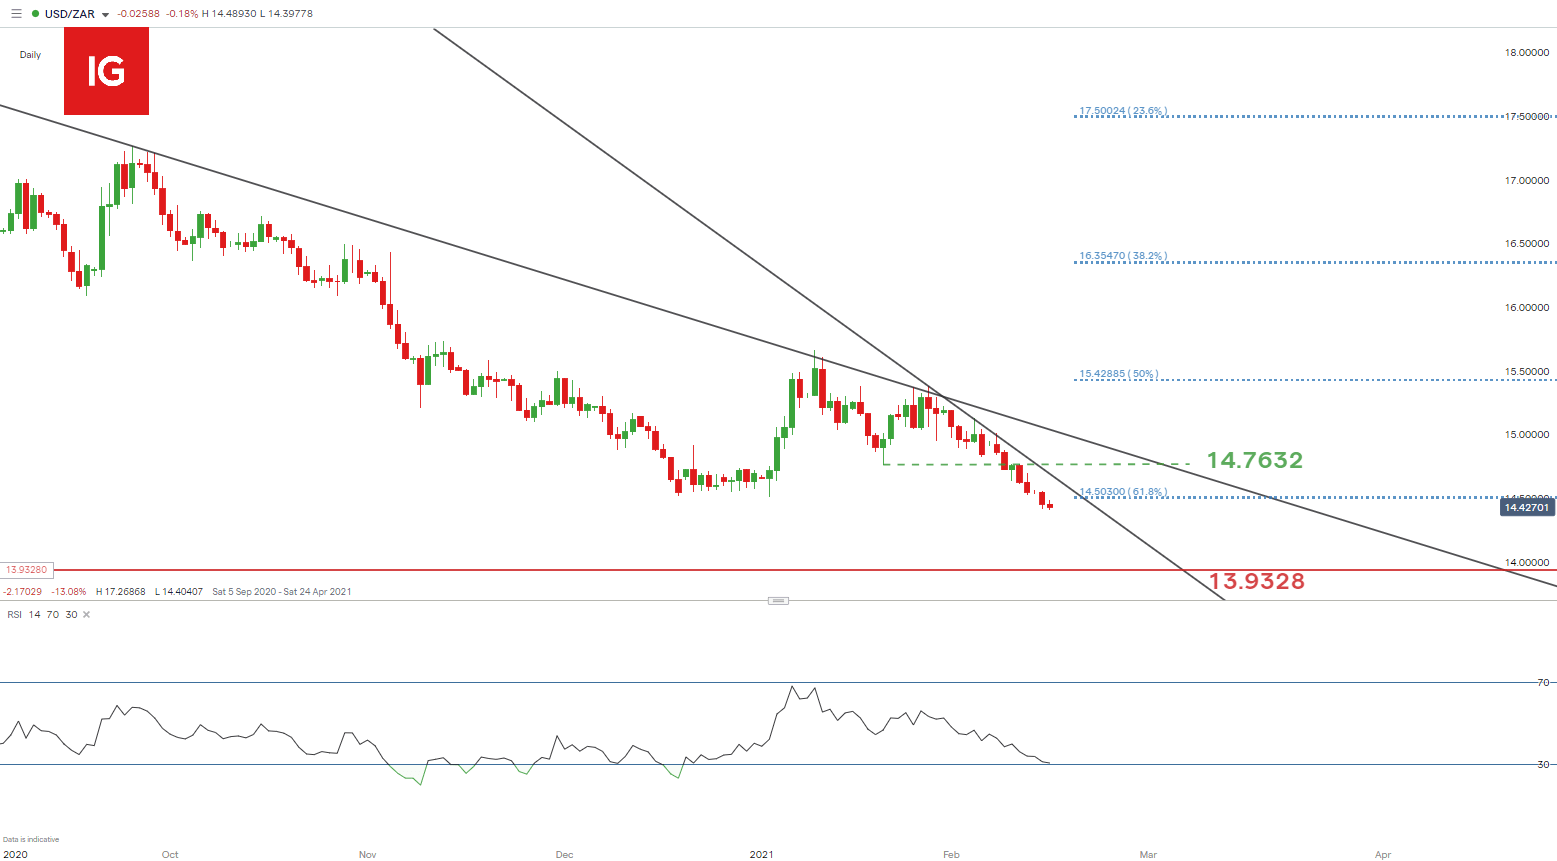
Chart prepared by Warren Venketas, IG
Focusing on the daily chart the trend is firmly to the downside with the RSI approaching oversold territory. This week saw the 14.5000 psychological level breached which may expand on the already strong down move toward the prior swing low at 13.9328 (January 2, 2020).
A reversal could also unfold with the initial resistance zone at 14.5000 which coincides with the 61.8% Fibonacci level. 14.7632 will succeed as secondary resistance should a strong bullish move ensue.
Overall, the Rand is at a key area of confluence which should be approached with caution when identifying a directional bias. More confirmation and data may be required before entering the market.
USD/ZAR: KEY TECHNICAL POINTS TO CONSIDER
- Trendline support monthly chart
- 14.5000resistance
- 13.9328 support target
- Oversold RSI on monthly chart (38)
- Oversold RSI on daily chart
— Written by Warren Venketas for DailyFX.com
Contact and follow Warren on Twitter: @WVenketas
Be the first to comment