

Tomasz Śmigla/iStock via Getty Images
I see Mueller Industries (NYSE:MLI) as undervalued when compared to industry peers. And the company has shown exponential growth since 2020. The company has expanded its earnings from $274.1 million in 2020 to $899.2 TTM. It looks to me like the various actions taken in divestments and acquisitions are bearing fruit.
From 2020 through 2021, Mueller Industries took the following actions:
-
Acquired Kessler Sales & Distribution allowing MLI to expand its core business in the U.S.
-
Expanded its flex duct business by acquiring Hart & Cooley
-
Divested four non-core businesses
-
Invested in a state-of-the-art copper scrap refining system in the U.K.
-
Acquired the majority ownership of a Middle East copper tube joint venture.
The Middle East joint venture is of particular interest. EMEA sales account for only 9% of MLI sales. However, the company has built the first and only, for now at least, copper tube manufacturing plant to serve the regional market.
This flurry of acquisitions and divestments has coincided with the company’s sharp increase in earnings, EPS, free cash flow, and a decline in the liabilities to assets ratio. From what I see the MLI stock price has not matched the performance of these metrics.
MLI is also the only vertically integrated manufacturer of copper tube and brass forgings in North America. This feature should allow them to competitively price their products and maintain their self-acclaimed #1 or #2 positions in their core products.
Let’s take a closer look at Mueller Industries, through its fundamentals, industry trend, and technicals.
Mueller Industries Fundamentals
MLI has increased its earnings by 325.15% since 2018, and most of that has been achieved since 2020. The increase in EBITDA for 2021 was 136.48% over 2020, while the TTM shows an increase of 38.72% over 2021.
EPS has also kept a good pace with an increase of 571.12% over 2018 when compared to the TTM. We’ll look at comparisons of some metrics with the sector average in the Quant rating section. Again, the share price doesn’t look to me like it has caught up with this metric so far.
Another show of financial strength comes from the cash flow which has increased steadily from $167.9 million in 2018 to $647.1 million TTM. This is laudable given the constant and sharp increase and grants the company plenty of leeway in case of any adverse event.
Seeking Alpha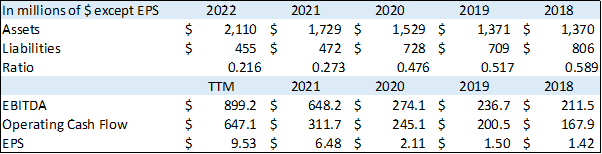
The financial stability of the company has also improved greatly with the liabilities to assets ratio decreasing from 0.589 in 2018 to 0.216 TTM. That’s a low number in absolute terms and low compared to the sector average which I found to be 0.47.
Quant Rating
Let’s take a look at the Quant rating for MLI. The system gives Mueller Industries a score of 4.76 which indicates a strong buy. The table for factor grades shows that Valuation, Profitability, and Revisions have been increasing or stable from 6 months ago.
Seeking Alpha
The Growth factor has been revised down over the past 6 months. But let’s look at the factor breakdown. We can see that the main element of the factor dragging down the rating is CAPEX Growth with a D.
The next elements weighing on this grade are revenue growth and ROE. Revenue growth YoY is under par compared to the sector average by 2.27%. And ROE growth YOY is only 28.88% above the sector average. Both elements get a C+.
But what counts to me is earnings and earnings growth. We see that EBITDA growth YoY is 65.49%, that’s 298.28% above the sector average. So, we see that revenue is not increasing anywhere near that rate. This means the company is holding on to more of its profits.
Another nice feature about this company is the dividend yield, with their last dividend they now have a 1 Year Dividend growth rate (TTM) of 79.59%. That’s 815.31% higher than the sector average. MLI has been paying regular dividends since 2004. And has paid 2 special dividends in 2004 and 2017 of $15 and $8 respectively.
Seeking Alpha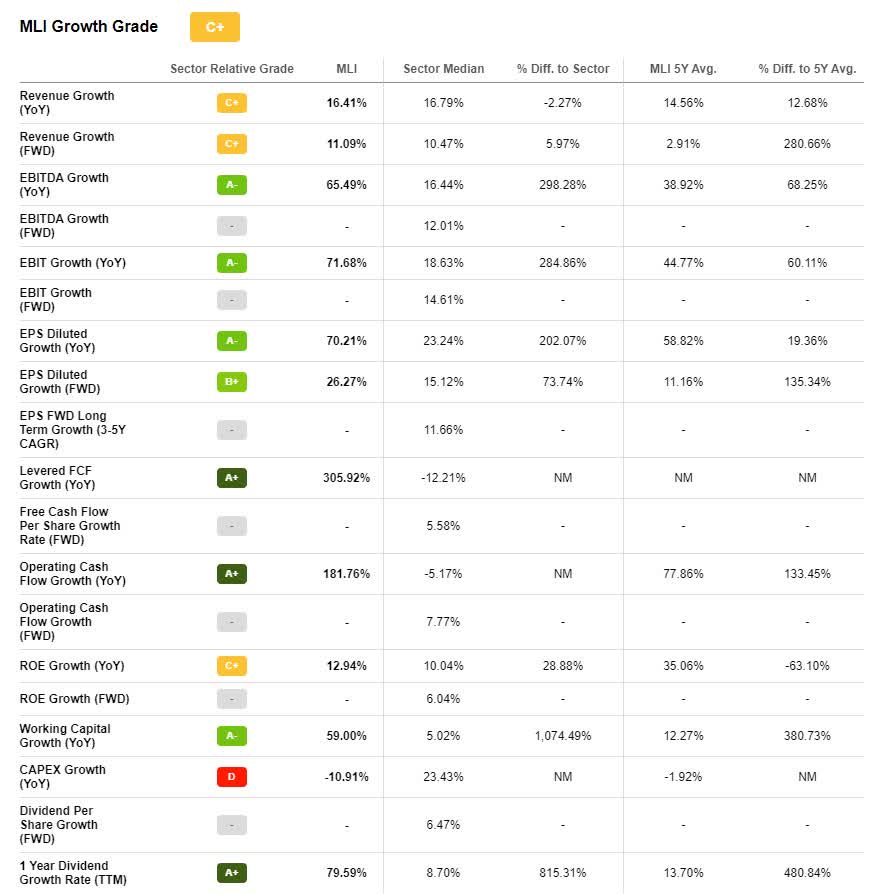
Looking at the Valuation factor we see that P/E TTM is 5.91, which I consider low for any successful business, and 70.21% lower than the sector average. Another ratio I like to look at is enterprise value to EBITDA which is 3.78, again this seems low to me for a very profitable business and is 70.01% lower than average.
Industry Trends
Mueller Industries makes various products in three different segments with the following revenues for 2021:
| Piping Systems | $2,600 million |
| Industrial Metals | $703 million |
| Climate | $495 million |
Most piping systems will be in copper, while the other two segments will also involve a portion of copper pipes. To make it short, copper piping is the firm’s main business interest whether it’s for housing construction, refrigeration, or heating and ventilation.
Piping systems make up 68.45% of MLI’s revenue so I chose to look at the copper piping industry for clues as to the main industry trend for Mueller Industries. According to Research & Markets, the copper piping industry is set to grow by $4.96 billion between 2021 and 2025.
However, this growth comes at a slower rate, decelerating by 3.15% CAGR. A lot will have to do with the construction industry and new home starts. New home starts have been on the decline since May 2022.
A further decline is expected for the next monthly report covering starts for December 2022. The next data for December is expected to reach 1.36 million new starts with the previous month’s reading at 1.427 million starts.
Tradingeconomics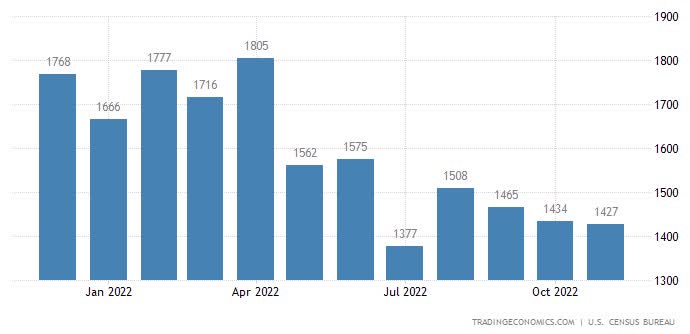
While the Fed continues its monetary tightening policy it may be expected to see a further decline in housing starts. However, Mueller Industries has already shown a capacity to weather any storm. From its latest investor presentation, we can see how revenues declined during the last recession.
Yet incomes, as represented by earnings per share, were higher than expected even though revenues declined. Even during 2022, with home starts declining from May, the company has managed to report profits and beat its latest earnings forecast by $0.39.
Muller Industries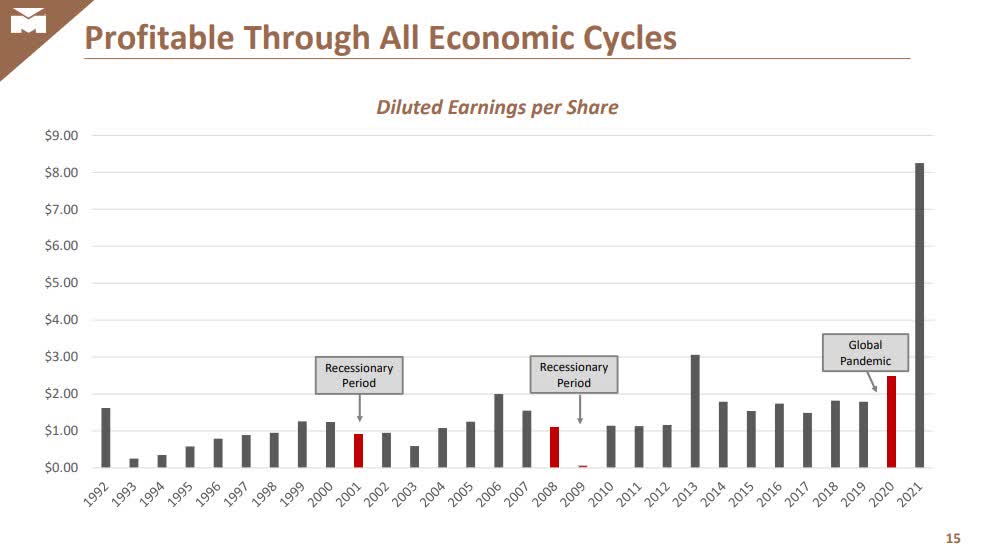
MLI Technical Viewpoint
From a technical perspective, this stock is in a full-on bull trend. Price action is above the cloud on the weekly chart and has been since the last dip in February 2020. The dip below the Ichimoku cloud, which would indicate a bear market, was short-lived due to the pandemic restrictions.
Before that dip, we can see from the monthly chart further down that price only traded below the cloud on one other occasion. Which was the housing bubble that created the 2008 financial crisis. Only on these two occasions has price action given rise to an indication of a bear market.
TradingView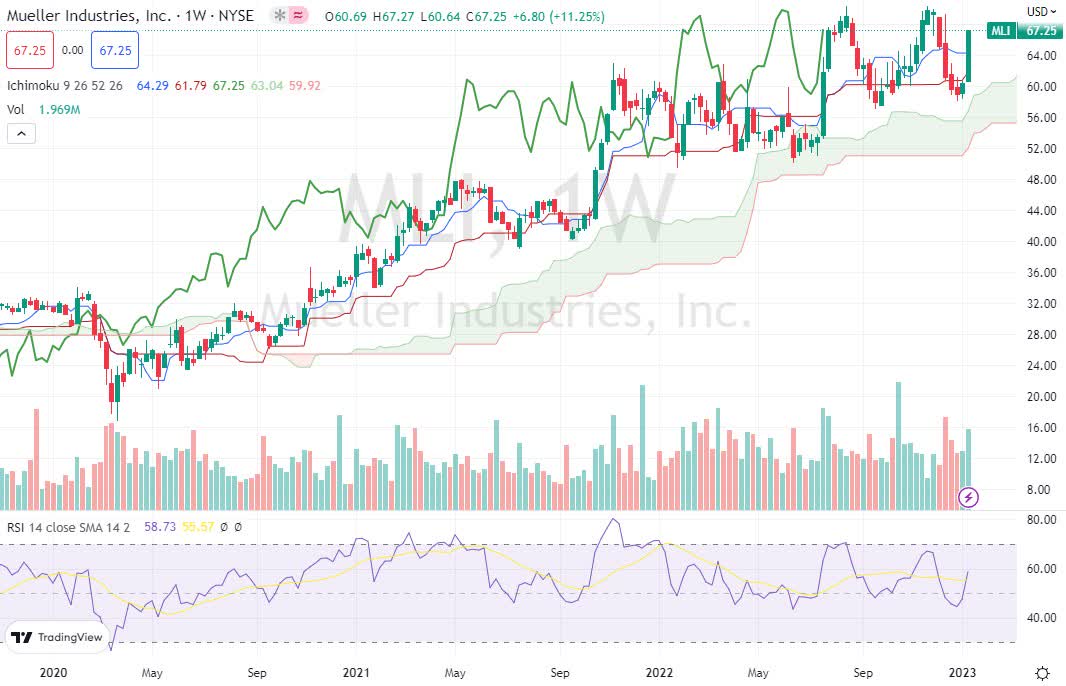
The weekly chart also shows large bullish candles starting from October 2021. Notice that there are many long green candles and no red candles of the same size. This dimensional characteristic of candle charts indicates a strong bullish sentiment.
Seeking Alpha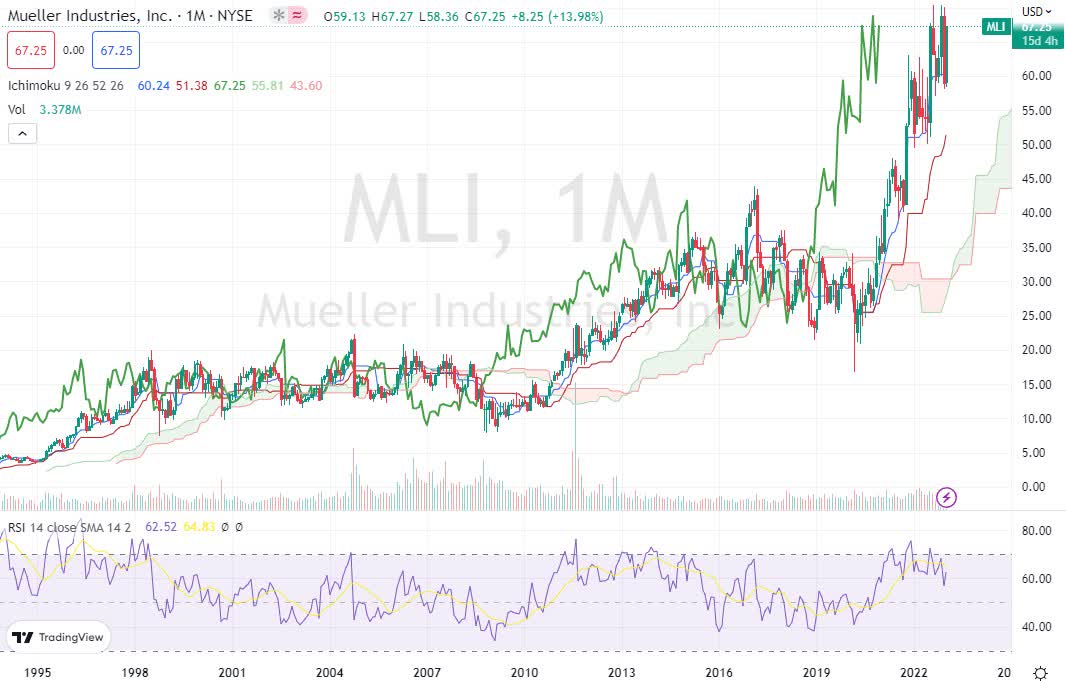
The RSI on both the weekly and monthly charts shows bullish momentum. The weekly RSI has just printed a break above the RSI moving average indicating more upwards price action likely. The monthly RSI is well above the 50 level, currently at 62.5, indicating bullish momentum.
Conclusion
I see this stock as undervalued compared to its peers on some of the most common ratios such as P/E and EV/EBITDA. The company has had impressive earnings growth coupled with a sound balance sheet and plenty of free cash flow.
The model I use that factors in EBITDA, FCF, and liabilities to assets would see this stock at $110. I can speculate that more investors are considering this stock given the increased volatility and expect the valuation ratios to move towards the industry average.
Be the first to comment