

Oil Price Talking Points
The price of oil attempts to retrace the decline from earlier this week despite an unexpected rise in US crude inventories, but crude may continue to track the March range as the Organization of the Petroleum Exporting Countries (OPEC) plan to gradually restore production over the coming months.
Oil Price Forecast: Move Below 50-Day SMA to Keep March Range Intact
The price of oil struggles to hold above the 50-Day SMA ($61.54) as it pulls back from a fresh monthly high ($64.38), and crude may face range bound prices ahead of the OPEC Joint Ministerial Monitoring Committee (JMMC) meeting on April 28 as US stockpiles recover after contracting for three consecutive weeks.
The update from the Energy Information Administration (EIA) showed crude inventories increasing 594K in the week ending April 16 versus forecasts for a 2.975M contraction, and it remains to be seen of OPEC+ will respond to the recent rise in US stockpiles as the group plans to “assess market conditions and decide on production level adjustments for the following month, with every adjustment being no more than 0.5 mb/d.”
However, separate figures from the EIA showed weekly field production holding steady at 11,000K for the second week, and the weakness in US output may keep oil prices afloat as OPEC’s most recent Monthly Oil Market Report (MOMR)emphasizes that “oil demand in the 2H21 is projected to be positively impacted by a stronger economic rebound than assumed last month.”
With that said, the decline from the March high ($67.98) may turn out to be a correction in the broader trend rather than a change in market behavior as US crude production remains below pre-pandemic levels, and recent developments in the Relative Strength Index (RSI) instill a constructive outlook for the price of oil as the indicator breaks out of the downward trend from earlier this year.
Oil Price Daily Chart
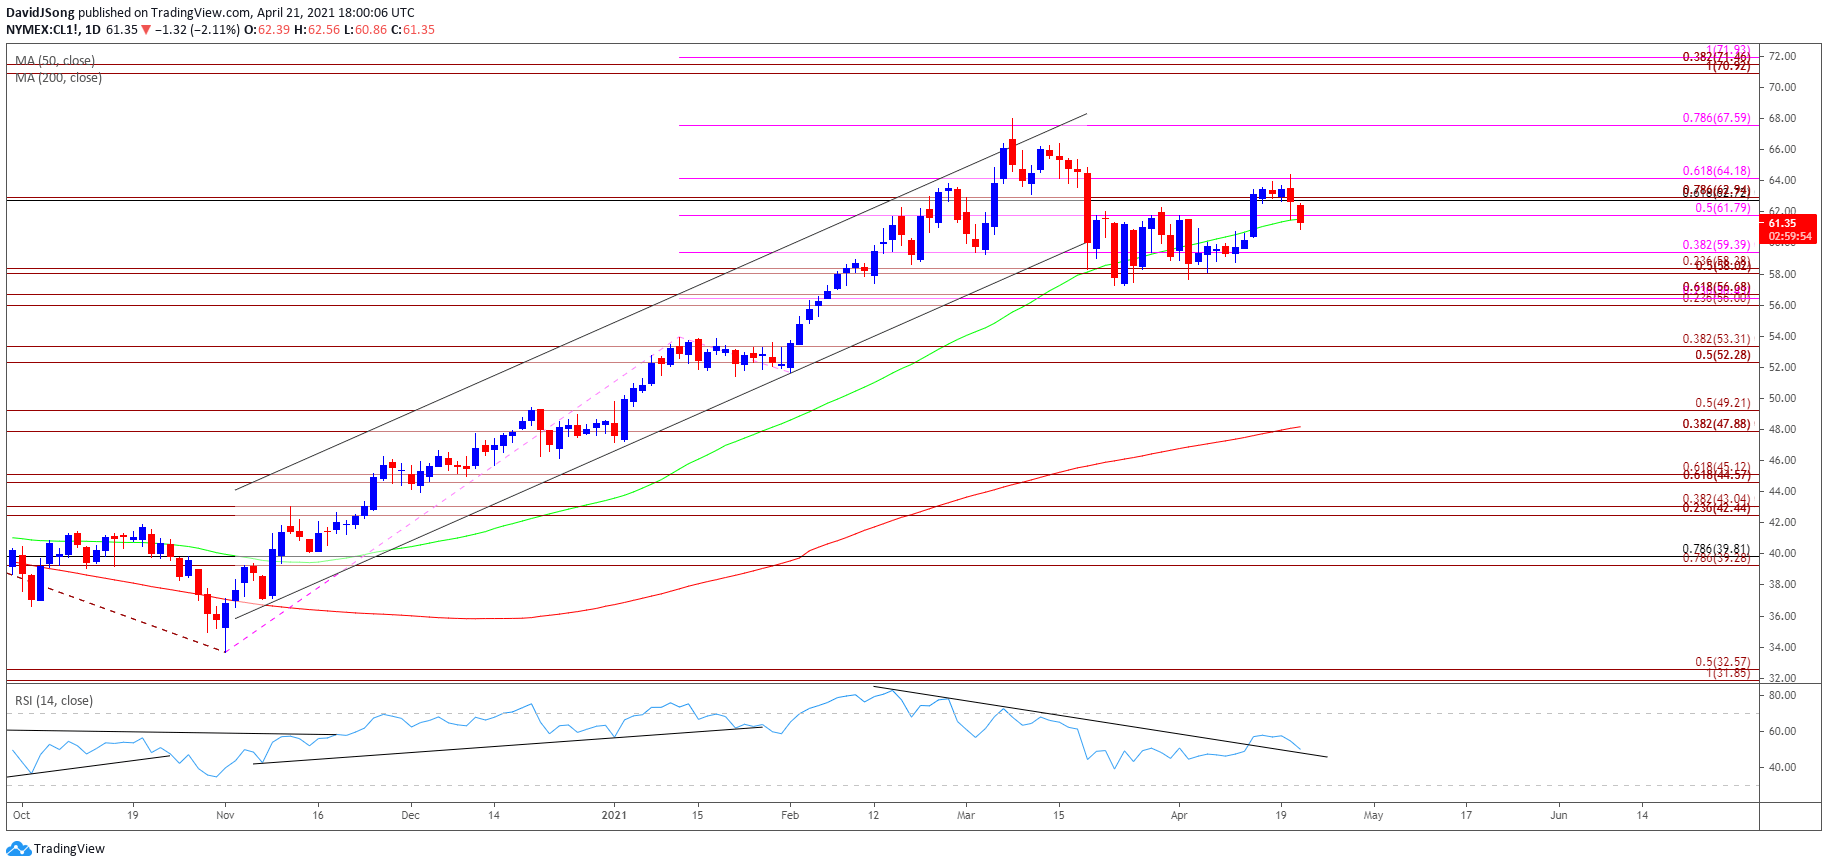
Source: Trading View
- Keep in mind, crude broke out of the range bound price action from the third quarter of 2020 following the failed attempt to close below the Fibonacci overlap around $34.80 (61.8% expansion) to $35.90 (50% retracement), with the price of oil taking out the 2019 high ($66.60)as both the 50-Day SMA ($61.54) and 200-Day SMA($48.18)still reflect a positive slope.
- At the same time, recent developments in the Relative Strength Index (RSI) suggest the decline from the March high ($67.98) may turn out to be a correction in the broader trend rather than a change in market behavior as the indicator breaks out of the downward trend from this year.
- However, the price of oil bounces along the 50-Day SMA ($61.55) as it fails to retain the upward trend from November, and crude may continue to track the March range as it struggles to push back above the $64.20 (61.8% expansion) region.
- In turn, a close below $61.80 (50% expansion) may push the price of oil towards the $59.40 (38.2% expansion) region, with the next area of interest coming in around $58.00 (50% expansion) to $58.40 (23.6% expansion).

Recommended by David Song
Traits of Successful Traders
— Written by David Song, Currency Strategist
Follow me on Twitter at @DavidJSong
Be the first to comment