


There are two things that should be rejected. Paying more for an inferior REIT and being forced to use Getty Images.
Bet_Noire
Get ready for charts, images, and tables because they are better than words. The ratings and outlooks we highlight here come after Scott Kennedy’s weekly updates in the REIT Forum. Your continued feedback is greatly appreciated, so please leave a comment with suggestions.
Markets went wild in June. The excitement is still running in July. We’ve seen some big price swings and some big rate swings. Let’s run through a few recent events.
The yield curve is inverted with 2-year rates at 3.128% and 10-year rates at 2.958%. That’s not pretty:
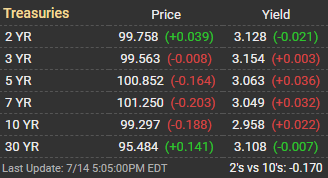
MBSLive
Does that mean mortgage REITs are dead? No. Investors often overstate the importance of the yield curve. Mortgage REITs hedge extensively and it has a significant impact on their results. The inversion isn’t great for investor sentiment and it doesn’t reflect brilliance about how to handle interest rates, but it doesn’t create mortgage REIT death.
What else? We moved Arlington Asset from the “Agency” category to the “Hybrid” category based on the change in their assets.
We picked up coverage of Capital Southwest (CSWC) and dropped coverage of Newtek (NEWT) since NEWT will cease to be a BDC.
Western Asset Mortgage Capital had a 1-for-10 reverse stock split. They’ve been having a rough time since the pandemic.
News on Q2 2022? Orchid Island Capital (ORC) announced a large chunk of book value was lost. It dropped from $3.34 to $2.87. That’s down about 14% in a quarter. Impressed? Me neither. Of course, if you were holding onto shares of ORC, you must’ve ignored all the times we told investors to simply get out.
Scott posted a review of the announcement from ORC mere hours after the release. I’ll share a small part of his commentary (which was longer than this article) here:
As stated in recent mREIT discussions in the chat feature of this Marketplace Service and prior chat notes/assessment articles, unlike most agency mREIT sub-sector peers, ORC was extremely aggressive raising capital throughout 2021. As various other agency mREIT peers were lowering the size of each company’s investment portfolio during 2021 (correctly anticipating MBS price declines were likely coming), ORC went the opposite direction and was aggressively purchasing fixed-rate agency MBS and interest-only (“IO”) securities during 2021. While this trend/strategy continued to move “full steam ahead” during the fourth quarter of 2021, ORC had to quickly “reverse course” during the first and second quarters of 2022 as fixed-rate agency MBS prices quickly and notably declined. Notably expanding ORC’s MBS/investment portfolio last year was just poor timing by management (knowing qualitative tightening was bound to occur). This particular strategy negatively impacted ORC’s quarterly BV results as spread/basis risk notably increased throughout the first quarter of 2022 and remained elevated during the second quarter of 2022.
How poorly did ORC’s strategy work? When ORC provided their estimated total return on equity for Q1 2022, it was projected at negative 19.5%. That was based on a book value of $3.34, which turned out to be right. In brief, that was two garbage quarters in a row.
By our estimates, the price to current book today for ORC is comparable to the price to current book for DX. How funny is that? DX was the one that shocked investors with a book value gain in Q1 2022. To be fair, there’s always a margin of error in these estimates. We have a very good idea of ORC’s BV for the end of the quarter, but we’re still working from projections on DX and they may have modified the portfolio during the quarter. Regardless, I think DX makes better choices in managing shareholders’ money.
The mortgage REIT falling hardest today was ARR. Shares were down 5.3% on the day. That’s a pretty big drop, but shares still trade above 90% of our projected book value for 6/30/2022.
It’s been a wild quarter, so we will probably see a few more surprises during the quarterly earnings updates than we normally expect. Each management team handles the changes in the environment differently. Some are better, some are like ORC.
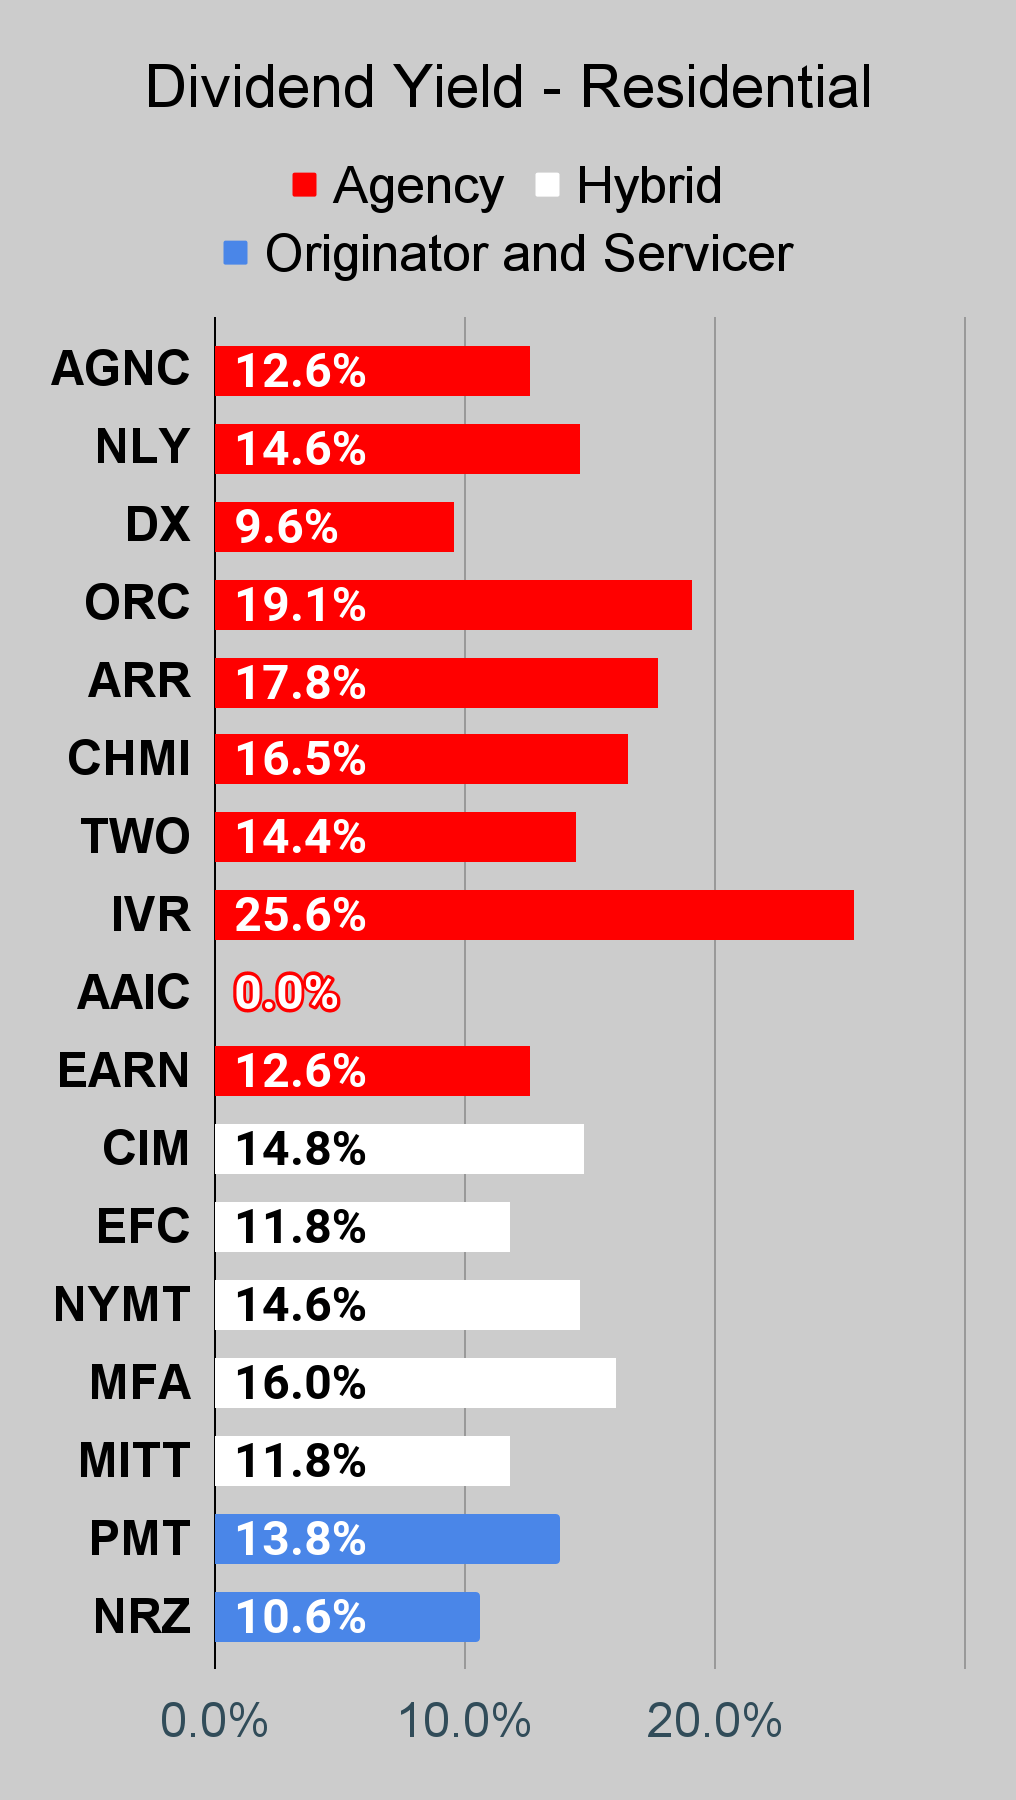
Some readers might be wondering if any mortgage REITs will be cutting dividends. Probably. Scott provides a table in his weekly articles that shows the recent dividends and our projections, along with our projected range for the next quarter and the probability (our estimate) of hitting that range.
Of course, investors should know (but often don’t) that they can’t just close their eyes and hold the mortgage REIT for dividends. There are some equity REITs that are very reliable dividend growth machines, but you want to be active in managing mortgage REIT positions. You’re not looking for the mortgage REIT to generate massive gains in book value, though they do happen occasionally after spreads between assets and hedges widen out. We’ve seen some widening already. What you’re really doing is finding opportunities to place a trade where you can capture a significant increase in the price-to-book ratio.
For stable income, you’re using the preferred shares instead. The majority of the preferred shares did not delay dividends in the pandemic. Among those that did delay dividends, all of them resumed dividends and paid back the preferred dividend in full for all missing quarters. There are several bargains in the preferred shares today, to go along with a handful of bargains in the common shares.
Absurd Ratios
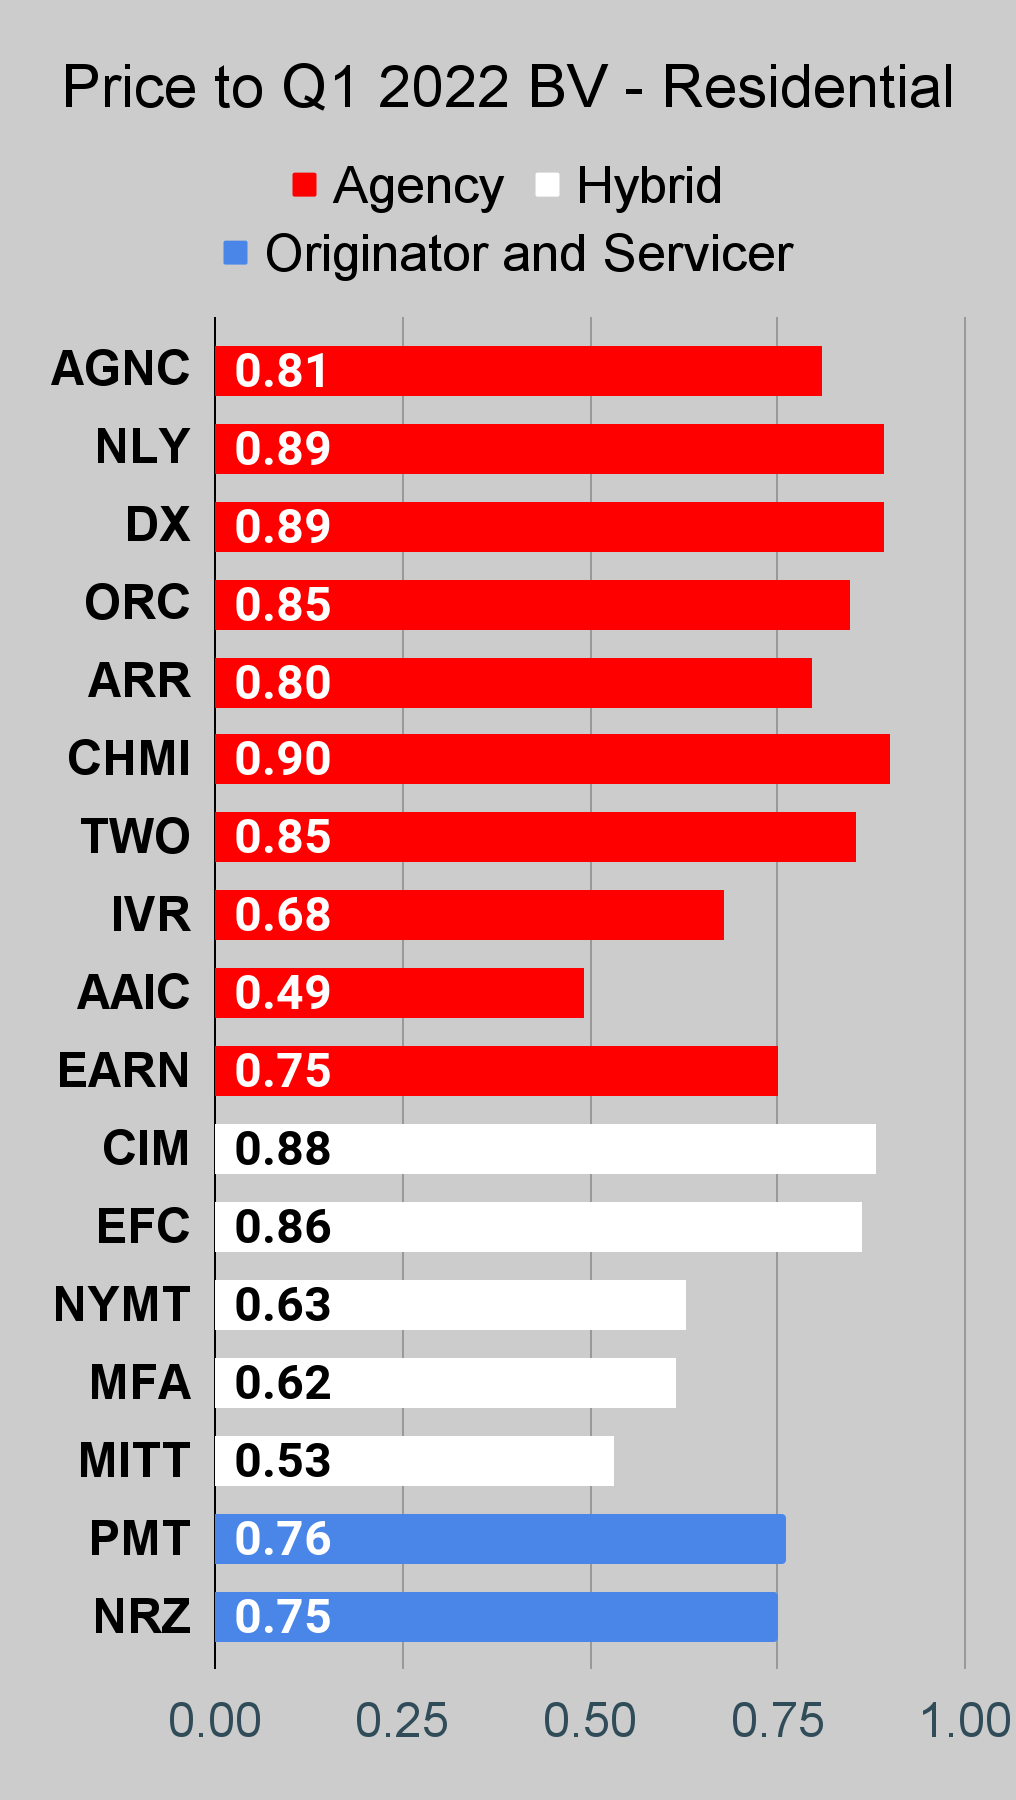
By our estimates, ORC trades around 96% of book value and ARR trades around 92% of book value. On the other hand, MFA trades around 67%, NRZ around 75%, and PMT around 79%. Does that seem reasonable to you? It doesn’t to me. Do you think ORC and ARR are about to be dramatically better at managing investors’ money than MFA, NRZ, and PMT? If so, why would you think that? Did you get the tickers mixed up? The risk/reward between different mortgage REITs is becoming significantly skewed. Investors in the sector need to be picking individual shares carefully, rather than going into the sector blindly.
In my opinion, those ratios for MFA, NRZ, and PMT are too low. I won’t call ARR cheap at 92% of our projection for book value, but it’s no longer utterly terrible. You know what would make me really happy today? If I could buy DX at a discount greater than 20%. We’re getting great deals on MFA, NRZ, and PMT, but I’d love to get that kind of discount on DX also. Probably won’t happen, but it would be nice.
The rest of the charts in this article may be self-explanatory to some investors. However, if you’d like to know more about them, you’re encouraged to see our notes for the series.
Stock Table
We will close out the rest of the article with the tables and charts we provide for readers to help them track the sector for both common shares and preferred shares.
We’re including a quick table for the common shares that will be shown in our tables:
Let the images begin!
Residential Mortgage REIT Charts
Note: The chart for our public articles uses the book value per share from the latest earnings release. Current estimated book value per share is used in reaching our targets and trading decisions. It is available in our service, but those estimates are not included in the charts below.
 The REIT Forum |
 The REIT Forum |
 The REIT Forum |
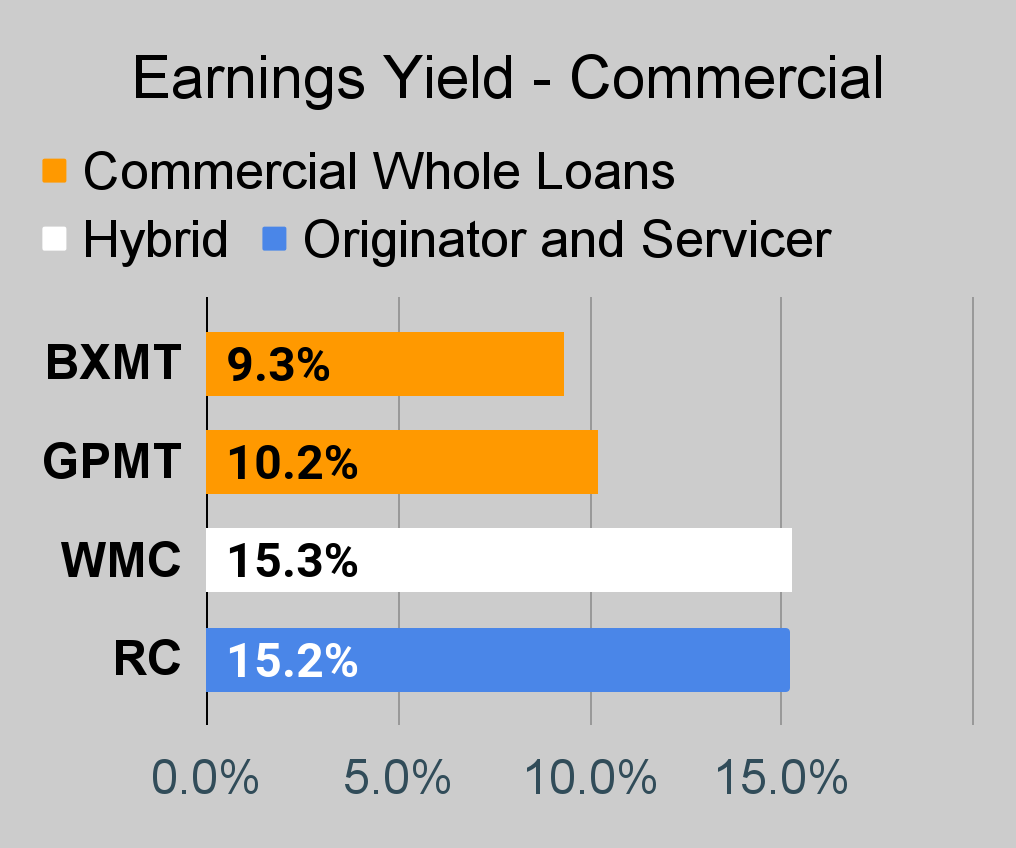
Commercial Mortgage REIT Charts
 The REIT Forum |
 The REIT Forum |
 The REIT Forum |
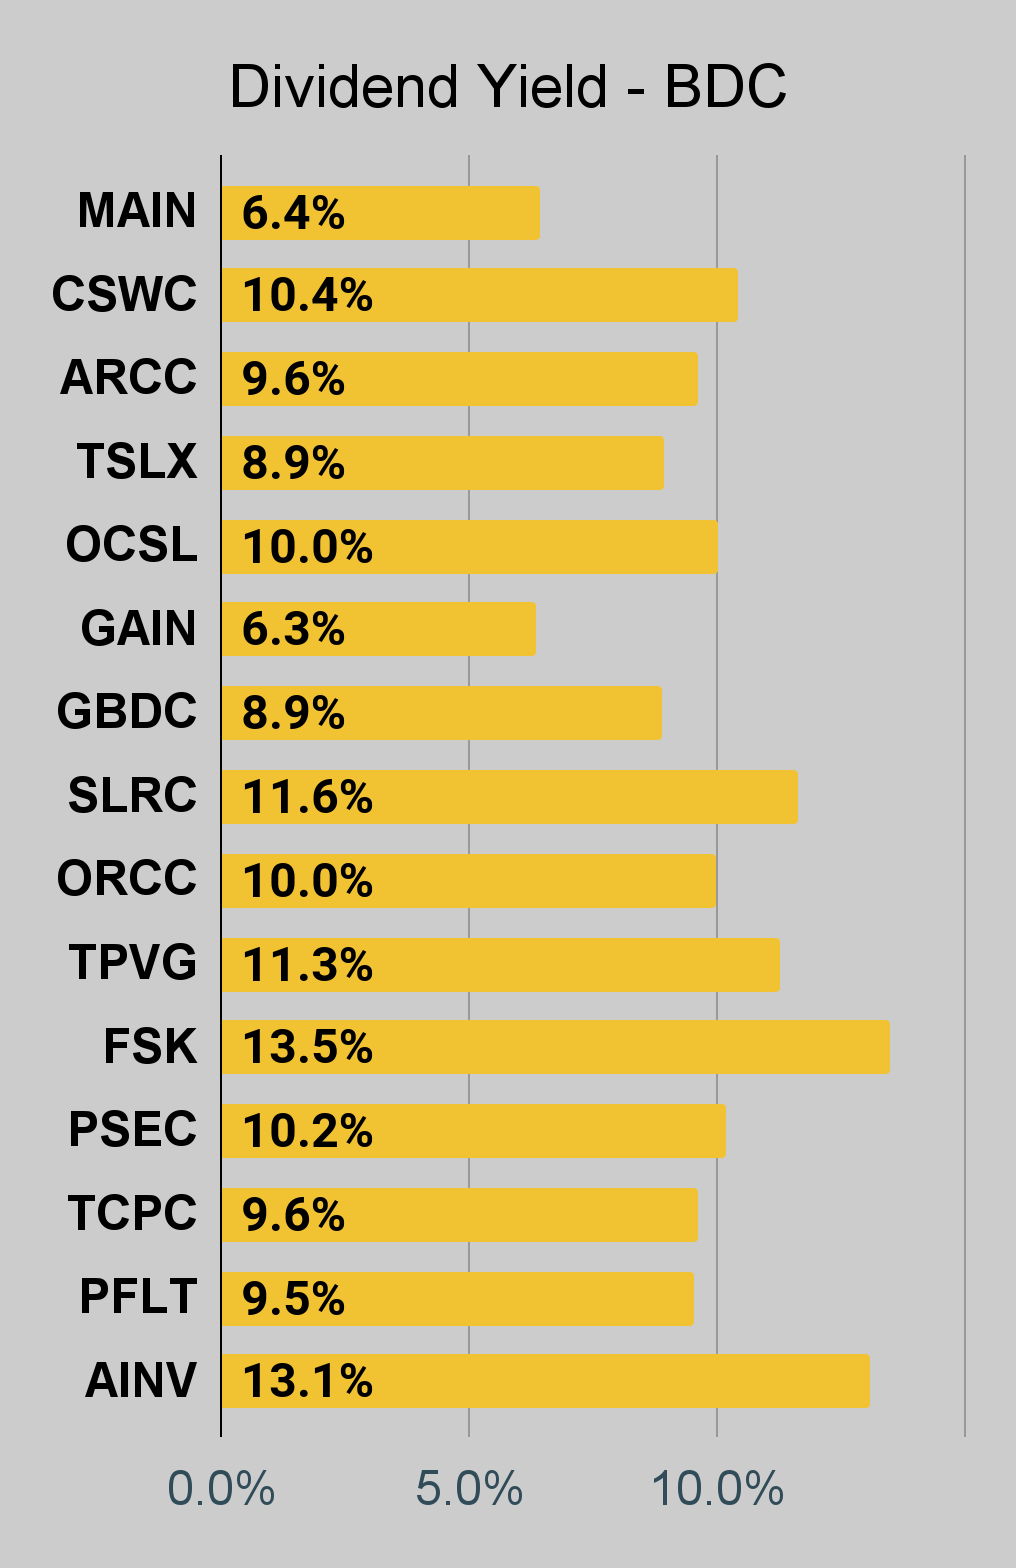
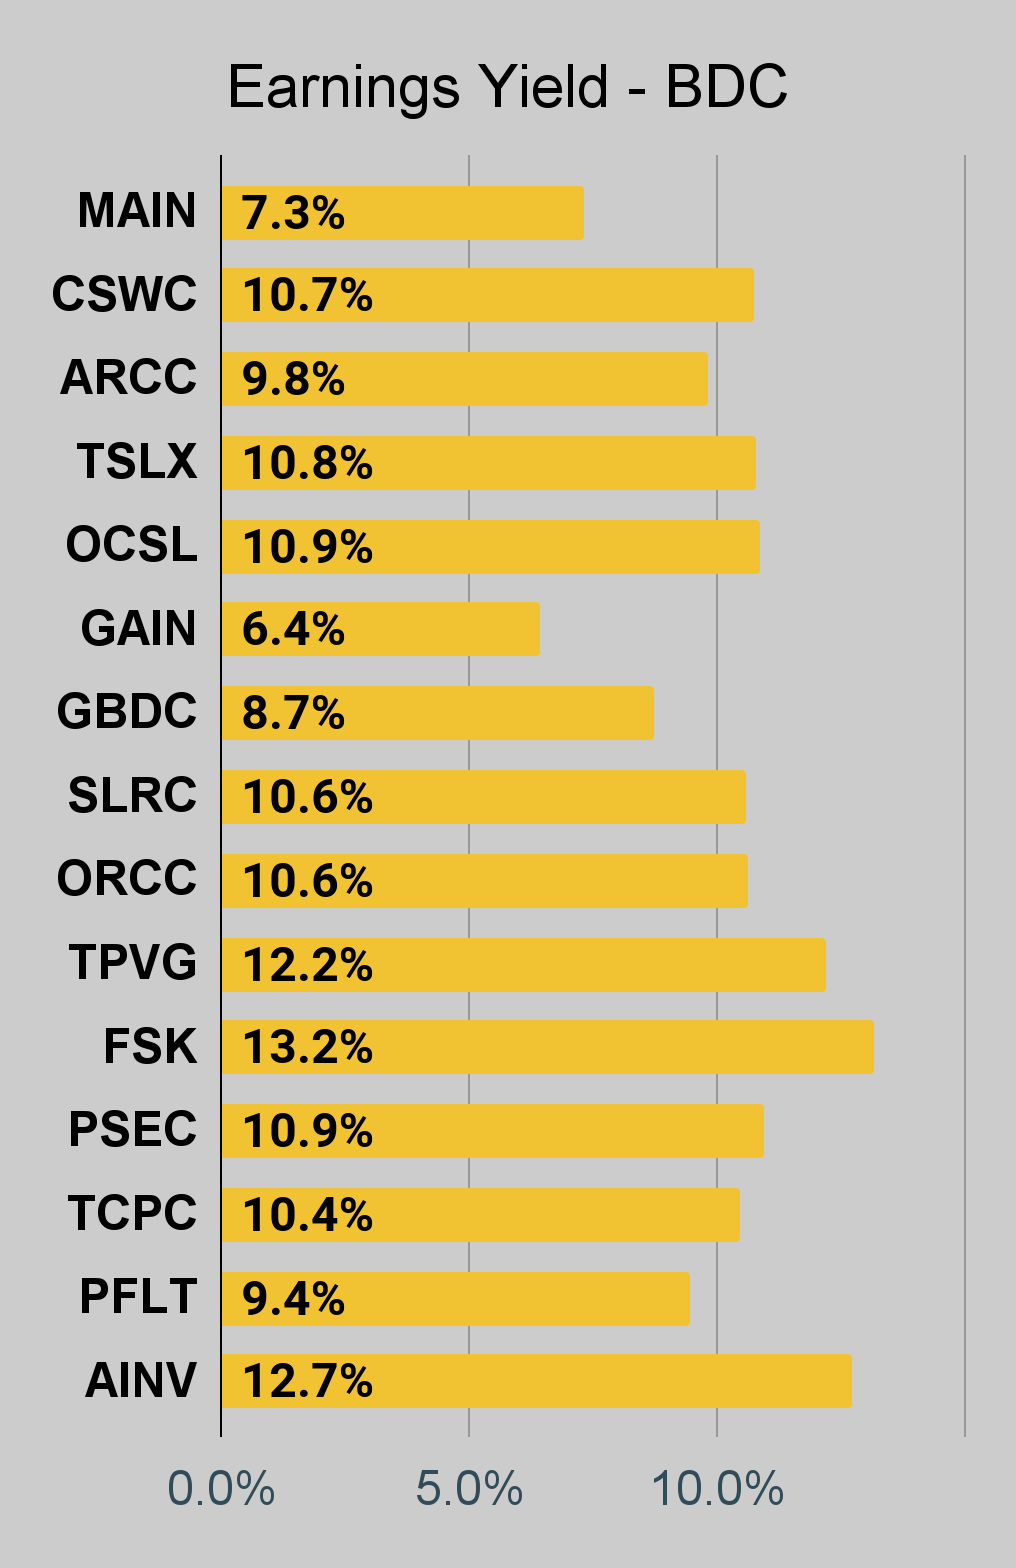
BDC Charts
 The REIT Forum |
 The REIT Forum |
 The REIT Forum |
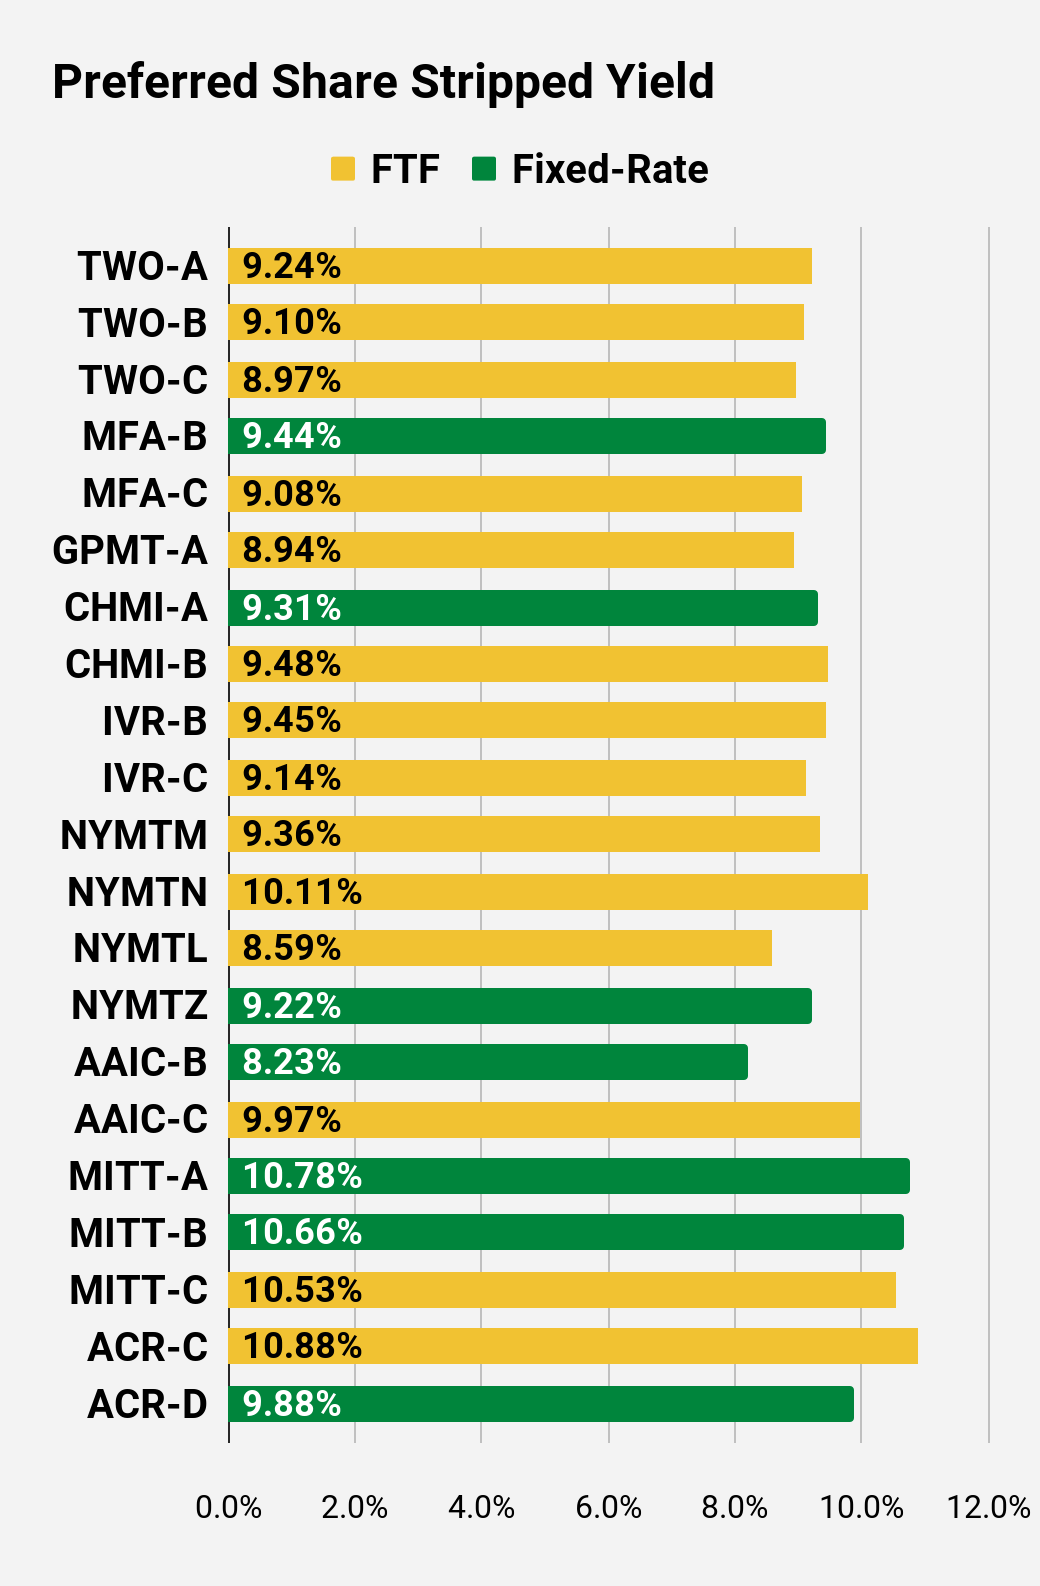
Preferred Share Charts
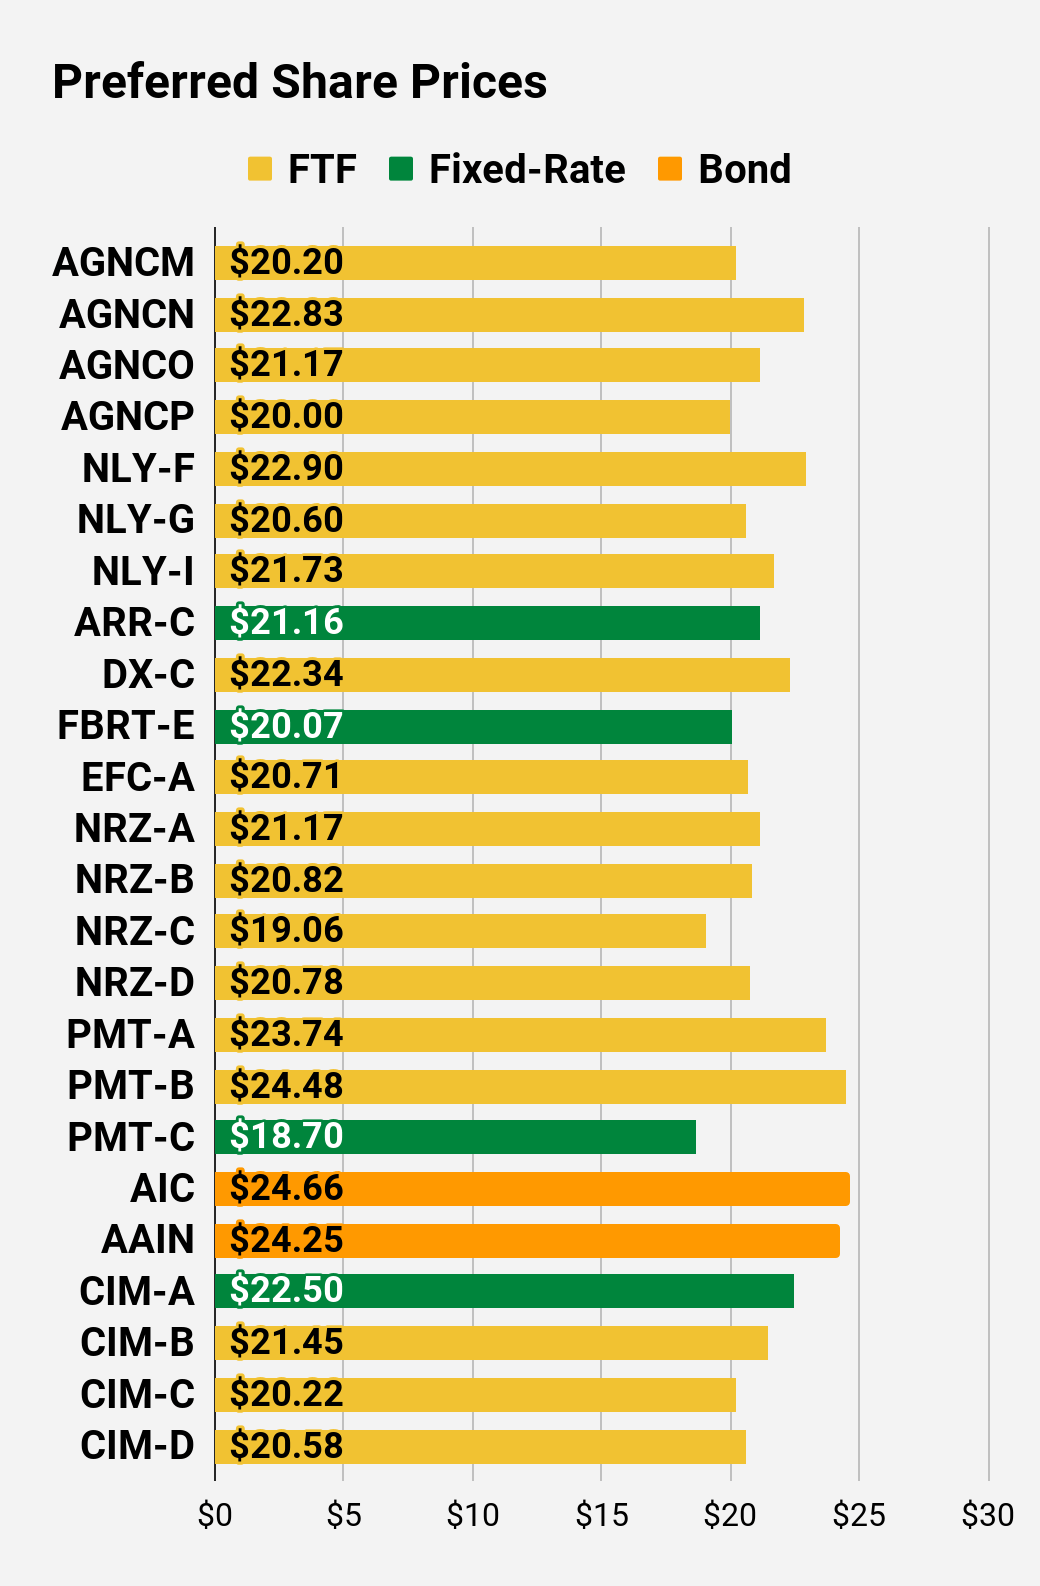 The REIT Forum |
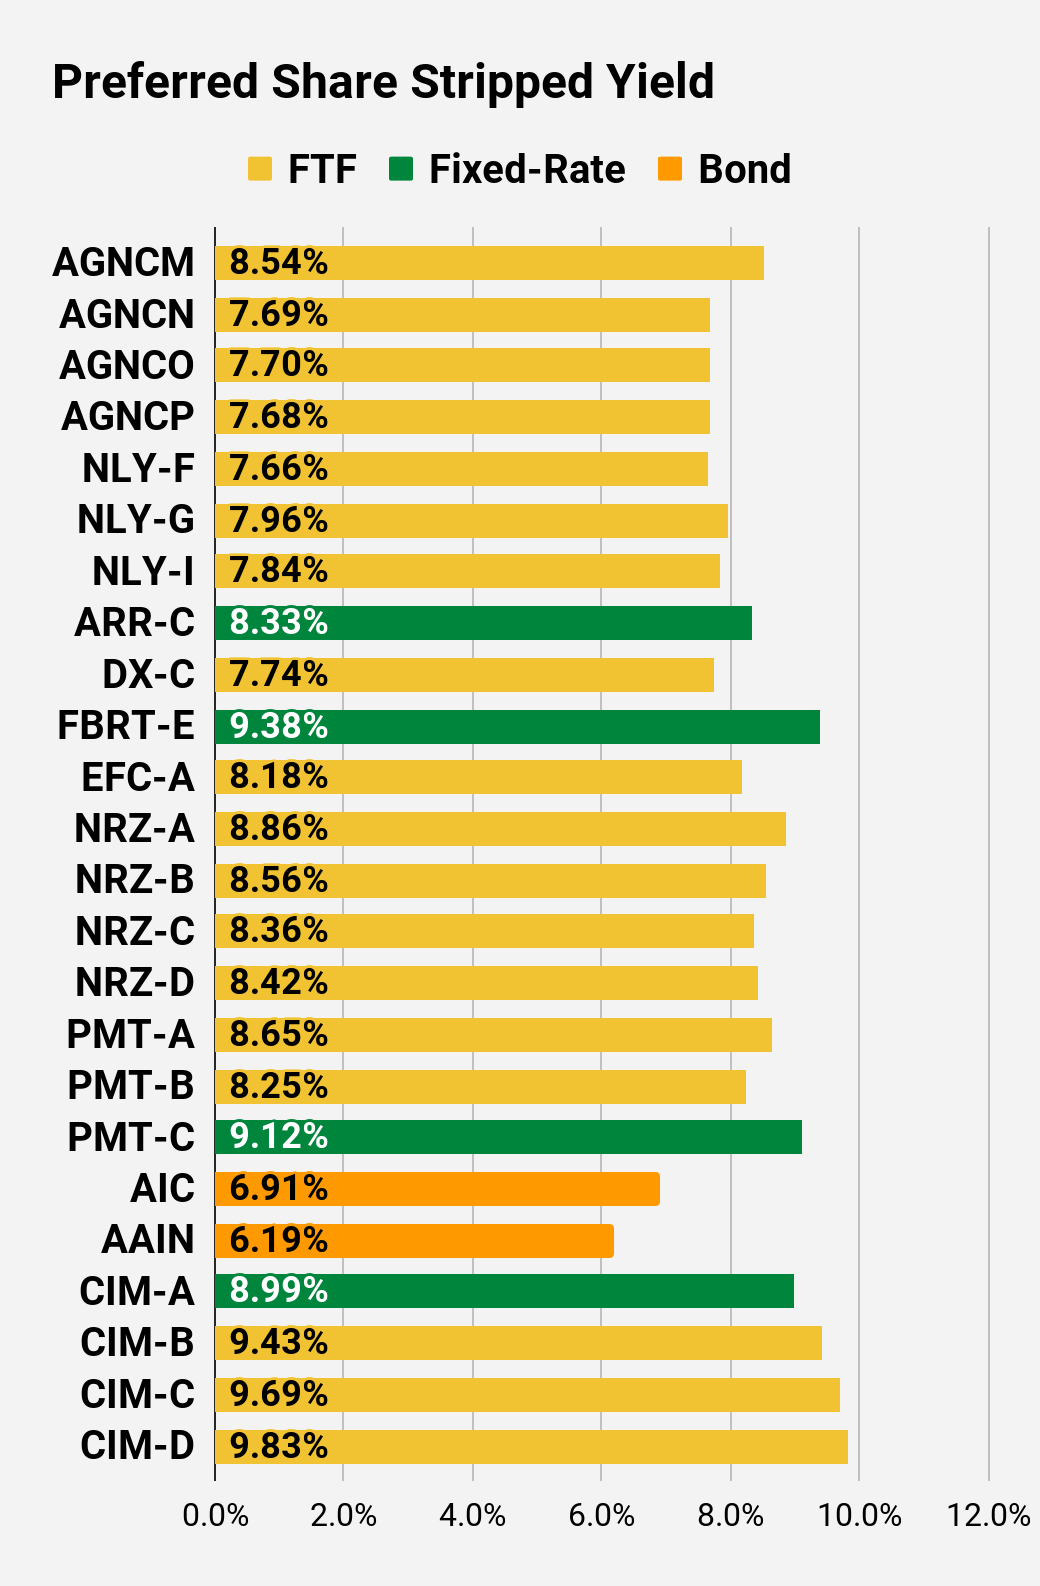 The REIT Forum |
 The REIT Forum |
 The REIT Forum |
 The REIT Forum |
 The REIT Forum |
Preferred Share Data
Beyond the charts, we’re also providing our readers with access to several other metrics for the preferred shares.
After testing out a series on preferred shares, we decided to try merging it into the series on common shares. After all, we are still talking about positions in mortgage REITs. We don’t have any desire to cover preferred shares without cumulative dividends, so any preferred shares you see in our column will have cumulative dividends. You can verify that by using Quantum Online. We’ve included the links in the table below.
To better organize the table, we needed to abbreviate column names as follows:
- Price = Recent Share Price – Shown in Charts
- BoF = Bond or FTF (Fixed-to-Floating)
- S-Yield = Stripped Yield – Shown in Charts
- Coupon = Initial Fixed-Rate Coupon
- FYoP = Floating Yield on Price – Shown in Charts
- NCD = Next Call Date (the soonest shares could be called)
- Note: For all FTF issues, the floating rate would start on NCD.
- WCC = Worst Cash to Call (lowest net cash return possible from a call)
- QO Link = Link to Quantum Online Page
Second Batch:
Strategy
Our goal is to maximize total returns. We achieve those most effectively by including “trading” strategies. We regularly trade positions in the mortgage REIT common shares and BDCs because:
- Prices are inefficient.
- Long-term, share prices generally revolve around book value.
- Short-term, price-to-book ratios can deviate materially.
- Book value isn’t the only step in analysis, but it is the cornerstone.
We also allocate to preferred shares and equity REITs. We encourage buy-and-hold investors to consider using more preferred shares and equity REITs.
Performance
We compare our performance against 4 ETFs that investors might use for exposure to our sectors:
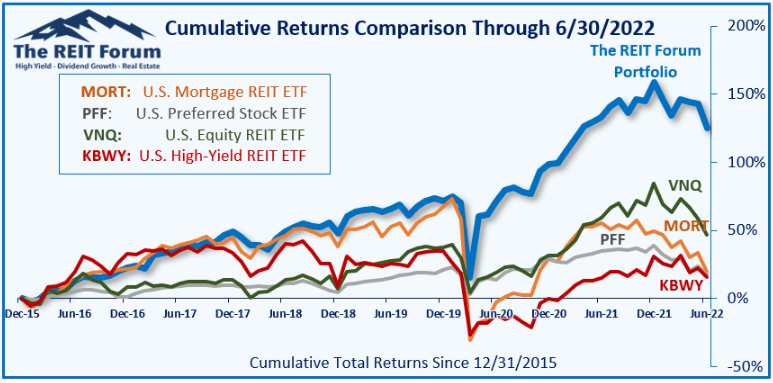
The REIT Forum
The 4 ETFs we use for comparison are:
|
Ticker |
Exposure |
|
One of the largest mortgage REIT ETFs |
|
|
One of the largest preferred share ETFs |
|
|
Largest equity REIT ETF |
|
|
The high-yield equity REIT ETF. Yes, it has been dreadful. |
When investors think it isn’t possible to earn solid returns in preferred shares or mortgage REITs, we politely disagree. The sector has plenty of opportunities, but investors still need to be wary of the risks. We can’t simply reach for yield and hope for the best. When it comes to common shares, we need to be even more vigilant to protect our principal by regularly watching prices and updating estimates for book value and price targets.
Ratings:
Be the first to comment