

Michael Vi/iStock Editorial via Getty Images
In my last article on Morgan Stanley (NYSE:MS), Morgan Stanley: the stock is worth more than $100, I calculated a fair price of $102 per share for the stock. As the company reported its 1Q 2022 financial results, I upgraded my valuation to $106 per share. I calculate this fair price using the free cash flow to equity (FCFE) model, which is based on the estimated FCFE of the company from 2022 to 2032. It is worth noting that this increase in the stock’s fair price is due to the company’s riskier performance. Also, in this article, I used another method to evaluate Morgan Stanley. Based on the price to book value method, which represents the real-market data, I calculate a fair price of $91 for MS. In a word, the stock is a Buy.
Morgan Stanley 1Q 2022 financial results
In its 1Q 2022 financial results, Morgan Stanley reported fourth-quarter net revenues of $14.8 billion, compared to a 1Q 2021 net revenues of $15.7, down 6%. Also, the company announced a 1Q 2022 net income applicable to Morgan Stanley of $3.7 billion, or $2.02 per diluted share, compared with a 1Q 2021 net income of $4.1 billion, or $2.19 per diluted share, down 10%. Morgan Stanley’s provision for credit losses increased from $-98 million to $57 million, implying the company’s estimates of its allowance are increasing, which means a higher credit risk for the company. In 1Q 2022, MS’s return on equity dropped by 220 bps to 14.7% from 16.9% in 1Q 2021. Morgan Stanley’s loans increased by 4% to $209 billion from 4Q 2021 to 1Q 2022. Also, the company’s loans by the end of 1Q 2022 increased by 21%. In the first quarter of 2022, MS reported total assets of $1222 billion, compared to $1159 billion a year ago.
James P. Gorman, the chairman, and CEO of Morgan Stanley commented that in the face of the market volatility and economic uncertainty, the firm delivered a strong ROTCE. The company reported a 1Q 2022 ROTCE of 19.8%, compared to a return on tangible equity of 21.1% in 1Q 2021. The CEO said that this strong ROTCE, despite the current market conditions, demonstrates the resilience of MS’s global diversified business. “The quarter’s results affirm our sustainable business model is well-positioned to drive growth over the long term,” Gorman commented.
Strong performance across businesses and geographies (mainly due to continued client engagement), especially in EMEA caused the equity net revenues to increase in the last 12 months. Also, as a result of acquiring the Eaton Vance, MS’s asset management and related fees increased by 26$ to $1388 million in 1Q 2022. On the Other hand, the uncertain market environment and macroeconomic conditions caused Morgan Stanley’s investment banking revenues to drop in the last 12 months. However, due to higher levels of completed M&A, the company’s advisory revenues (a part of investment banking revenues) increased. Overall, MS’s investment banking revenues dropped by 37% from a year ago. As part of its share repurchase program, Morgan Stanley repurchased $2.9 billion of its outstanding common shares in 1Q 2022. However, the company’s period-end shares in 1Q 2022, are still 6% lower than the period-end common shares last year. Furthermore, MS’s tax rate decreased by 300 bps from 22% in 1Q 2021 to 19% in 1Q 2022.
Morgan Stanley’s Performance
Banks and banking stocks operate differently compared to other companies since banks’ main product to sell is money. The efficiency ratio and return-on-assets ratio are useful multiples to evaluate banks and financial investment companies. As an earning capacity of profit metric, Morgan Stanley’s ROA is the highest amount after Goldman Sachs (GS), which indicates that the management could use the bank’s assets to make profits for investors (see Figure 1).
Figure 1 – Morgan Stanley’s ROA vs. peers
Ycharts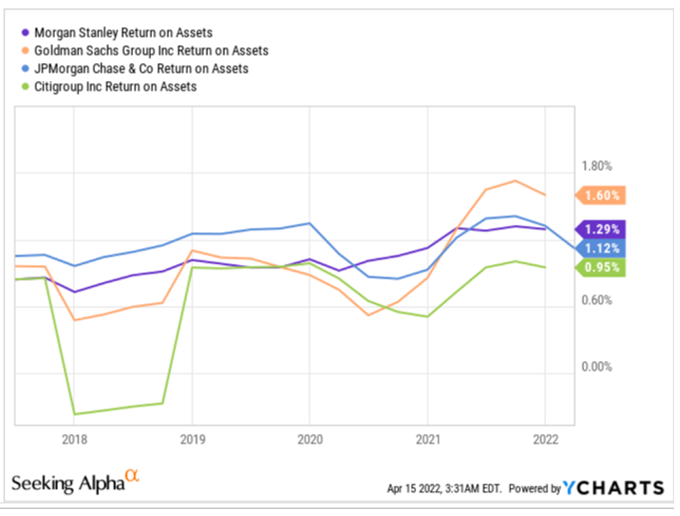
To investigate if the management could generate profits for shareholders and to analyze the productivity of the bank’s operations, I update and analyze the efficiency ratio as a quick comparison tool between the peers. Morgan Stanley’s efficiency ratio increased by 66 bps to 61.39% TTM, compared to 2021. Goldman Sachs and JPMorgan’s (JPM) efficiency ratios increased by 216 bps and 344 bps, respectively (see Figure 2).
Figure 2 – Morgan Stanley’s efficiency ratio vs. peers
Author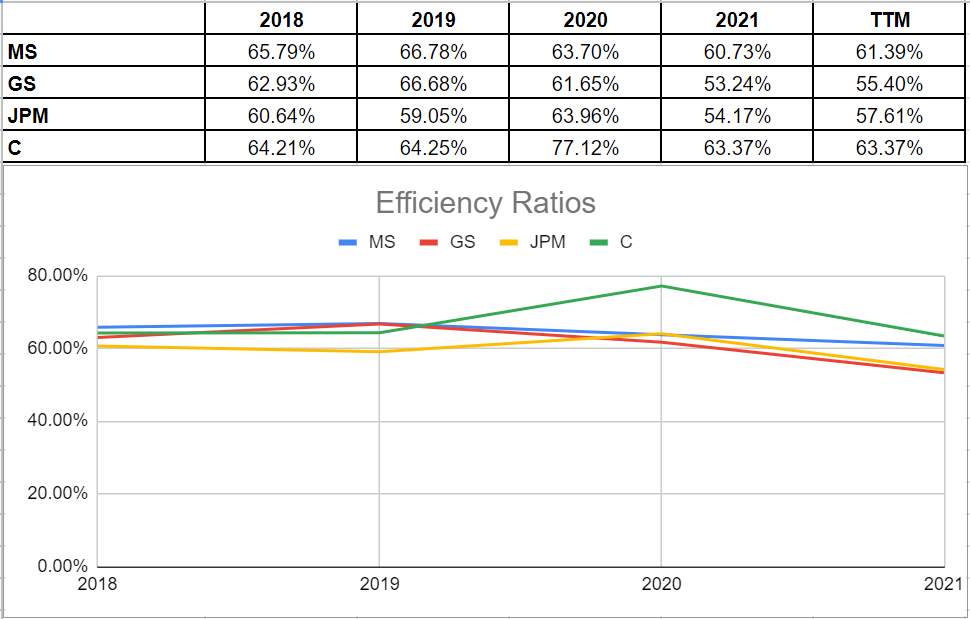
MS Stock valuation: Two different methods
First method: FCFE
In my last article on MS, Morgan Stanley: the stock is worth more than $100, I used the free cash flow to equity model to calculate the fair value of the stock. I defined four scenarios to estimate MS’s total assets growth rate from 2022 to 2032, four scenarios for the company’s capital Tier 1 ratio, and three scenarios for MS’s cost of equity. I calculated the stock’s fair value, ranging from $90 to $142. I also narrowed this range down to $90 to $119 as I don’t see the company allowing the capital Tier 1 ratio to drop to 10.5% (the minimum Tier 1 ratio under Basel III requirements). In my valuation, my base case scenario was a total assets CAGR of 5%, a Tier 1 ratio of 18%, and a COE of 8.13%. According to my base case scenario, I calculated a fair price of $102 for Morgan Stanley’s stock.
According to Morgan Stanley’s 4Q and full-year 2021 financial results, the bank added $438 billion in net new assets in 2021. On the other hand, in the first quarter of 2022, Morgan Stanley added $142 billion in net new assets. Thus, I still use the total assets CAGR of 5% as my base case scenario. Also, I use the COE of 8.13% as my base case scenario. However, I use a capital Tier 1 ratio of 17% instead of a capital Tier 1 ratio of 18% as my base case scenario. Figure 1 shows that based on the standardized approach, in the first quarter of 2022, Morgan Stanley’s capital Tier 1 ratio dropped by 250 bps to 16%, from 18.5% in the fourth quarter of 2021. Also, the company’s common equity Tier 1 (CET1) ratio dropped by 220 bps to 14.5% in 1Q 2022 from 16.7% in 4Q 2021. Based on the advanced approach, MS’s capital Tier 1 ratio dropped by 160 bps to 17.6% in 1Q 2022 from 19.2% in 4Q 2021.
Figure 3 – Morgan Stanley’s regulatory capital
Morgan Stanley’s 1Q 2022 financial report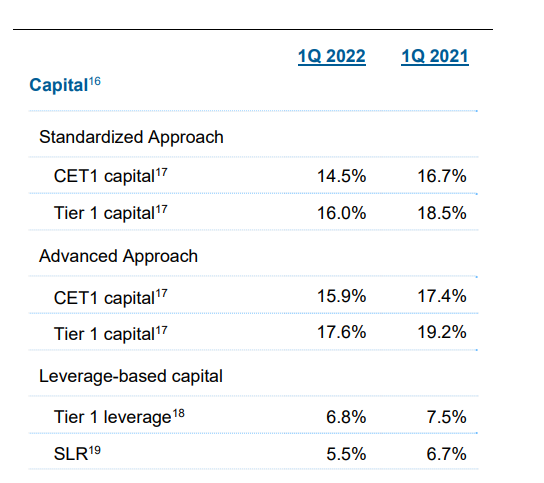
Table 1 shows that based on total assets CAGR of 5% from 2022 to 2032, COE of 8.13%, and capital Tier 1 ratio of 17% between 2022 to 2032, Morgan Stanley stock is worth $107 per share. It is worth noting that MS’s number of period end common shares of outstanding decreased from 1772 million to 1756 million. Also, I calculated a fair value of $132 per share for MS, based on a capital Tier 1 ratio of 10.5%. In other word, if Morgan Stanley wanted to only satisfy the minimum capital Tier 1 ratio requirements under Basel III, the stock would have worth $132 per share; however, the capital Tier 1 ratio of 10.5% would have increased the credit risk of the company.
Table 1 – Calculation of Morgan Stanley’s stock value based on FCFE method
Author’s calculations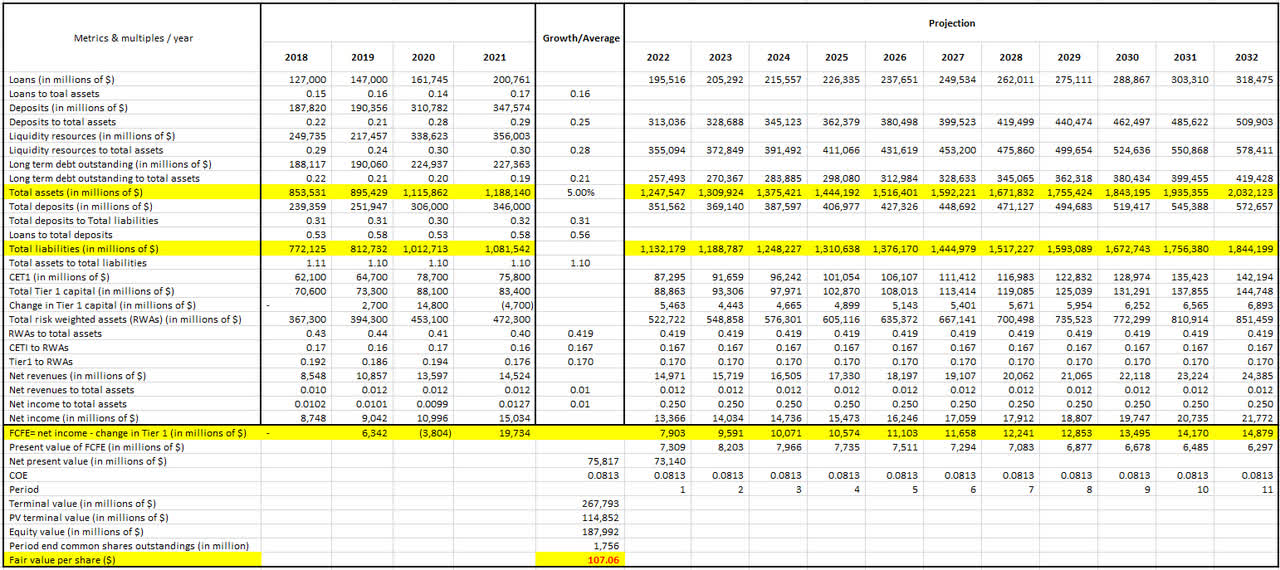
Second method: P/B
Through the lens of intrinsic valuation, generally, higher growth rates in earnings, higher pay-out ratios, lower cost of equity, and higher returns on equity lead to a higher price to book ratio. When it comes to banking and financial institutions, return on equity is a core fundamental ratio, and the relation between P/B and ROE is strong. Considering the forward Price/Book ratio, Morgan Stanley looks relatively attractive. The company’s forward P/B ratio is 1.5x, compared to Goldman Sachs 1.05x, Citigroup’s (C) 0.52x, and JP Morgan’s 1.38x. As of 31 March 2022, Morgan Stanley’s book value was $54.18 per share, 3% higher than its book value at the end of March 2021, which was $52.71 per share.
Morgan Stanley’s return on equity raised by 239 bps from 12.03% at the end of 2020 to 14.42% at the end of 2021. Briefly, MS’s average return on equity during the last five years is about 11.36%. Despite being conservative, I assume that the company will grow its equity at the average rate of 11%. The 11% growth rate represents a book value of $107.5 billion in 2022. Thus, the 2022 book value per share would be $60.33. Based on the forward price/book ratio of 1.5x, I estimate that MS stock is worth $91.
Risks
In the first quarter of 2021, Morgan Stanley’s risk-weighted assets ((RWAs)) were $439 billion. This number decreased to $436 billion in the fourth quarter of 2021. However, MS’s RWAs increased to $455 billion in the first quarter of 2022, up 4% YoY. Also, the company’s capital Tier 1 leverage ratio declined by 70 bps to 6.8% in the first quarter of 2022, from 7.5% in 1Q 2021. Morgan Stanley reported a 1Q 2022 CET1 ratio and Tier 1 ratio of 14.5% and 16%, respectively. Compared to 1Q 2021, MS’s 1Q 2022 CET1 ratio and Tier 1 ratio dropped by 250 bps and 220 bps, respectively (based on the standardized approach). Morgan Stanley’s provision for credit losses increased from $-98 million to $57 million. It means that the company’s allowance has increased; implying higher risks.
Summary
I am bullish on Morgan Stanley based on two different valuation methods: the free cash flow to equity method and price to book value. The former evaluates that the stock is worth $106 per share (based on my base case scenario), while the latter evaluates that MS is worth $91 per share. If the company allows its full-year 2022 capital Tier 1 ratio to drop to below 16%, the stock’s fair price will increase to more than $110; more risk, more price target. In the first quarter of 2022, MS’s capital Tier 1 ratio dropped by 250 bps to 16%, from 18.5% in 1Q 2021, which increases the probability of the $110 price target.
Be the first to comment