

Thinkhubstudio
Dear clients and fellow shareholders:
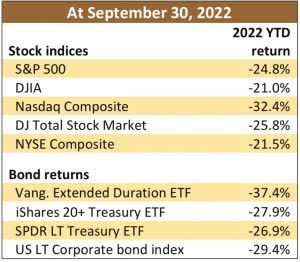
Following the worst January-September stock performance in 20 years, worldwide equity indices have clearly entered into bear market territory. The US benchmark S&P 500 is down 25 percent year-to-date, with the Nasdaq Composite down a whopping 32 percent. (Our stock portfolio has declined approximately 15 percent this year.)
The biggest shock to many investors in the third quarter wasn’t the miserable return of the stock market; it was the revelation that the supposed risk mitigating portion of their portfolio – the “safe bonds” – turned out to be not quite as safe as often advertised.
When the S&P 500 drops 25 percent, it is traditionally thought to be the time for those risk-reducing bonds to step up and do their job. The problem, however, is that as interest rates reset to even modestly reflect the declining purchasing power of the dollar, long-term bonds suddenly revealed themselves to be more risky than many stocks. This is a risk about which we have warned, as interest rates have been on a perpetual quantitative easing march to zero, and it took the reversal of a Covid-inspired quantitative binge to finally expose those risks.
This year’s long-term bond losses leave many investors wondering what happened to the supposedly safe component of their portfolios. The question they should have asked themselves, however, was “why would someone own a 30-year bond with a yield less than half the rate of inflation?” The answer is now clear: they shouldn’t have.
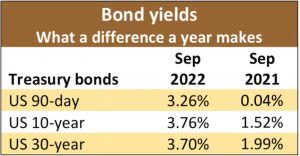
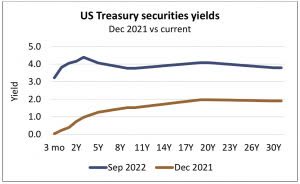
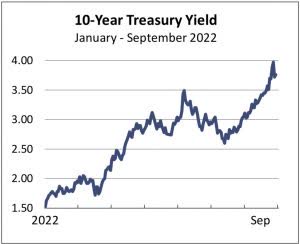
Bond yields have spiked most notably on the short maturity side of the yield curve. Since January, the rate on a three-month Treasury bill has increased from essentially zero to 3.26 percent – about the same rate as currently offered on a 30-year Treasury.
It’s not just retirees with bond funds who’ve been shocked by the market action this year. A younger generation of new retail investors has found out the hard way that stocks and cryptocurrencies do not move up in a straight line. According to a recent Ally survey, more than 1 in 5 customers under 40 have closed a brokerage account in The past 12 months, reminding us of J.P. Morgan’s observation that in a bear market, stocks return to their rightful owners.
Valuations
We read where one pundit claimed that the extreme bond market decline this year was a four standard deviation event. We don’t recall ever studying “four standard deviation events” in graduate school, so we looked it up for context. Statistically, this means that there was a 99.7 percent probability that the Bloomberg Aggregate Bond Index would not decline more than 5.3 percent. Instead, the index has dropped almost 20 percent in the past two years.
According to general statistical principles, a 4-sigma event is expected to occur roughly once for every 31,560 observations, or about 1 trading day in 126 years. The most recent observation of such a supposedly extreme rare event in financial markets occurred in March 2020, roughly 2.6 years ago, not 126 years.
What happened to the impressive sounding statistical prediction?
When consultants and academics use historical data to calculate risk or predict future asset price moves, they begin with the assumption that standard deviation and other statistical measures are predictive. This assumption is based on another assumption: that future price movements will closely resemble history and fit neatly into a bell-shaped curve. These assumptions are mathematically convenient, but both ignore the most important dynamic: assets have values – and values differ from prices, sometimes significantly. Many investors proceeded to make the same mistake with their bond purchases that they too often make with stock selection: ignoring the value of the asset.
The intrinsic value of a cash flow asset is simply the present value of all the future cash flows the investment is expected to produce for its owner. In case you aren’t familiar with it, the present value formula has an “i,” or interest rate, in the denominator. When the denominator gets larger, present value gets smaller. And when “i” is essentially zero, the only direction in which it can move is to get larger. As interest rates increased this year, long-term bond prices were bound to decline – the only questions were “when?” and “by how much?”
We know the answer to the first question, but not the second.
We have long expected interest rates to increase and, as a result, have already incorporated a number of factors into our investing framework designed to mitigate this risk. These have helped lessen our losses relative to the indices this year.
- We have, as always, only purchased businesses at prices we consider to be a significant discount from their intrinsic values. This value focus is not only our core investment selection criterion, it is the foundation of our business.
- We have avoided companies with margins so slim that an increase in their debt service cost would consume a significant portion of their earnings.
- We have avoided operating businesses that require constantly borrowed capital to fund their operations.
- We have been very careful about evaluating the maturity/refinance needs of companies’ existing debt maturities.
- We have favored businesses that have pricing power and can more easily pass along higher operating costs to their customers.
- In the bond market, we have avoided long and most intermediate term maturities.
We have always incorporated numbers 1 and 2 (well-priced securities and high margin businesses) into our evaluation process. Numbers 3 and 4 are outgrowths from the credit crunch and mortgage meltdown era of 2007-09. Numbers 5 and 6 are inflation-inspired areas of focus.
One portfolio sale …
We recently sold our shares in Softbank (OTCPK:SOBKY) at a loss, a little over a year after purchasing a stake in the company.
At the time of our purchase, Softbank traded at roughly half of its net asset value (NAV). This net asset figure had historically compounded at a healthy rate, which we expected would likely continue. Further, the stock price had traditionally traded at a much tighter spread to its net assets and any narrowing of this discount would provide incremental upside to our return.
We were wrong on both counts. Softbank’s NAV declined and the spread between its NAV and stock price grew wider.
Earlier this year Softbank cancelled the sale of its ARM chip business to Nvidia (NVDA) due to regulatory pressure. We had assigned $60 billion of value to the anticipated sale, representing a large portion of SoftBank’s then market capitalization. Softbank also found itself in the center of the tech sell-off, as it held many technology-related holdings in its two Vision Fund investment vehicles.
We expect there might be more pain to come for tech stocks, especially those in the venture capital/start-up stage, so we liquidated our Softbank position, realizing a loss of almost half of our original investment.
… and one portfolio addition
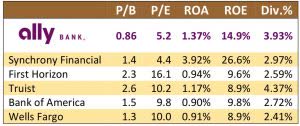
We recently purchased shares of Ally Financial (ALLY), the world’s largest digital-only bank. Ally’s legacy dates back more than 100 years when it was originally launched as GMAC, the in-house financing arm of General Motors (GM). The company was spun out from GM and rebranded as Ally more than a decade ago, but has retained an automotive focus on the lending side, where it holds the largest position in prime auto lending.
Since the spinoff, Ally has transformed from an auto loan company into a comprehensive, independent finance provider for borrowers and savers of all types. The company has completely restructured the liability side of its balance sheet and has created a deposit-gathering engine that is now more than 85 percent deposit-funded. (Compared to issuing traditional corporate debt, deposits are a significantly less expensive capital source for banks.)
Due to the lower overhead associated with the digital bank’s lack of brick-and-mortar locations, the bank produces one of the best efficiency ratios in the industry. This low-cost position, combined with a relatively high loan portfolio yield of approximately 6.75 percent, has helped the company earn net interest margins well above those of many leading banks. These high margins translate into high returns on equity, which the company targets at 16-18 percent over the medium term. (Actual ROE in 2021 was 24 percent. When the company came public in 2014, its ROE was a paltry four percent.)
Compared to a selected group of financial firms, the only institution with a better ROE is Synchrony Financial (SYF) – a stock we already own.
Ally’s management team is taking advantage of its attractive share price. Since the inception of its buyback program, the company has repurchased more than 35 percent of its outstanding shares. The company has also increased its dividend by more than 300 percent over that same timeframe. At current prices, the company is set to repurchase more than 15 percent of its outstanding shares in this year alone.
At Ally’s current tangible book value per share of $35, a normalized ROE of 16 percent generates earnings of roughly $5.60 per share, or less than six times the current trading price. The stock trades for less than its tangible book value – an incredible bargain for a bank that earns a mid-teen ROE and is rapidly growing its deposit base.
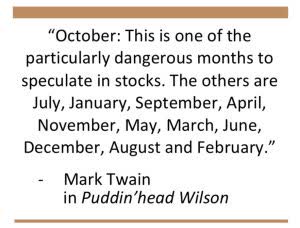
Every October financial writers and commentators dust off a Mark Twain quote from Pudd’nhead Wilson, usually accompanied with a reference to October 19, 1987 – the day the Dow Jones Industrial Average dropped 22.6 percent – still a single day record decline.
(For a fantastic contemporary look at Black Monday, we highly recommend watching the episode of Louis Rukeyser’s Wall Street Week that was broadcast on the Friday following October 19, 1987. Here is the link.)
What is seldom included in the recounting of the 1987 carnage is that, despite the record one-day drop, the Dow Jones Industrial Average actually increased over the entirety of the year.
A flaw in human nature is to mentally extrapolate the most recent past, especially when recent experience is extreme. Just as there is a temptation to focus only on a single day of carnage in 1987, it is similarly tempting to extrapolate the prior three miserable quarters into the indefinite future. Bear markets happen, and thus far this one has fallen within historical norms. It is likely to remain within them. As Sir John Templeton reminded us, the most dangerous words an investor can utter are “this time is different.”
| Moon Capital Management, LLC is a Registered Investment Adviser with the Securities & Exchange Commission. SEC registration does not constitute an endorsement of the firm by the SEC nor does it indicate that the adviser has attained a particular level of skill or ability. SEC file number: 801-49240. |
Original Posted on October 7, 2022
Editor’s Note: The summary bullets for this article were chosen by Seeking Alpha editors.
Be the first to comment