

tonefotografia
Risk-off sentiment is back, or so recent market activity suggests. Maybe risk-off never left. There are many ways to assess this state of affairs. Let’s check in on one that uses market data via ETF pairs for some real-time perspective, as of yesterday’s close (Wed., Sep. 14).
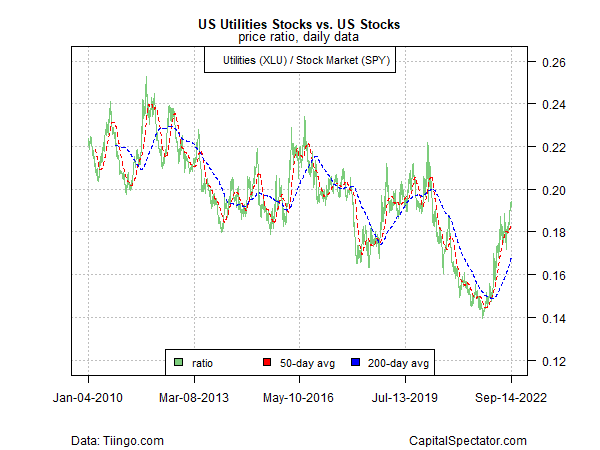
First up is the ratio for utilities stocks (XLU) to a broad measure of equities (SPY). By some accounts, the relative strength of utilities – a popular defensive slice of equities – provides a real-time profile of risk-off strength/weakness. On that basis, risk-off sentiment continues to run hot via the ongoing rise in the XLU:SPY ratio.
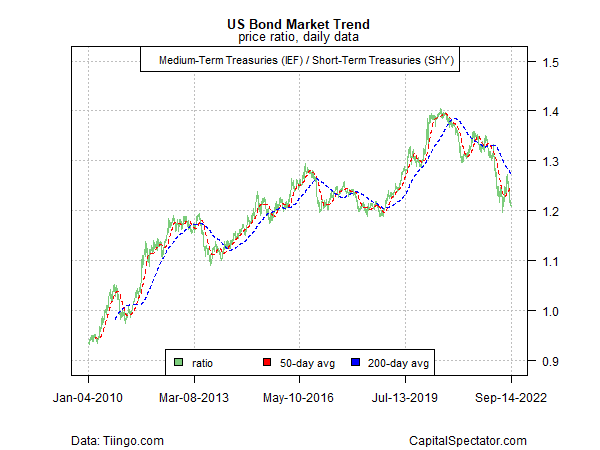
The US Treasuries market is sending a similar message, based on medium-term governments (IEF) relative to their short-term equivalents (SHY). For this profile, a falling ratio equates with risk-off sentiment for bonds, and by that yardstick, a new leg down appears to be unfolding lately.
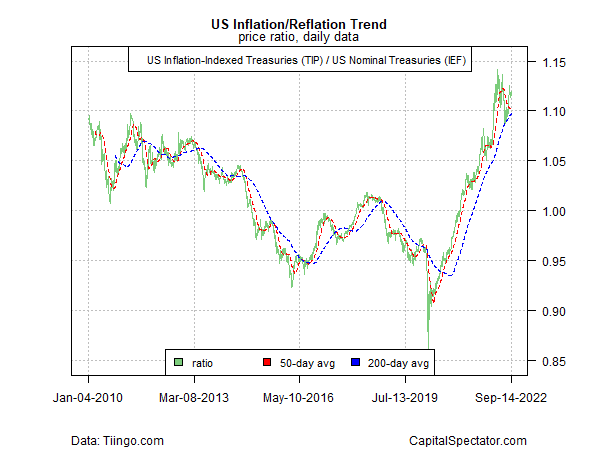
Inflation worries are a key part of the latest run of risk-off, and this trend has revived recently via the ratio of inflation-indexed Treasuries (TIP) vs. their nominal equivalent (IEF). When this ratio is rising, it suggests the reflation/inflation trade has strong momentum. But note that the clear upside trend has stalled, which may reflect rising deflation/recession risk. That leaves the question, is the latest pop a last hurrah before this ratio rolls over? Stay tuned.
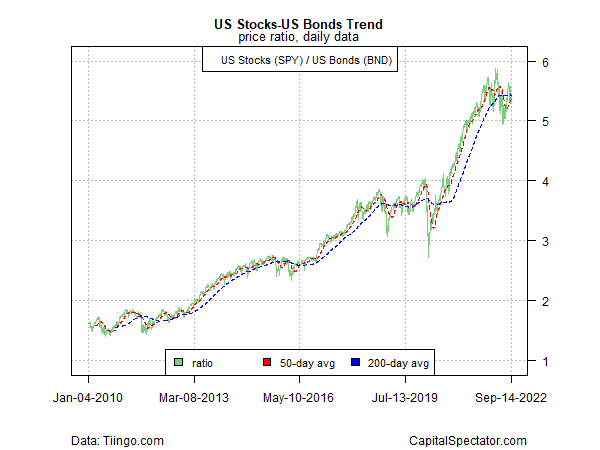
Risk-off usually aligns with weak, sliding equities and rising bond prices, but this time is different. For the first time in decades, interest rates are rising persistently, and that’s taking a toll on the bond market. As a result, the traditional safe haven is no safe haven. In turn, the dual headwinds for stocks and bonds are showing up in the stocks (SPY) vs. bonds (BND) ratio, which is struggling to find direction this year.
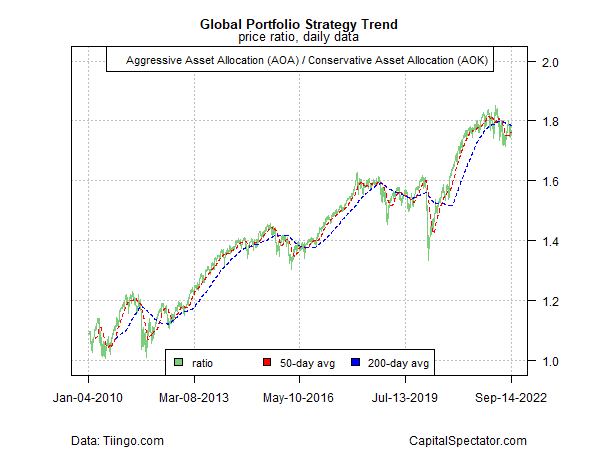
Finally, a modest bias for defensive asset allocation is visible in this pair of aggressive (AOA) vs. conservative (AOK) multi-asset-class portfolios. Note, however, that while there’s been a meandering downside bias lately – suggesting risk-off – the trend from this 30,000-foot perspective has yet to turn decisive and so a holding pattern/neutral bias still looks dominant.
Editor’s Note: The summary bullets for this article were chosen by Seeking Alpha editors.
Be the first to comment