

DNY59
After presiding over possibly the loosest period of monetary policy on record over the past few years, the Fed has shifted to the most extremely restrictive policy in decades. While interest rates remain far below trailing inflation, making it appear to many observers that the Fed must keep focused on fighting inflation, forward-looking indicators show that the inflation fight has already been won, and real interest rates have become dangerously high in the context of high debt levels. The key asset to watch over the coming weeks is corporate credit. While spreads have widened, they remain relatively compressed, and it will likely take a spike in spreads before the Fed capitulates and shifts its focus to financial stability in the same manner as the Bank of England.
Inflation-Linked Bond Yields Show Real Rates Are At 2008 Levels
Inflation-linked bond yields show the difference between bond yields and inflation expectations. They are therefore a much more accurate measure of real yields in the economy relative to measures that rely on backward looking CPI. After spending most of the past three years in deeply negative territory, the 5-year real bond yield hit a 14-year high of 2% last week, which is fully 150bps and one standard deviation higher than its 20-year average.
US 5-Year UST Yields Vs 5-Year US Breakevens (Bloomberg)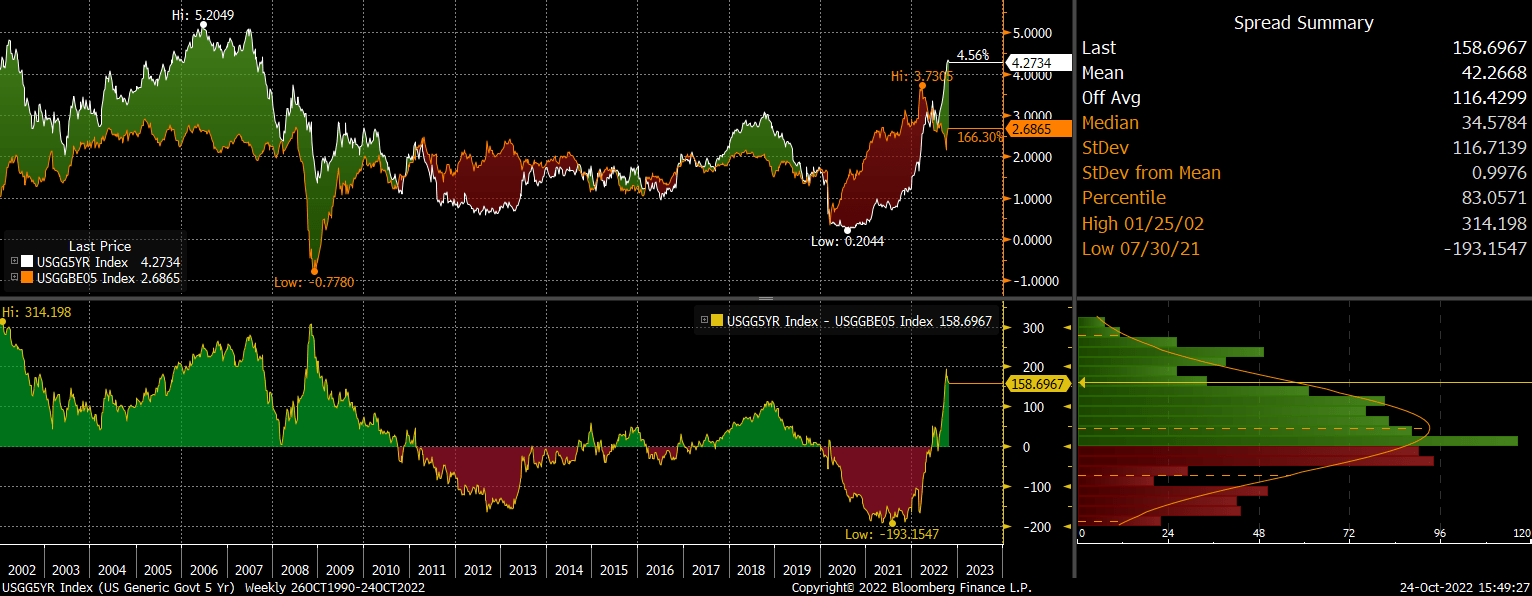
The same story is true of real borrowing costs across the entire yield curve, with real yields rising by 200-500bps depending on the tenor since the start of the year. Not only are real yields extremely high, they have seen the steepest rise on record.
Mortgage Rates Have Surged
As a result of the rise in Treasury yields, mortgage rates have surged. The Bankrate 30-year national average fixed mortgage rate is now at its highest level since 2000 as spreads over Treasuries have also risen amid rising default risk.
US 30-Year USTs And US 30-Year Mortage Rates (Bankrate.com, Bloomberg)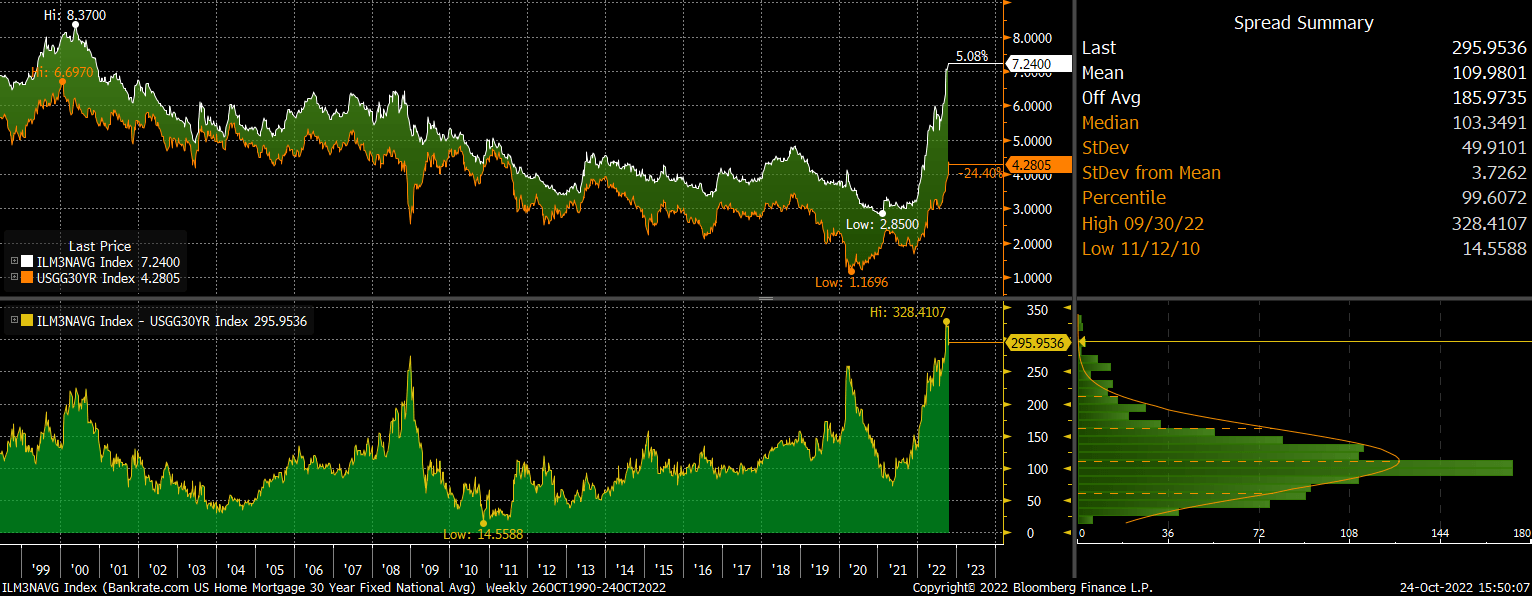
What is more concerning is that the NAR’s housing affordability, which is calculated based on mortgage rates, house prices, and average incomes, is now at its lowest level since 1990.
US Housing Affordability Index (Bankrate.com)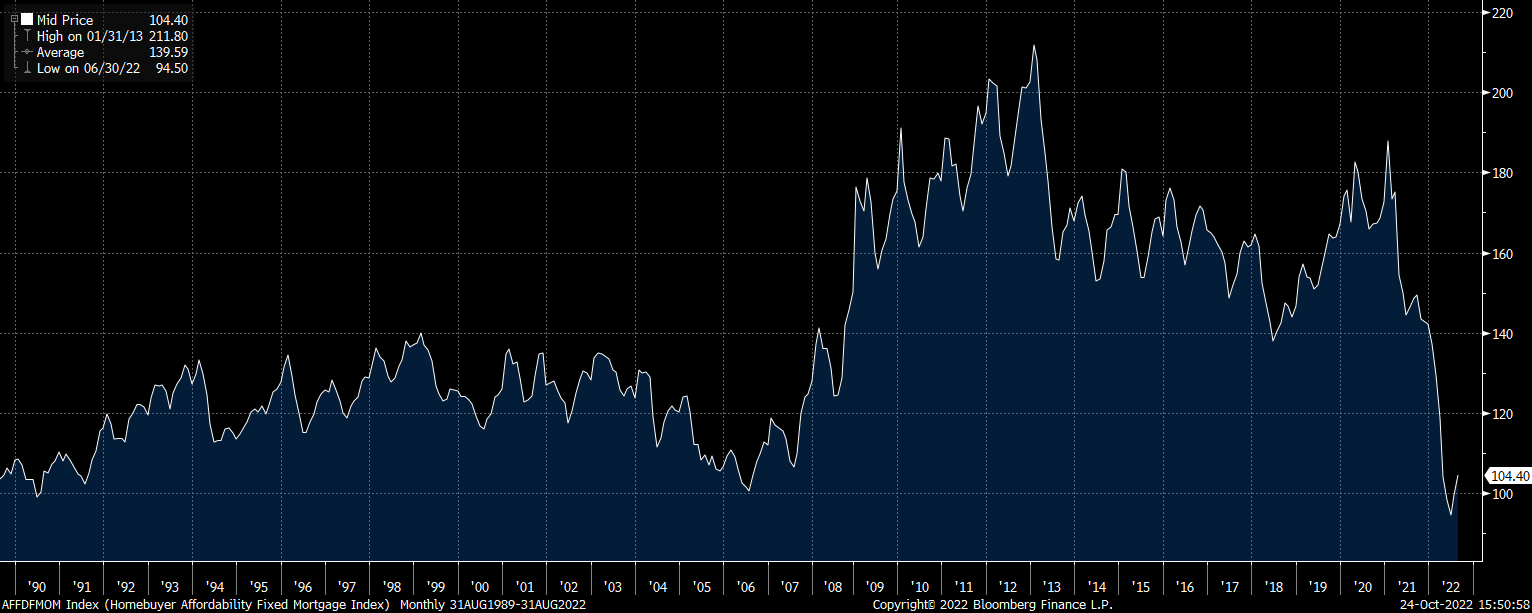
Money Supply Is Crashing
With the Fed now actively shrinking the monetary base with its sales of government bonds, the overall rate of money supply has crashed. After reaching a peak of 26.9 in February 2021 in response the Covid stimulus measures, the rate has fallen to just 4.1%, 3pp below its long-term average.
M2 Money Supply Growth (Bloomberg)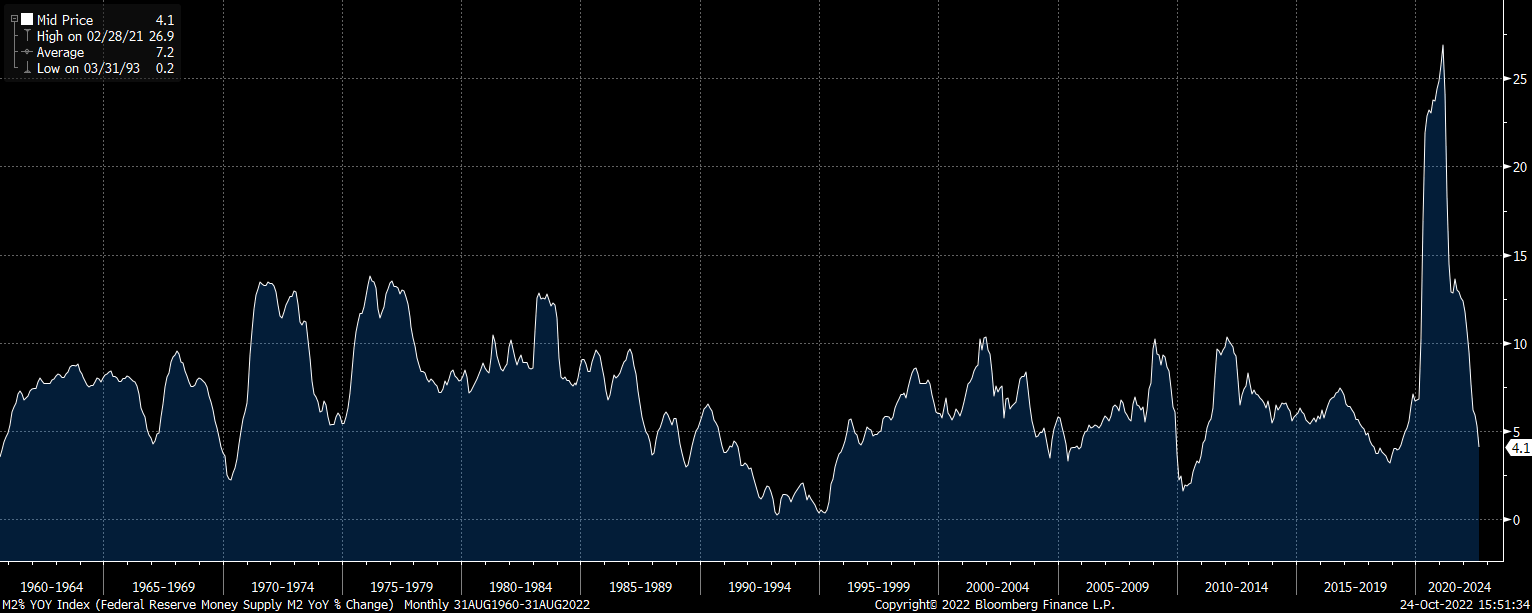
If we compare the rate of money supply growth with the rate at which banks lend to each other using 12-month LIBOR, we can see that money supply is not growing fast enough to service the interest on loans. This is the first time this spread has turned negative since 2005, and it is the most negative it has been since 2000.
Rising Rates Meets Record Debt
Despite the rise in money supply and inflation over the past two years, debt levels have actually risen by more than nominal GDP since the pandemic, with total U.S. domestic nonfinancial debt/GDP sitting near record highs of 268%. This extremely high debt burden means that the impact of rising real yields on the real economy are likely to be amplified when compared to previous hiking cycles. We can already see this in housing affordability data, but it has also begun to show up in Treasury interest payments.
US Nonfinancial Domestic Debt, % of GDP (Bloomberg)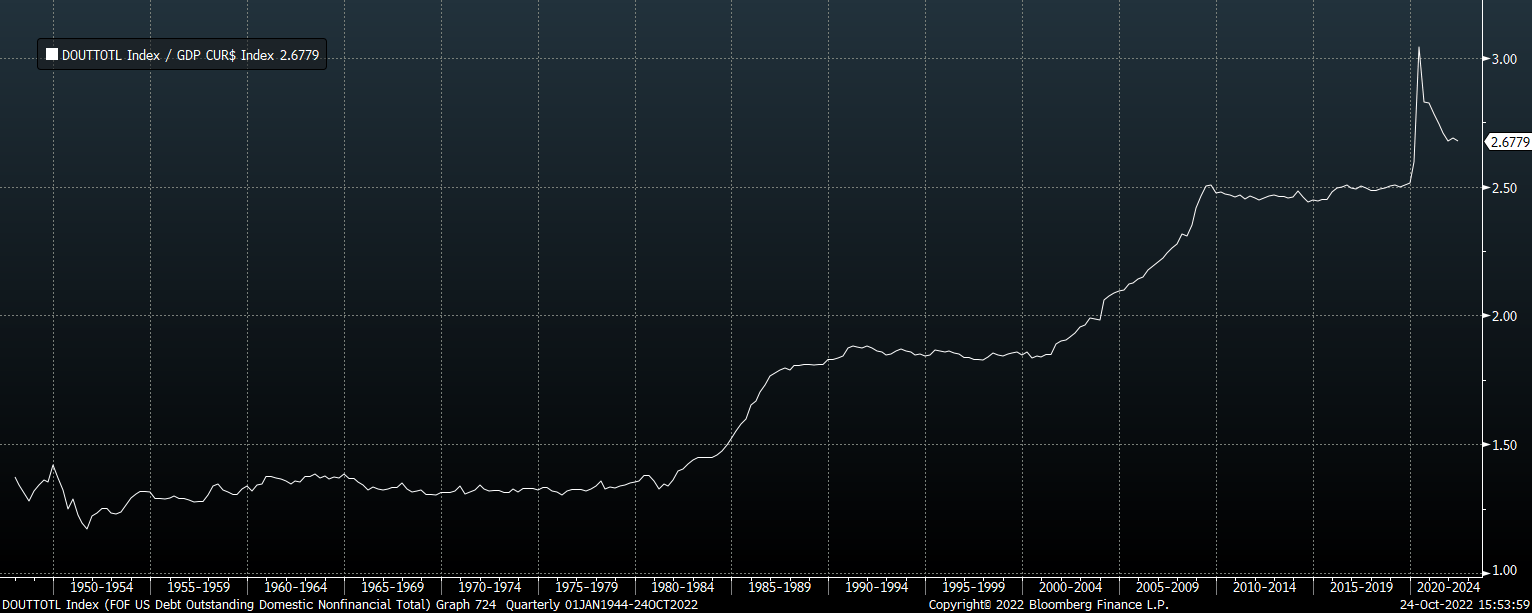
The rise in interest costs since the start of the year have so far had a muted impact on the real economy and I think the main reason for this is that the corporate sector has still managed to issue and roll over debt at relatively low yields. For all the talk of panic in the financial markets, IG and high yield credit spreads remain 210bps and 590bps below their Covid crash peaks respectively. The average yield on high yield corporate debt remains 270bps below the level seen at the height of the Covid crisis, and 1300bps below the 2008 financial crisis peak.
US IG and High Yield Credit Corporate Credit Spreads (Bloomberg)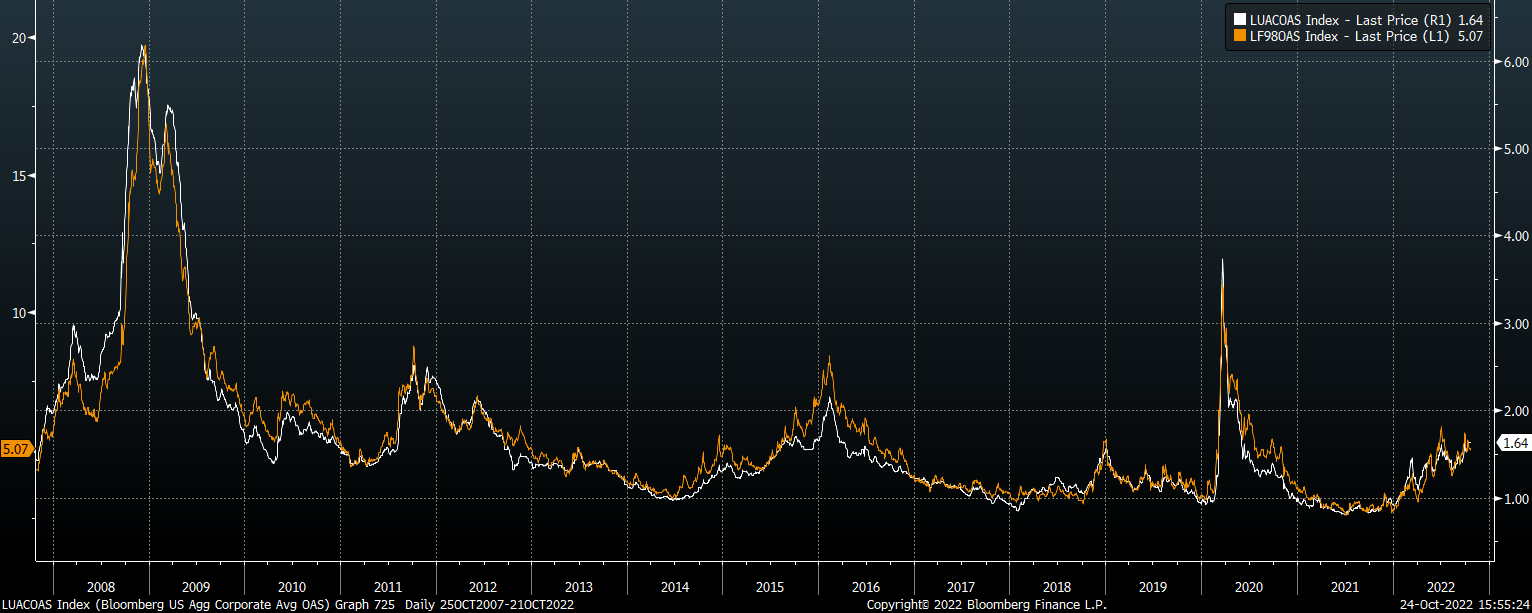
When we consider that corporate debt is now significantly higher than the levels that preceded the GFC, relative to both levels of equity and sales, the risk is that any slight decline in profitability leads to a surge in default rates. My guess is that credit markets begin to price in such a risk sooner rather than later, and we see a spike in borrowing costs at the corporate level that precipitates a financial crisis and deep recession. At this point, we are likely to see the Fed capitulate and cut rates even faster than it has raised them so far. In anticipation of such a scenario I believe investors should be positioned aggressively in U.S Treasury bonds.
Be the first to comment