

Thinkhubstudio
Mittleman Global Value Equity Fund – Class P Quarterly Report – Q3 2022
|
Fund details |
|
|
Index |
MSCI All Country World Index (ACWI) Net Total Return in AUD |
|
Fund inception date |
June 2017 |
|
Class P inception date |
October 2017 |
|
Performance2 – 30 September 2022 |
|||
|
MGVEF (Class P) |
Index (AUD) |
Excess return |
|
|
1 month |
(4.7%) |
(3.6%) |
(1.1%) |
|
3 months |
(6.5%) |
(0.3%) |
(6.2%) |
|
1 year |
(30.4%) |
(10.9%) |
(19.5%) |
|
2 years p.a. |
3.4% |
6.2% |
(2.8%) |
|
3 years p.a. |
(7.1%) |
5.4% |
(12.5%) |
|
Since inception3 |
(4.4%) |
8.6% |
(13.0%) |
Commentary1
The Mittleman Global Value Equity Fund (MGVEF) declined 6.5% in Q3 2022, vs. a decline of 0.3% in the MSCI ACW Net Total Return Index.
In Q3, the top three performing stocks, from a contribution standpoint, were Revlon (OTCPK:REVRQ, +3.8%), AMA Group (OTCPK:AMGRF, +2.9%) and Heritage-Crystal Clean (HCCI, +0.3%). The bottom three performing stocks, from a contribution standpoint, were Aimia (OTCPK:AIMFF, -7.9%), Greatview Aseptic Packaging (OTCPK:GRVWF, -4.9%) and Cineplex (OTCPK:CPXGF,-2.5%).
Top 10 holdings5
|
As at 30 September 2022 |
||
|
Stock |
Country |
Weight |
|
Aimia (OTCPK:AIMFF) |
Canada |
17.8% |
|
Greatview Aseptic Packaging (OTCPK:GRVWF) |
Hong Kong |
14.8% |
|
AMA Group (OTCPK:AMGRF) |
Australia |
14.1% |
|
Cineplex (OTCPK:CPXGF) |
Canada |
12.6% |
|
International Game Tech (IGT) |
US |
10.8% |
|
ABS-CBN Holdings Corp (OTC:ABSOF) |
Philippines |
3.5% |
|
Tremor International (TRMR) |
US |
3.4% |
|
Viatris (VTRS) |
US |
2.8% |
|
Heritage-Crystal Clean (HCCI) |
US |
2.8% |
|
Bayer (OTCPK:BAYZF) |
Germany |
2.8% |
Portfolio statistics6
|
As at 30 September 2022 |
||
|
MGVEF |
Index |
|
|
Weighted avg market cap |
US$2,243m |
US$18,832m |
|
Median market cap |
US$418m |
US$5,053m |
|
EV/EBITDA |
4.6x |
9.7x |
|
Price/FCF |
6.4x |
13.7x |
|
Free cash flow yield |
15.6% |
7.3% |
|
Number of securities |
13 |
2,897 |
Quarterly investment review7
The portfolio has rarely been more undervalued, or less risky in MIM’s view (nearly 40% of portfolio weighting in net cash balance sheets), or with better growth prospects, both organic and via M&A.
And yet the market cared little for those attributes in Q3, as can be seen by the drubbing of MIM’s largest position, Aimia Inc., down -25% in Canadian dollar terms (-30% in USD) during Q3 alone. And despite it having roughly C$6.00 in net cash per share (@ C$500M), the stock closed Q3 at C$3.45 per share, a 43% discount to its net cash.
Aimia, like most MGVEF holdings, is a small cap and non-US security, which has been a hindrance to stock price performance during this lengthy period of U.S. Dollar strength that began around the end of 2014. That was just as MIM’s portfolio’s performance began to stagnate, at least partially due to an ill-timed shift from 40% non-US exposure in the portfolio to 60% during 2014, and to 80% by 2021 where it remains today.
This has not been a top-down macro bet, it is just where MIM has found the best values. That said, the two new recent portfolio additions (Heritage Crystal Clean and Tremor International Ltd.) are U.S.-listed and evidence that cheaper valuations are drawing MIM’s attention increasingly back home.
For example, MIM established a new position in the U.S.-listed ADRs of Tremor International Ltd. (TRMR), a significant player in the ad tech space. Based in Tel Aviv, Israel, and with its primary listing in London (1 ADR = 2 London-listed shares), but with over 90% of its sales from the U.S., MIM considers Tremor a U.S. business in terms of geographic exposure.
The “tech-wreck” of 2022 saw many former high-flyers crash down from incomprehensible valuations to become priced now more reasonably. But, Tremor was already cheap as the year began and as it went down further, it just became too cheap to ignore. MIM paid $8.64 per ADR on average, about 3x its estimate for ’23 EBITDA of $175M (TRMR’s est. of $200M, minus stock based comp.), and 5x FCF of $100M (MIM’s estimate), for a leader in a high-growth industry (digital advertising), with a 35%+ EBITDA margin, and a net cash balance sheet, in a rapidly consolidating field.
MIM sees TRMR’s fair value as 8x EBITDA or 15x FCF, plus $110M in net cash, for an initial target of about $20 per ADR, which is 2.3x MIM’s cost basis. If historical growth continues that number will prove conservative. If a recession occurs and ad spending drops further, it may be optimistic for the next year or so. Most ad-supported businesses reported disappointing results recently, so the near-term risk is that the business takes a step backwards before resuming its longer-term growth trajectory.
But the fast-growing market for digital ads is unlikely to stall for long, and TRMR’s services address a very large market, where market share is actually shifting away from the “walled gardens” of the dominant players like Google and Facebook, and more towards the “open internet”, as well as connected TVs (“CTV”). Tremor’s services increasingly have somewhat of a SaaS (Software as a Service) profile, but the stock lacks anything close to a SaaS valuation premium.
The largest player in Tremor’s industry, The Trade Desk (TTD, $43.72), is one of the only companies getting a premium valuation (10x sales, 26x EBITDA) in that field, and it may well deserve it given its first mover advantage and outstanding growth record in a business where scale begets scale. But MIM doesn’t see this industry as a “winner takes all” opportunity, nor suggests a premium valuation for TRMR, as just getting to a somewhat normal valuation should be a satisfying outcome, plus whatever growth the business likely generates over time.
And what exactly is this business? Ad tech companies like Tremor offer “programmatic” ad buying/selling, which is fully automated using AI and algorithms, providing better targeting, better returns on advertising money spent, and all done in milliseconds. Tremor operates both on the demand side for advertisers buying ads (DSP, Demand Side Platform) via their Tremor Video and recently acquired Amobee DSP, and also on the supply side via their Unruly SSP (Supply Side Platform) which sells ad space for publishers like News Corp. (which sold Unruly to TRMR).
Providing “end-to-end” service is a differentiator for TRMR which competes with DSP-only firms like Trade Desk and SSP-only firms like PubMatic. Besides Tremor, there are only three other companies offering two-sided or end-to-end platforms and those are Perion, Outbrain, and Taboola, but the latter two are performance based (paid for clicks). Ad tech firms like Tremor and Perion take a percentage fee (their “take rate”) of the ad spending on their networks and report revenue on a net basis as “Contribution Ex-TAC” where TAC means Traffic Acquisition Cost.
Technology-based businesses like Tremor have unique risks, particularly with regard to intellectual property and potential technological obsolescence. However, at 3x EBITDA, with a net cash balance sheet, 35% EBITDA margin, and having established meaningful scale and scope in a huge, fast-growing addressable market, MIM thinks this is a wise risk/reward ratio.
Tremor is just one of many new opportunities the recent market sell-off has presented, and MIM is constantly evaluating those as potential new additions to the portfolio. As the portfolio’s characteristics imply, it’s a fairly high bar for entry in terms of business quality (most of MIM’s holdings in top 3 from a market share perspective) and valuation.
Of the 13 companies MIM owns currently, four have been severely impacted by unprecedented global supply chain pressures (AMA Group – lack of auto parts for their collision repair shops, lack of workers, higher costs; Greatview Aseptic – commodity inputs and freight/shipping costs; NFI Group – key modules delayed for their zero emission buses; and Revlon – made to pay cash up front for raw materials).
Those pressures appear to be lifting recently, and while they could resume to the upside, the trend now is encouragingly to the downside. This link is a chart of the Global Supply Chain Pressure Index (GSCPI) as calculated by the Federal Reserve Bank of New York.
The recently extreme adverse volatility that we’ve endured is reminiscent of 2008 and 2002, both painful years of setbacks that nonetheless set us up for multi-year runs of great outperformance beginning almost immediately thereafter. Chris (Mittleman) won’t feign prescience nor waste time pontificating about where interest rates, inflation, or market prices in general are going, nor does he believe one has to adhere to a macro framework in that regard, in order to invest successfully, despite this year being the year of the macro trader in terms of performance leadership.
He does believe that highly cash-generative businesses, real franchises with enduring economic advantages, owned cheaply enough should eventually provide satisfying returns against almost any macroeconomic backdrop, over the long-term.
Investors following a long-only, concentrated, long-term approach to investing, as MIM does, will experience periods of uncomfortable drawdowns. The roughly 50% decline it hase endured since 31 May 2021 is something that we have experienced and surmounted before. Even Berkshire Hathaway (Warren Buffett), arguably the greatest investment vehicle of all time, endured such (see this excerpt below from Berkshire’s 2017 annual letter):
“Berkshire, itself, provides some vivid examples of how price randomness in the short term can obscure long-term growth in value. For the last 53 years, the company has built value by reinvesting its earnings and letting compound interest work its magic. Year by year, we have moved forward. Yet Berkshire shares have suffered four truly major dips Here are the gory details:
Period High Low
Percentage Decrease
March 1973-January 1975 93 38
(59.1%)
10/2/87-10/27/87 4,250 2,675
(37.1%)
6/19/98-3/10/2000 80,900 41,300
(48.9%)
9/19/08-3/5/09 147,000 72,400
(50.7%)
Past performance is no guarantee of future results. And this time may well be very different. Maybe we are facing a period more like 1966 to 1982, when the Dow Jones couldn’t get above 1,000 for 17 years, as inflation and interest rates soared into the upper teens.
But opportunistic value investors like Warren Buffett, Tweedy Browne, and many others who stuck to their discipline, made life-changing fortunes during those years of brutal performance for the popular market averages, particularly in real (inflation adjusted) terms. Satisfying progress can be made against almost any macro-economic backdrop and MIM remains highly confident that its current holdings will prove out again, despite the bleak outlook implied by current market prices.
|
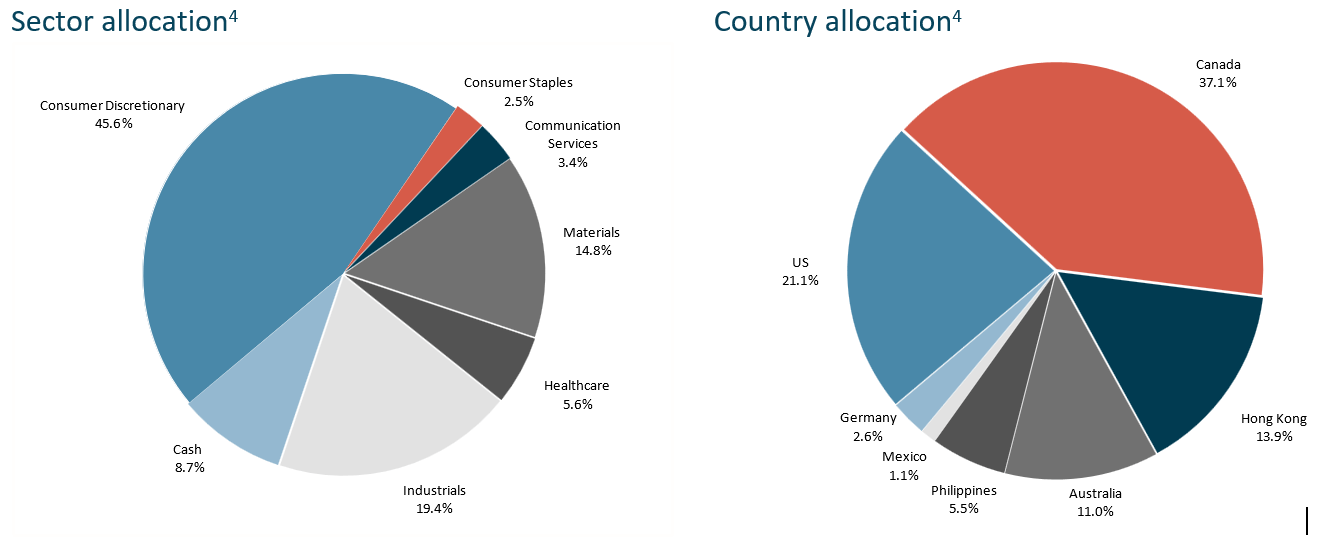
Investment strategyMittleman Investment Management, LLC (MIM) is an SEC-registered investment advisor based in New York that pursues superior returns through long-term investments in what it deems to be severely undervalued securities, while maintaining its focus on limiting risk. It invests in businesses that it believes are proven franchises with durable economic advantages, evidenced by a well-established track record of substantial free cash flow generation over complete business cycles, and only when the very low valuation at which the investment is made provides a significant margin of safety. MIM’s value-oriented strategy is to invest in a concentrated portfolio (usually between 10 to 20 securities) of primarily common stocks, unrestricted as to market capitalisation, and in both developed and emerging markets. Important notesThis document has been prepared and issued by Mittleman Investment Management, LLC. (MIM) (AFSL 528365) and is intended for the general information of ‘wholesale clients’ (as defined in the Corporations Act 2001). MIM not licensed to provide financial services to retail clients in Australia. MIM is regulated by the Securities and Exchange Commission of the United States of America under US laws, which differ from Australian laws. Equity Trustees Limited (Equity Trustees) (ABN 46 004 031 298, AFSL 240975) is a subsidiary of EQT Holdings Limited (ABN 22607 797 615), a publicly listed company on the Australian Securities Exchange (ASX:EQT). Equity Trustees is the Responsible Entity of the Mittleman Global Value Equity Fund (ARSN 161 911 306). This document is neither an offer to sell or a solicitation of any offer to acquire interests in any investment. The information contained in this document is of a general nature only. Accordingly, reliance should not be placed on this information as the basis for making an investment, financial or other decision. In preparing this document, MIM has not taken into account the investment objectives, financial situation and needs of any particular person. Before making any investment decision, you should consider whether the investment is appropriate in light of those matters. Whilst every effort is taken to ensure the information in this document is accurate, MIM and Equity Trustees provides no warranty as to the accuracy, reliability and completeness of the information in this document and you rely on this information at your own risk. To the extent permitted by law, MIM and Equity Trustees disclaims all liability to any person relying on the information contained in this document in respect of any loss or damage (including consequential loss or damage) however caused, which may be suffered or arise directly or indirectly in respect of such information. Past performance is not a reliable indicator of future performance. The return of capital or any particular rate of return is not guaranteed. Mittleman Global Value Equity Fund’s Target Market Determination available here. A Target Market Determination is a document which is required to be made available from 5 October 2021. It describes who this financial product is likely to be appropriate for (i.e. the target market), and any conditions around how the product can be distributed to investors. It also describes the events or circumstances where the Target Market Determination for this financial product may need to be reviewed. All information provided herein is for informational purposes only and should not be deemed as a recommendation to buy or sell securities. This material may not be redistributed without the express written consent of MIM and does not constitute an offer to sell or the solicitation of an offer to purchase any security or investment product. All investments involve risk including the loss of principal. Specific companies or securities shown in this presentation are meant to demonstrate MIM’s investment style and the types of securities in which we invest and are not selected based on past performance. The analyses and conclusions of MIM contained in this presentation include certain statements, assumptions, estimates and projections that reflect various assumptions by MIM concerning anticipated results that are inherently subject to significant economic, competitive, and other uncertainties and contingencies and have been included solely for illustrative purposes. No representations, expressed or implied, are made as to the accuracy or completeness of such statements, assumptions, estimates or projections or with respect to any other materials herein. Past performance is not indicative of future results. Portfolio holdings, country allocation and sector allocation are based on MGVEF as of 30 September 2022 and may differ for the MIM Composite and are subject to change and should not be considered as investment recommendations to trade individual securities. Country allocation does not include cash. Mittleman Investment Management Composite (“MIM Composite”) performance as stated herein does not refer to the performance of Mittleman Global Value Equity Fund but instead refers to the actual current and historical performance of the MIM Composite which represents the current and historical composite performance of the separately managed accounts utilising the strategy followed by Mittleman Investment Management, LLC since its inception in 2005. Performance results are presented in USD, are preliminary, net of fees and include the reinvestment of all income. Mittleman Global Value Equity Fund returns will vary from those presented due to differences in the timing of contributions and withdrawals, fund expenses, and class start dates. For the MIM Composite, MIM claims compliance with the Global Investment Performance Standards (GIPS®). MIM is a U.S. SEC-registered investment adviser. The MIM Composite was created in April 2008 and incepted on January 1, 2003. The MIM Composite includes all fully discretionary separately managed accounts which follow the firm’s investment strategy and for which performance is measured using the U.S. Dollar as the currency, including those accounts no longer with the firm. MIM’s value-oriented strategy is to invest in a concentrated portfolio (usually holding between 10 to 20 securities) of primarily common stocks, unrestricted as to market capitalisation, of both domestic and international companies. Performance presented prior to January 2006 occurred while the Portfolio Manager was affiliated with a prior firm and the Portfolio Manager was the only individual responsible for selecting the securities to buy and sell. Past performance is not indicative of future results. Returns reflect the reinvestment of dividends. For more information or for a copy of the firm’s fully compliant presentation and the firm’s list of composite descriptions, please contact MIM on +1 (212) 217-2340. The use of the MSCI ACWI herein has not been selected to represent an appropriate benchmark with which to compare against an investor’s performance in the Mittleman Global Value Equity Fund (MGVEF), but rather it has been provided to allow for comparison of such performance to that of a certain well-known and widely recognised broad-market index. The MSCI ACWI is an unmanaged index compiled by MSCI. The index is weighted by market capitalisation and its returns include the reinvestment of dividends. The index does not account for transaction costs or other expenses which an investor might incur in attempting to obtain such returns. The index was taken from published sources and deemed reliable. You cannot invest directly in an index. Investments made by Mittleman Investment Management, LLC (“MIM”) for its clients’ portfolios including MGVEF differ significantly in comparison to this (and any other) index in terms of security holdings, industry weightings, and asset allocations. Accordingly, investment results and volatility will differ from those of the benchmark. The S&P 500 TR (“Total Return”) Index and the Russell 2000 TR (“Total Return”) Index are presented herein for comparison purposes only. These indices have been shown against the Composite’s performance to allow for comparison of such performance to that of certain well-known and widely recognized broad-market indices. The S&P 500 Total Return Index is an unmanaged index compiled by Standard and Poor’s and the Russell 2000 Total Return Index is an unmanaged index compiled by Russell Investments. Both indices are weighted by market capitalization and their returns include the reinvestment of dividends. Both indices are weighted by market capitalization and their returns include the reinvestment of dividends. The indices do not account for transaction costs or other expenses which an investor might incur in attempting to obtain such returns. The S&P and Russell indices are taken from published sources and deemed reliable. You cannot invest directly in such indices. Investments made by Mittleman Investment Management, LLC for its clients differ significantly in comparison to these (and any other) indices in terms of security holdings, industry weightings, and asset allocations. Accordingly, investment results and volatility will differ from those of the benchmarks. For more information or for a copy of the firm’s fully compliant presentation and the firm’s list of composite descriptions, please contact us at (212) 217-2340. Mittleman Investment Management, LLC (“MIM”) is also known as Mittleman Brothers and those terms are used interchangeably in this document. All information provided herein is for informational purposes only and should not be deemed as a recommendation to buy or sell securities. Estimates reflect various assumptions by MIM concerning anticipated results that are inherently subject to significant economic, competitive, and other uncertainties and contingencies and have been included solely for illustrative purposes. This material may not be redistributed without the express written consent of MIM and does not constitute an offer to sell or the solicitation of an offer to purchase any security or investment product. All investments involve risk including the loss of principal. Specific companies or securities shown in this presentation are meant to demonstrate MIM’s investment style and the types of securities in which we invest and are not selected based on past performance. |
Editor’s Note: The summary bullets for this article were chosen by Seeking Alpha editors.
Be the first to comment