

Kirill Smyslov
Annualized Performance (%) as of 9/30/22
| QTD | YTD | 1-Year | 3-Year | 5-Year | 10-Year | Since Inception (12/30/99) | |
| Opportunity Equity (gross of fees) | -4.38 | -36.84 | -41.31 | 0.42 | 2.13 | 11.41 | 6.73 |
| Opportunity Equity (net of fees) | -4.62 | -37.34 | -41.92 | -0.58 | 1.12 | 10.31 | 5.67 |
| S&P 500 Index | -4.88 | -23.87 | -15.47 | 8.16 | 9.24 | 11.70 | 6.01 |
To be like the rock that the waves keep crashing over. It stands unmoved and the raging of the sea falls still around it.
So remember this principle when something threatens to cause you pain: the thing itself was no misfortune at all; to endure it and prevail is great good fortune.
Marcus Aurelius, “Meditations”
The third quarter capped off one of our most disappointing years yet. We take our duty to deliver clients’ returns seriously and we despise falling short. As long-term, fundamental value investors, we know we will face challenging periods sometimes. We came into the year expecting a routine market pullback based on what historically happened when the Fed began tightening cycles. Instead, we entered a much more prolonged and severe bear market.
We are disappointed, but not surprised. Investment managers must face the prospect of underperforming at some point. This reality nearly drove me out of the business. My experience managing money in the financial crisis drove home the point that no matter how brilliant and hard-working you are, you will eventually underperform in this business.
I spent years contemplating other careers where “failure” wasn’t preordained. I finally realized that 1) I love investing the most and 2) I strongly believe over the long term our sound process will deliver strong results.
Not every month, quarter or even year. But over multi-year periods, I believe we can offer the world a proven investment style that is increasingly rare (thus, even more likely to be of value in my opinion). I find purpose in delivering for clients through long-term, counter-cyclical capital allocation, which is an endangered market stabilizing force. I also stopped equating short term periods of underperformance with failure.
I’ve found strength and comfort in certain spiritual teachings, like stoicism. Marcus Aurelius, quoted above, was one of the most admired Roman Emperors and an original Stoic. He presided over wars, a plague and possessed a weak constitution. His travails taught him the wisdom necessary to prevail. Investors can benefit from his perspective.
I started the new quarter by attending Santa Fe Institute’s Annual Risk meeting where Jonathan Haidt, NYU Stern social psychologist and renown author of numerous books, spoke. He discussed teen mental health problems (and the US’s “institutional stupidity”). Jonathan described humans’ two brain systems: “discover” and “defend” modes, which cannot operate simultaneously. The former allows a person to scan for opportunities and think for oneself. The latter prioritizes scanning for dangers, looking for safety and clinging to team. In it, scarcity mindset prevails.
We hope children mostly operate in discover mode. Unfortunately, Haidt describes a younger generation conditioned to defend. A giant problem for society, which he blames mostly on social media.
This dichotomy perfectly explains investor behavior as well. Why do we feel more comfortable buying near market highs than during selloffs? We know to “buy low, sell high” but doing so is agonizing. Defend mode focuses us on dangers and not straying from the stock-selling crowd. Institutional structures penalize wrong unconventional calls and short-term losses, reinforcing this tendency.
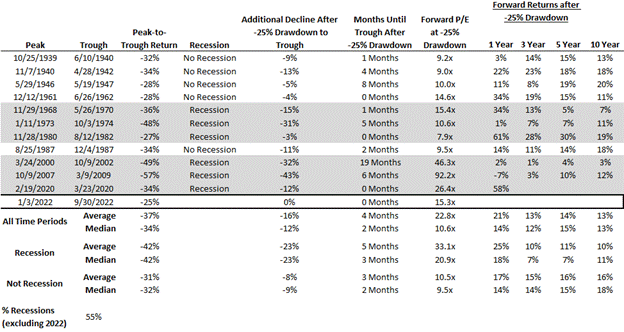
Investors must endure bear markets, recessions, and drawdowns. Painful as they feel, these periods often represent the best buying opportunities. Since 1939, the S&P 500 experienced 12 drawdowns of 25% or more (where we ended the quarter). See Appendix 1 for complete data.
From this starting point, there’s NO historical precedent for losing money over 3, 5 or 10 years! The market notched average annualized gains of 13-14%, which is roughly 20% higher than the period’s 11% long-term average. Over a 1-year period, the market declined only once, during the financial crisis. Even during that extreme period, the 1-year loss was only 7%, less than a garden variety correction. On average, you made over 20% in the year following a 25% drawdown, more than recouping whatever losses you endured in the few months to the ultimate lows.
Likewise, when the Opportunity Equity strategy has been down more than 25% in a year, the average forward 1-year return has been 48% net of fees. The evidence strongly supports buying stocks here if your time horizon measures more than several months. Unfortunately, the data suggests they don’t for most institutional investors.
The best returns mostly come from doing something different from others. We believe the ability to extend your time horizon will generate even stronger returns than normal now.
One common and costly investment error is doing today what you wish you’d done yesterday. Hello, Federal Reserve! Another example is getting defensive now, after significant losses. Most often, this compounds your errors rather than fixes them. We don’t let market prices tell us when to sell. Low prices and strong fundamentals eventually lead to excellent returns. Fundamental problems lead to risk. We focus on the fundamentals. This contrasts starkly with broad market behavior.
The current myopic market focus centers on how much downside we face to the ultimate lows. Fears stem from recession risk and its impact on earnings. Inflation, China, Russia, financial crisis, Central Bank errors, political mayhem, even nuclear attacks occupy public consciousness. It’s no wonder the AAII Bulls-Bears Index just hit the lowest level in nearly 40 years – even lower than the financial crisis! None of these risks are new for American business, which has managed to thrive through both geopolitical and economic challenges.
Sir John Templeton advocated investing at the point of “maximum pessimism”. Bill Miller says, “if it’s in the papers, it in the price.” Markets’ currently price in extreme negativity. That doesn’t mean it can’t get worse, but it does mean further losses require unexpected disappointments. The lower markets go, the more difficult that becomes.
In many cases, we believe the security prices reflect dire outcomes already.
We own OneMain Financial (OMF, $31.33), a subprime consumer credit company, which exemplifies the situation. It trades at 4x earnings with a 12% dividend yield, which we believe is secure through any recession. We estimate that in a severe 2008-style recession (which we don’t expect), it could earn $4 per share, 45% less than its 2022 estimated earnings.
The stock is down 48% from its highs, close to a worst-case recession earnings hit. Not a coincidence in my view. It trades for 7x estimated worst-case trough earnings. It’s currently buying back its stock at highly accretive values, and we expect it to grow earnings per share in the high single digits through the cycle. You’re paid handsomely to be patient and take a long-term view.
People think you are crazy to mention a subprime consumer credit company heading into a recession. The market obsesses over marginal change. Gone are the days when incremental news no longer moves a stock because it was already discounted. This creates excess volatility. Most managers have adapted by minimizing or eliminating contrarian buy calls. This scarcity exacerbates volatility but can also increase opportunity. Therefore, we believe volatility is the price you pay for outperformance.
We believe OMF will recover from any recession and trade at new highs within 3 years. If it just hits its previous highs, it will compound at 31% per year total return. Even if it goes nowhere, you make 12% per year on the dividend alone. Given it’s already pricing in a dire recession, fundamentally the stock should find a floor soon. Given all the algorithms that trade on the next headline, I wouldn’t wager much on that. If our analysis is correct, lower near-term prices just amplify the ensuing recovery.
Though it’s painful, we trade short-term pain for long-term gain. To be like a rock with waves crashing over, waiting for the seas to calm around us. Except we don’t just wait. We use lower prices to improve the portfolio’s positioning and embedded potential upside.
OneMain is not unique in our portfolio. We own many names trading on fear, rather than fundamentals. In early October, UBS downgraded the auto companies. It’s street low General Motors (GM) 2023 estimates call for EPS to decline 54% year-over-year. The stock’s peak-to-trough decline so far is… 55%. See a pattern? At $32.29, GM trades at 9x UBS’s recessionary forecast. UBS is optimistic on GM’s electric vehicle and autonomous capabilities. It expects it will only take a few years for a full earnings recovery. No one seems to care, as panic is the enemy of patience.
We’ve also been bullish on travel stocks. We believed pandemic-driven demand normalization would provide powerful tailwinds that weren’t priced in. We’ve been mostly right on the fundamentals, which have continued to surpass expectations. Yet the stocks trade at or near 2-year lows. Shocking considering 2 years ago, these companies had little to no revenue!
Fears about how consumer discretionary will fare in a recession have pressured the stocks. We believe demand will continue to hold up better than expected as consumers prioritize the experiences they lost during the pandemic. We believe time will prove the companies wildly mispriced.
Expedia (EXPE, $92.69) has a high teens free cash flow yield, trades at 14x 2022 and 10x 2023 earnings. We believe it can sustain earnings per share growth in the mid-teens. It massively improved its business and margins during the pandemic, has repaired its balance sheet and is chaired by an amazing capital allocator, Barry Diller. We think it’s worth more than double the current price.
Delta Air Lines (DAL $29.42) is a high-quality airline (yes, there really is such a thing!). It didn’t issue any equity in the pandemic. It focuses on delivering a superb customer experience and has brand loyalty (including a stable revenue stream from partner American Express (AXP), growing at 20%/ year). Maybe the best evidence: it’s managed to outperform the S&P 500 over the past decade despite a horrible pandemic ending point (+13.2% vs. 11.7%1 ). It trades for 4x 2024 earnings! If it eventually trades at Southwest’s historical valuation, it implies this stock should double as well.
A recession could even end up being helpful for companies like OneMain and Delta who can finally demonstrate their business resiliency.
We spend a significant amount of effort on risk management, which we define as permanent impairments to capital, not short-term volatility. We analyze fundamental business performance to assess factors that may lead to losses. When we have confidence in a business’s resiliency, we prefer cyclical risk to secular valuation risk, which we believe many companies still face.
Falling interest rates provided a powerful tailwind to valuations in the past few decades. Low volatility bond proxies and long duration growth stocks benefited most. This year, growth valuations have corrected dramatically as rates have risen. Yet the market still values growth at higher levels than most of the past 50 years, according to Empirical Research. Growth stocks have led the market down, and we expect them to initially lead in any recovery. The longer-term prospects are questionable.
Warren Buffett likens the power of interest rates to “the force of gravity” for asset prices. Amazingly, some old school cyclicals, like banks and auto companies have escaped the valuation benefit of this force. A period of secularly rising interest rates, or even merely stable ones, would create an entirely different environment. Valuations would face headwinds, rather than tailwinds. Those areas that didn’t benefit should be the most protected. We believe the payoff for value should grow.
According to JP Morgan, fundamental investors account for only 10% of trading flows. I recently spoke at a conference with a fellow value investor from Cramer Rosenthal McGlynn who showed Morningstar data indicating only 5-10% of managed assets are value strategies. The holding periods for most institutional money managers sit well below one year.
We are in an extreme minority: long-term, fundamental value investors willing to tolerate short-term volatility in the pursuit of long-term returns. I feel like a practitioner of a dying art, which is equal parts terrifying and invigorating.
Terrifying because we are not immune to the forces killing the art: deep antipathy to volatility/loss aversion, a system that mis equate volatility with risk and a decade of headwinds for value.
Invigorating because those very same forces (plus some) give us extreme confidence in our long-term prospects. The very volatility others avoid creates opportunities we strive to capitalize on. Human behavior doesn’t change so this edge is unlikely to dissipate. Our fundamental analysis and stock selection capabilities give us confidence we know how to identify mispriced securities. While securities can always get cheaper, we believe our research is sound and will deliver long-term results.
Overall, I’ve never been more optimistic about our long-term prospects. Stocks discount fear and time horizons have collapsed. A long-term focus should pay off. We have confidence our companies are well positioned to handle whatever headwinds we face. It will take time for fundamentals to play out, but the passage of time is guaranteed. Our valuation discipline should be a key asset in the coming years. In addition, our flexible approach broadens our opportunity set and helps us diversify for an uncertain future.
We thank our investors for their patience through this painful period. We have great confidence in our potential to deliver excellent returns over the long term. We will work our hardest to do so.
Samantha McLemore, CFA
Appendix 1: S&P 500 Drawdowns 25% or More
Footnotes1Sep 28, 2012 – Sep 30, 2022 |
|
Share prices/multiples quoted as of market close October 10, 2022. Source: Bloomberg. AAII Bulls-Bears Index The indices reflect the sentiment of individual investors towards the stock market over the next 6 months. The question asked is “I feel that the direction of the stock market over the next 6 months will be” The American Association of individual Investors (AAII) Polls indicate the bullishness and bearishness of the stock market. High bullish readings in the poll usually are signs of market tops; lows ones, market bottoms. The S&P 500 Index is a market capitalization-weighted index of 500 widely held common stocks. Investors cannot invest directly in an index and unmanaged index returns do not reflect any fees, expenses or sales charges. The information presented should not be considered a recommendation to purchase or sell any security and should not be relied upon as investment advice. It should not be assumed that any purchase or sale decisions will be profitable or will equal the performance of any security mentioned. References to specific securities are for illustrative purposes only. Portfolio composition is shown as of a point in time and is subject to change without notice. Investors should carefully review and consider the additional disclosures, investor notices, and other information contained elsewhere in this document as well as the Offering Documents prior to making a decision to invest. All historical financial information is unaudited and shall not be construed as a representation or warranty by us. References to indices and their respective performance data are not intended to imply that the Strategy’s objectives, strategies or investments were comparable to those of the indices in technique, composition or element of risk nor are they intended to imply that the fees or expense structures relating to the Strategy or its affiliates, were comparable to those of the indices; since the indices are unmanaged and cannot be invested in directly. The performance information depicted herein is not indicative of future results. There can be no assurance that Opportunity Equity’s investment objectives will be achieved, and a return realized. Returns for periods greater than one year are annualized. The views expressed in this commentary reflect those of Miller Value Partners portfolio managers as of the date of the commentary. Any views are subject to change at any time based on market or other conditions, and Miller Value Partners disclaims any responsibility to update such views. These views are not intended to be a forecast of future events, a guarantee of future results or investment advice. Because investment decisions are based on numerous factors, these views may not be relied upon as an indication of trading intent on behalf of any portfolio. Any data cited herein is from sources believed to be reliable, but is not guaranteed as to accuracy or completeness Click for more information on Miller Opportunity Equity and the Opportunity Equity Strategy Composite Performance Disclosure. |
Editor’s Note: The summary bullets for this article were chosen by Seeking Alpha editors.
Be the first to comment