

Leonid Sorokin
This week Microsoft (NASDAQ:MSFT) announced it will be increasing its quarterly dividend by 10% to $0.68 per share and Morgan Stanley analyst Keith Weiss kept an Overweight rating and $354 price target on the tech giant but with two bumps of seemingly good news, this wasn’t enough to convince investors with the latter not looking to happen anytime soon anyway.
Along with other major equities, Microsoft was forming a wave one two structure that if broken above with a macro third wave, would have seen Microsoft at the $350 region possibly in the next few months. This week’s break of major support has given technical confirmation that this won’t be the case and if Microsoft is to turn bullish, it will need to form another wave one two after this possible two-wave pattern was rendered a fail this week.
A meaty dividend raise by a cash-rich company would normally entice investors but as fears of a recession grow along with geopolitical issues again rearing their head this week, additional tech spending is often one of the first things on the list to go as companies look to sandbag the doors.
As we have seen a break of major support, we will now move to Microsoft’s original bearish structure from the high at the $350 region and re-examine where this equity could be headed.
Microsoft Monthly bearish structure (Microsoft)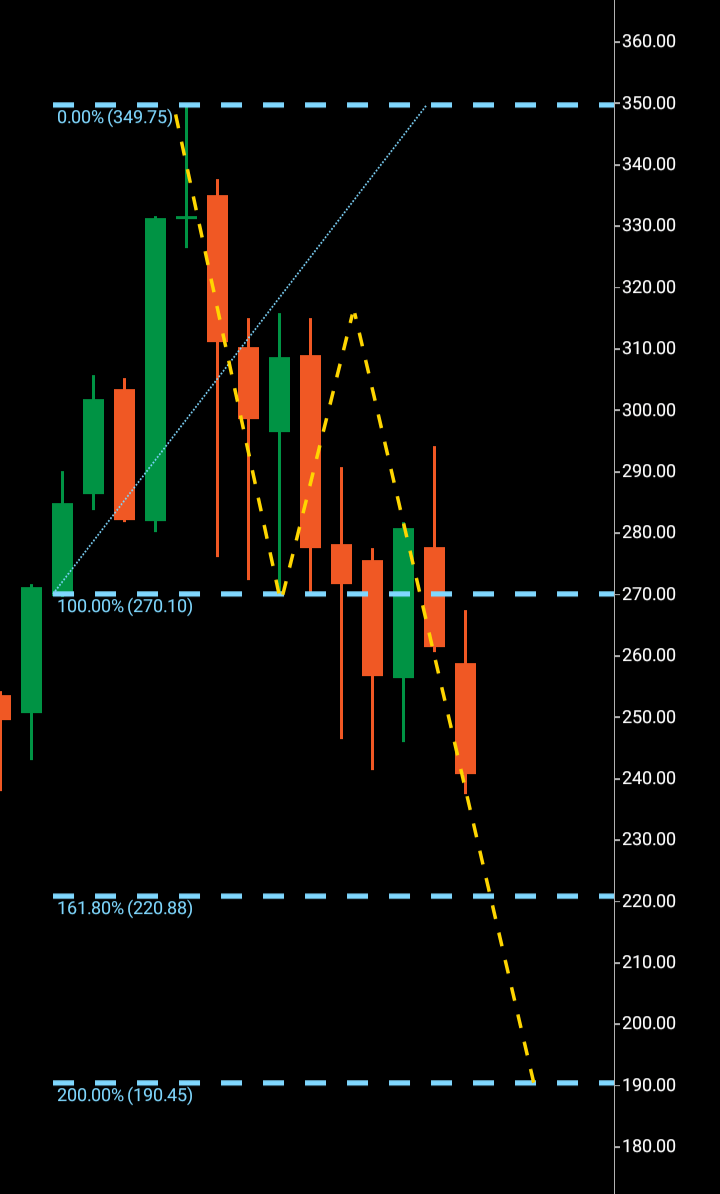
We can see on the monthly chart above the original bearish wave one $350-$270 and wave two $270-$315 with the third wave commencing by the break of $270. Snubbing its Fibonacci 161 so far by an attempted turnaround at the $240 region we can also see there was a buy-up at that area with a bullish candle included followed by a bearish rejection candle, this was the original potential bullish set-up that would look to propel Microsoft higher but with this week’s break of $240 initial support we must now look to where this bearish third wave may land.
The Fibonacci 161 lies at $220 and the 200 numerical copy of wave one lies at $190. Bearish waves work differently than bullish waves and are more complex at how they go about their business. Because a stock is susceptible to being bought up at a stage, they technically have less chance of completing at target than their bullish counterparts.
That said, with the latest break of $240 we are forced to re-examine this bearish structure and forced to look to the Fibonacci 161 at $220 as a near-term potential stop.
We will now move to the weekly chart to examine the internals of this structure and see if there is any confluence with a weekly three-wave pattern that links to the monthly.
Microsoft weekly chart (Microsoft)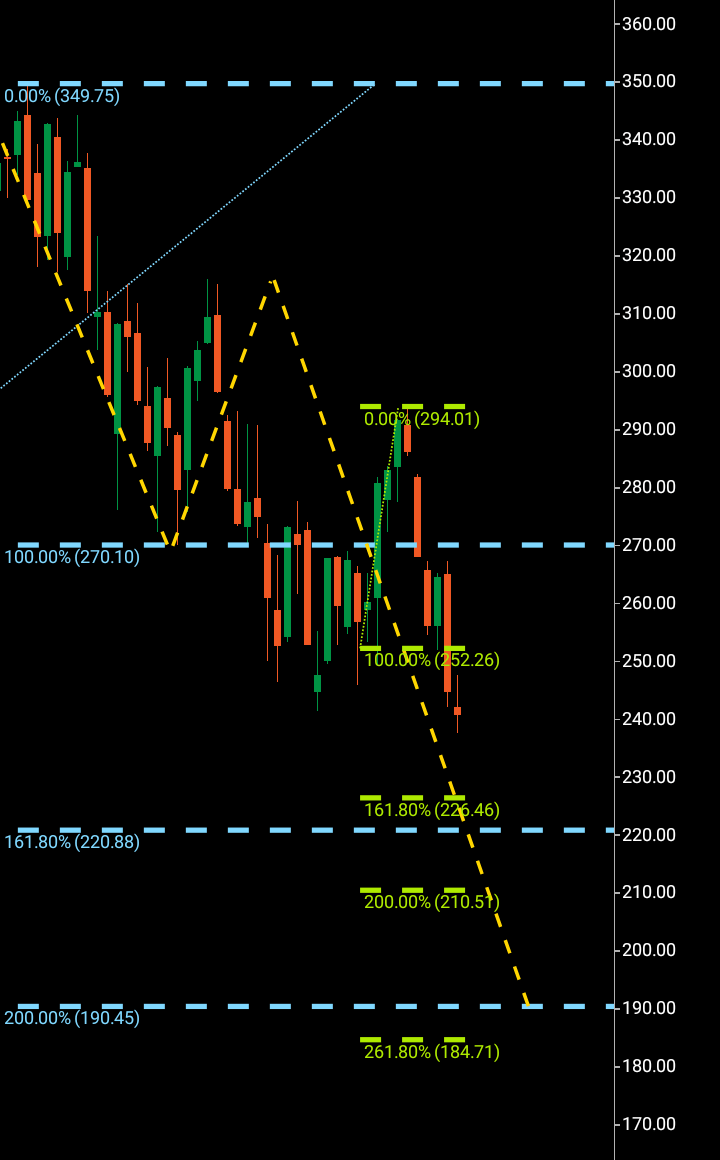
The immediate near-term high of $294 saw a drop to $252 where a weekly bullish candle formed. This has set out a bearish third wave on the weekly chart by the break of $252 with the weekly Fibonacci 161 lying at $226 and the 200 numerical copy of its wave one lying at $210. Exact confluence with the monthly chart eludes this structure, however, it is always advantageous to examine a lower timeframe to gather additional confirmation of a structure.
I would expect Microsoft to hit its bearish target of $220 within the next 60-90 days and will be looking for signals of a turnaround should this level be reached. $190 is an overall target if wave three is to copy wave one, but as this is a bearish structure, the Fibonacci 161 will be the first target to look to.
About the Three Wave Theory
The three-wave theory was designed to be able to identify the exact probable price action of a financial instrument. A financial market cannot navigate its way significantly higher or lower without making waves. Waves are essentially a mismatch between buyers and sellers and print a picture of a probable direction and target for a financial instrument. When waves one and two have been formed, it is the point of higher high/lower low that gives the technical indication of the future direction. A wave one will continue from a low to a high point before it finds significant enough rejection to then form the wave two. When a third wave breaks into a higher high/lower low, the only probable numerical target bearing available on a financial chart is the equivalent of the wave one low to high point. It is highly probable that the wave three will look to numerically replicate wave one before it makes its future directional decision. It may continue past its third wave target, but it is only the wave one evidence that a price was able to continue before rejection that is available to look to as a probable target for a third wave.
Be the first to comment