

Jean-Luc Ichard
Investment Thesis
- Microsoft (NASDAQ:MSFT) has very strong competitive advantages: the company has a strong brand image (4th most valuable brand in the world with an estimated value of $184,245M as according to Brand Finance) and has managed to build its own ecosystem. Furthermore, Microsoft has a broad and diversified product portfolio and disposes of strong financials (Moody’s Aaa credit rating and $104,749M in Total Cash & ST Investments). At the same time, it still has enough potential for further growth.
- I currently rate Microsoft as a strong buy: particularly due to its strong competitive advantages, strong financials and its currently attractive valuation. Furthermore, I consider the company to be very attractive when it comes to risk and reward.
- My investment thesis is underlined by the results of the HQC Scorecard in which Microsoft scores 88/100 points. Furthermore, it is supported by the results of the Seeking Alpha Quant Ranking: Microsoft is ranked 7th (out of 44) within the Systems Software Industry and 142nd (out of 639) within the Information Technology Sector.
- At the current stock prices, I expect a compound annual rate of return of about 12% for Microsoft over the next decade. This number is based on the calculations of my DCF Models.
The competitive advantages of Microsoft
Microsoft has strong competitive advantages over its competitors. I will list some of them here:
Microsoft’s Broad and Diversified Product Portfolio
In 2021, 32% ($53,915M) of Microsoft’s total revenue was generated by its business unit Productivity and Business Processes, 35.74% ($60,080M) by its business unit Intelligent Cloud and 32.18% ($54,093M) came from the unit of More Personal Computing. The fact that each of the three different business segments account for about 1/3 of the company’s total revenue is an indicator of its broad and diversified product portfolio and shows that it does not depend on a specific business unit.
Microsoft’s High Brand Value
Since the release of the Brand Finance Global 500 ranking in 2007, Microsoft has always been among the top 10 most valuable brands in the world. According to the same ranking, the company is currently listed as the world’s 4th most valuable brand with an estimated value of $184,245M. Only Apple (AAPL) (with a brand value of $355,080M), Amazon (AMZN) ($350,273M) and Google (GOOG) (GOOGL) ($263,425M) are ahead in terms of brand value. Microsoft’s strong brand image contributes to another significant competitive advantage of the company.
Microsoft’s Own Ecosystem
Microsoft has managed to build its own ecosystem: an example of this is its own Windows ecosystem, which includes the platform, apps, the store and the Windows 11 family of devices. Additionally, Microsoft’s enterprise products and cloud services are tied together. This brings benefits for its customers to use Microsoft products together.
Having its own ecosystem enables the company to create a large user base across multiple platforms. This ensures a high level of customer loyalty and provides the company with strong competitive advantages and a wide economic moat.
Switching Costs for Microsoft Customers
By establishing its own ecosystem, Microsoft also ensures that its customers will incur switching costs if they move from Microsoft to another product provider. This switching cost could be, for example, an enormous amount of time spent learning how to use one of its competitors’ products. The switching costs provide the company with another significant competitive advantage.
Microsoft’s Patents
Microsoft is a leader among technology companies in pursuing patents. Proof of this is the fact that the company currently has over 65,000 U.S. and international patents issued and additionally over 21,000 pending patents worldwide. The company’s high number of patents is an additional competitive advantage over its rivals.
Microsoft’s spending in Research and Development [R&D]
In 2021, Microsoft spent $20,716M in Research and Development. R&D expenses increased by 8% ($1.4B) in comparison to the previous year, driven in particular by cloud engineering investments. At the same time, the number implies that the company spent 12% of its revenue on Research & Development. This high spending in R&D helps the company to maintain its competitive advantage.
The Valuation of Microsoft
Discounted Cash Flow [DCF]-Model
In terms of valuation, I have used the DCF Model to determine the intrinsic value of Microsoft. The method calculates a fair value of $294.84. At the company’s current stock price, this gives Microsoft an upside of 18.40%.
My calculations are based on the following assumptions as presented below (in $ millions except per share items):
|
Microsoft |
|
|
Company Ticker |
MSFT |
|
Revenue Growth Rate for the next 5 years |
10% |
|
EBIT Growth Rate for the next 5 years |
10% |
|
Tax Rate |
13% |
|
Discount Rate [WACC] |
7.50% |
|
Perpetual Growth Rate |
3% |
|
EV/EBITDA Multiple |
18.7x |
|
Current Price/Share |
$249 |
|
Shares Outstanding |
7,458 |
|
Debt |
$78,400 |
|
Cash |
$13,931 |
|
Capex |
$23,886 |
Source: The Author
Based on the above, I have calculated the following results:
Market Value vs. Intrinsic Value
|
Microsoft |
|
|
Market Value |
$249 |
|
Upside |
18.4% |
|
Intrinsic Value |
$294.84 |
Source: The Author
The Expected Compound Annual Rate of Return for Microsoft
The Internal Rate of Return [IRR] is defined as the expected compound annual rate of return earned on an investment. Below you can find the Internal Rate of Return as according to my DCF Model (when assuming different purchase prices for the Microsoft stock).
At Microsoft’s current stock price of $249, my DCF Model indicates an Internal Rate of Return of approximately 12% for the company (while assuming a Revenue and EBIT Growth Rate of 10% for the next 5 years and a Perpetual Growth Rate of 3% afterwards). (In bold you can see the Internal Rate of Return for Microsoft’s current stock price of $249.) Please note that the Internal Rates of Return below are a result of the calculations of my DCF Model and changing its assumptions could result in different Internal Rates of Return.
|
Purchase Price of the Microsoft Stock |
Internal Rate of Return as according to my DCF Model |
|
$200 |
18% |
|
$210 |
17% |
|
$220 |
15% |
|
$230 |
14% |
|
$240 |
13% |
|
$249 |
12% |
|
$250 |
12% |
|
$260 |
11% |
|
$270 |
10% |
|
$280 |
9% |
|
$290 |
8% |
Source: The Author
Relative Valuation Models
The P/E [FWD] Ratio for Microsoft
Microsoft’s P/E [FWD] Ratio is currently 24.63, which is 20.03% below its 5 Year Average (30.80), providing us with an indicator that the company is currently undervalued.
Microsoft’s Fundamentals
Microsoft’s EBIT Margin of 42.06% is higher than a number of its competitors such as Alphabet (EBIT Margin of 29.65%), Apple (30.53%), Amazon (3.15%) and IBM (NYSE:IBM) (11.05%), underlying the company’s strong competitive position.
Over the past three years, Microsoft has produced a Revenue Growth Rate [CAGR] of 16.36% and an EBIT Growth Rate [CAGR] of 24.74%, confirming its excellent growth prospects. Over the same time period, Microsoft has shown a Dividend Growth Rate [CAGR] of 10.46%. Over the last five years, its Dividend Growth Rate [CAGR] of 9.71% is higher than the one of Apple (8.45%) and IBM (3.5%) over the same time period.
Additionally, Microsoft’s EBIT Growth Rate of 24.74% over the last three years is higher than that of Apple (22.74%), Amazon (0.63%) and IBM (-18.59%), demonstrating that the company is growing its profits with higher rates than these competitors. However, Microsoft’s EBIT Growth Rate is slightly lower than the one of Alphabet (33.92%).
Microsoft’s EPS Growth Diluted [FWD] of 14.58% and its Free Cash Flow Per Share Growth Rate [FWD] of 13.87% provide further assurance that the company is on track in terms of growth.
The company’s Payout Ratio of 26.96% demonstrates that there is plenty of scope for future dividend enhancements. Due to having a relatively low dividend payout ratio, a Dividend Growth Rate [CAGR] of 9.71% over the last five years as well as its 17 consecutive years of Dividend Growth, the company is an excellent choice for dividend growth investors.
|
Microsoft |
Alphabet |
Apple |
Amazon |
IBM |
||
|
General Information |
Ticker |
MSFT |
GOOG |
AAPL |
AMZN |
IBM |
|
Sector |
Information Technology |
Communication Services |
Information Technology |
Consumer Discretionary |
Information Technology |
|
|
Industry |
Systems Software |
Interactive Media and Services |
Technology Hardware, Storage and Peripherals |
Internet and Direct Marketing Retail |
IT Consulting and Other Services |
|
|
Market Cap |
1.86T |
1.33T |
2.35T |
1.23T |
113.57B |
|
|
Profitability |
EBIT Margin |
42.06% |
29.65% |
30.53% |
3.15% |
11.05% |
|
ROE |
47.15% |
29.22% |
162.82% |
9.43% |
27.09% |
|
|
Valuation |
P/E GAAP [FWD] |
24.43 |
19.80 |
23.83 |
4,019.38 |
19.08 |
|
P/E GAAP [TTM] |
25.57 |
18.86 |
24.07 |
106.75 |
19.71 |
|
|
Growth |
Revenue Growth 3 Year [CAGR] |
16.36% |
23.32% |
14.37% |
24.46% |
-8.48% |
|
Revenue Growth 5 Year [CAGR] |
15.47% |
22.88% |
11.64% |
26.48% |
-5.32% |
|
|
EBIT Growth 3 Year [CAGR] |
24.74% |
33.92% |
22.47% |
0.63% |
-18.59% |
|
|
EPS Growth Diluted [FWD] |
14.45% |
26.87% |
25.31% |
2.98% |
5.01% |
|
|
Dividends |
Dividend Yield [FWD] |
1.10% |
– |
0.63% |
– |
5.40% |
|
Dividend Growth 3 Yr [CAGR] |
10.46% |
– |
6.27% |
– |
2.59% |
|
|
Dividend Growth 5 Yr [CAGR] |
9.71% |
– |
8.45% |
– |
3.50% |
|
|
Consecutive Years of Dividend Growth |
17 Years |
– |
8 Years |
– |
22 Years |
|
|
Dividend Frequency |
Quarterly |
– |
Quarterly |
– |
Quarterly |
|
|
Income Statement |
Revenue |
198.27B |
278.14B |
387.54B |
485.90B |
59.68B |
|
EBITDA |
97.98B |
96.89B |
129.56B |
52.62B |
12.16B |
|
|
Balance Sheet |
Total Debt to Equity Ratio |
47.08% |
11.28% |
205.98% |
119.91% |
274.06% |
|
Risk |
60M Beta |
0.96 |
1.10 |
1.25 |
1.32 |
0.83 |
The High-Quality Company [HQC] Scorecard
“The aim of the HQC Scorecard that I have developed is to help investors identify companies which are attractive long-term investments in terms of risk and reward.” Here you can find a detailed description of how the HQC Scorecard works.
Overview of the Items on the HQC Scorecard
“In the graphic below, you can find the individual items and weighting for each category of the HQC Scorecard. A score between 0 and 5 is given (with 0 being the lowest rating and 5 the highest) for each item on the Scorecard. Furthermore, you can see the conditions that must be met for each point of every rated item.”
Source: The Author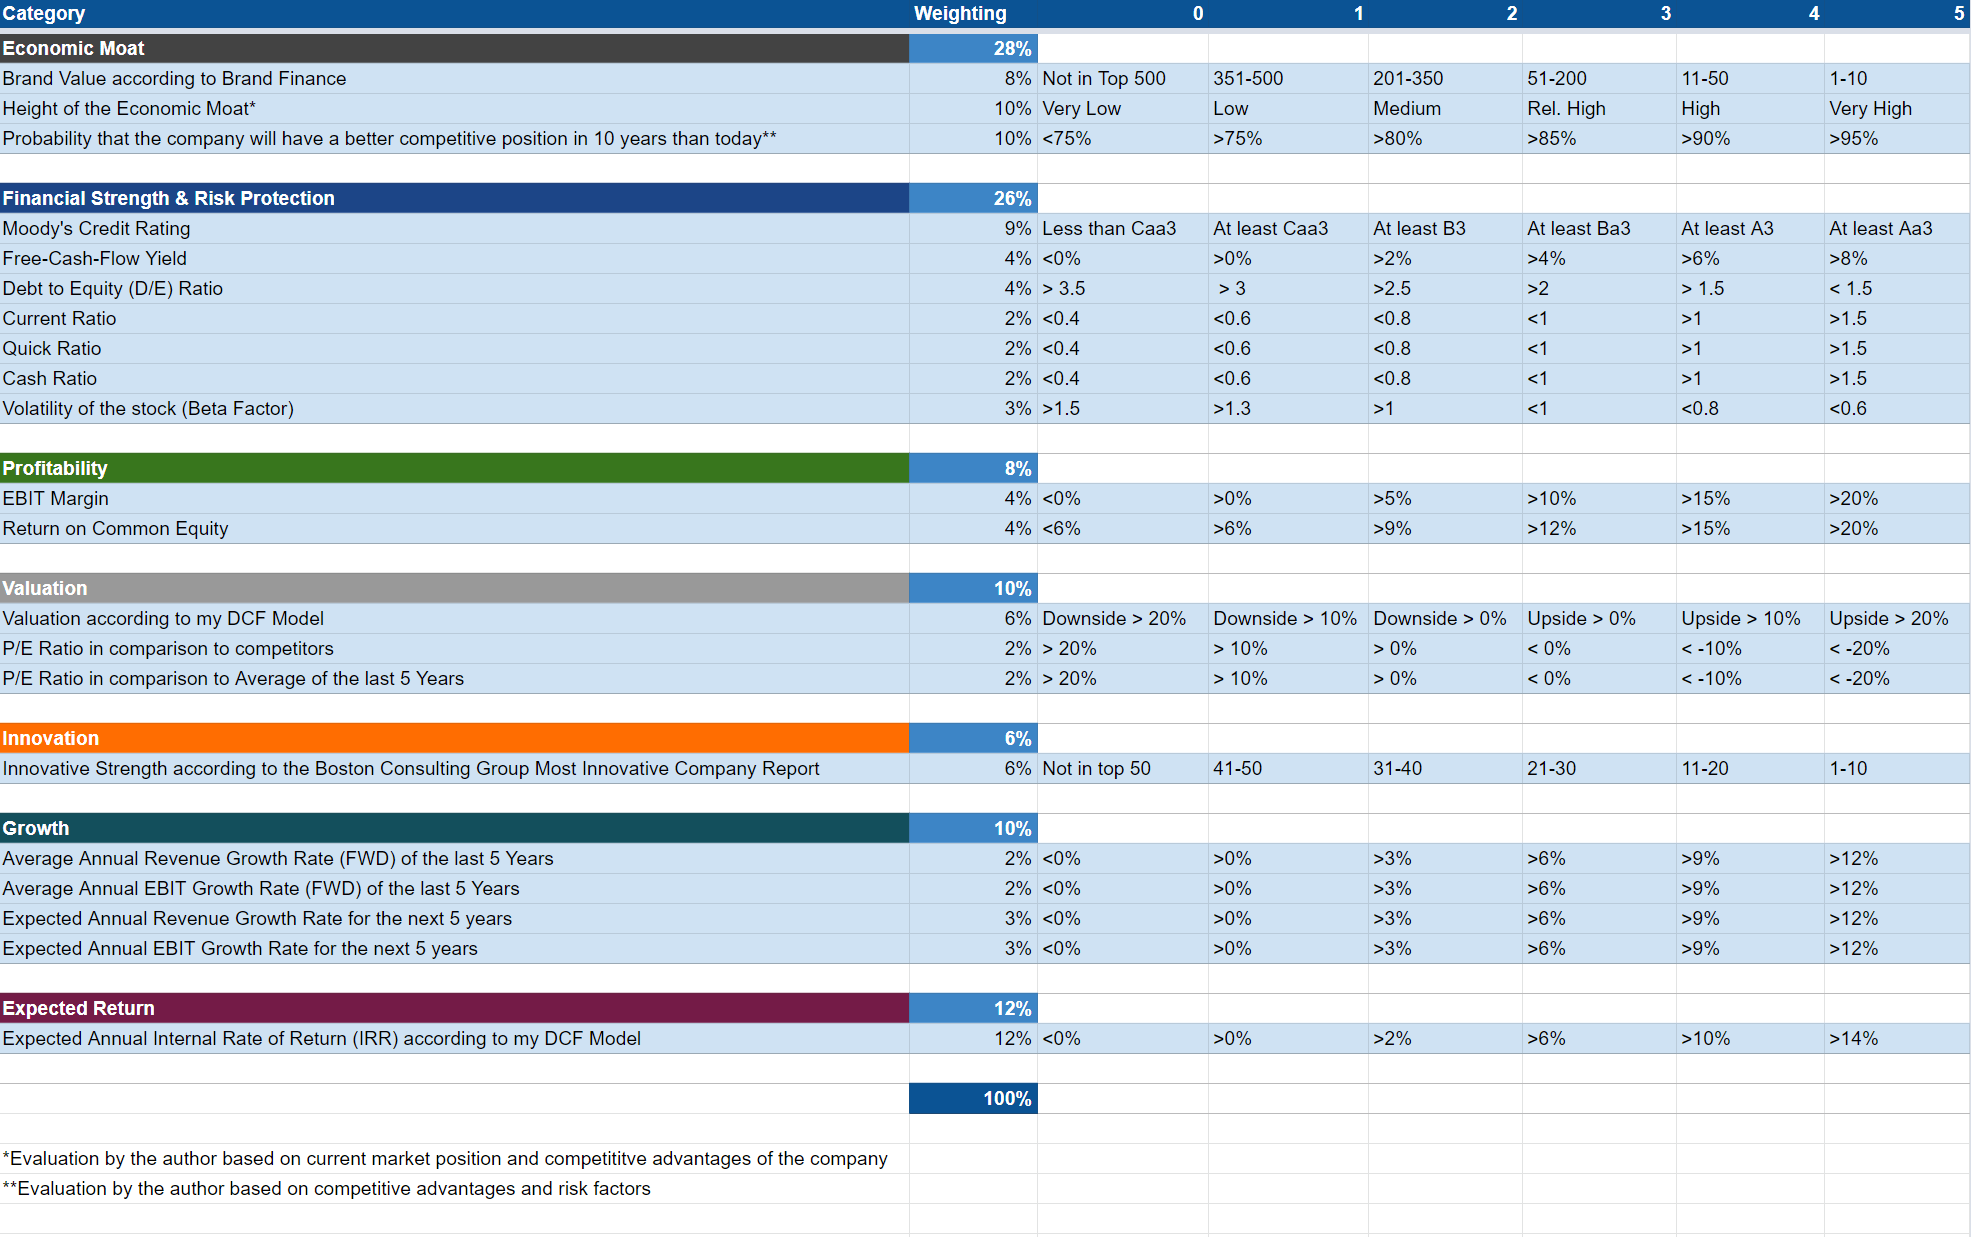
Microsoft According to the HQC Scorecard
Source: The Author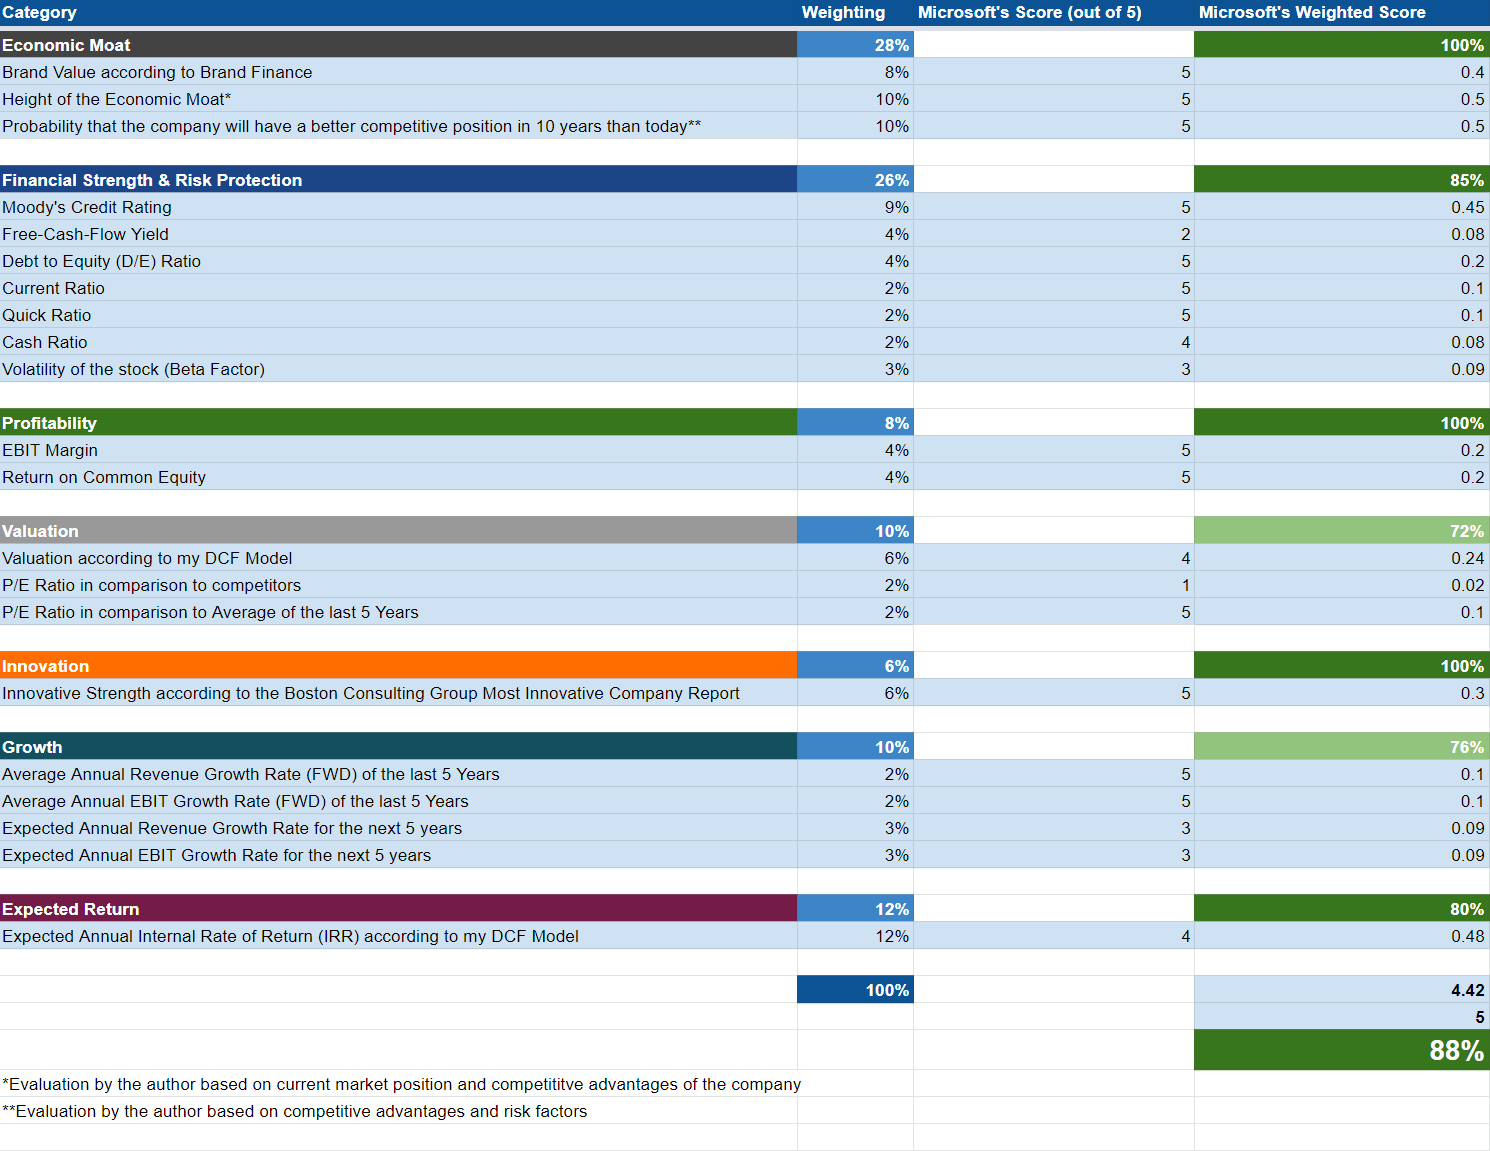
In all categories of the HQC Scorecard, Microsoft is at least rated as attractive.
In the category of Economic Moat, the company receives 100/100 points.
In the category of Financial Strength, Microsoft is rated with 85/100 points. Microsoft’s very attractive rating in this category is particularly a result of its Aaa credit rating by Moody’s, its low Debt to Equity Ratio, high Current Ratio (1.78), Quick Ratio (1.57) and Cash Ratio (1.1).
For Profitability, Microsoft receives the maximum score of 100/100 points. This excellent scoring is a consequence of the company’s high EBIT Margin (42.06%) and high ROE (47.15%).
In terms of Valuation, Microsoft receives 72/100.
For Innovation, Microsoft scores 100/100 and for Growth, it receives 76/100.
For Expected Return, the company gets 80/100 points. This is a result of Microsoft’s relatively high expected Compound Annual Rate of Return as according to my DCF Model.
Microsoft’s very attractive overall rating (88/100) as according to the HQC Scorecard strengthens my belief that the company is currently a strong buy.
Microsoft According to the Seeking Alpha Quant Factor Grades
According to the Seeking Alpha Quant Factor Grades, Microsoft receives a D- for Valuation and a D for Growth. For Profitability, the company receives an A+ rating and a B- for Momentum. For Revisions, it gets a C-.
Source: Seeking Alpha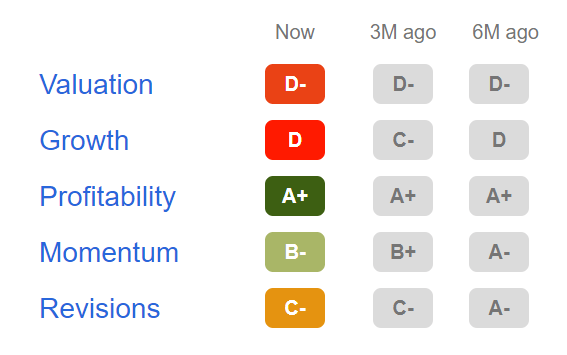
Microsoft According to the Seeking Alpha Quant Ranking
Microsoft’s excellent competitive position is underlined by the Seeking Alpha Quant Ranking. Within the Systems Software Industry, Microsoft is ranked 7th (out of 44). Within the Information Technology Sector, the company is ranked 142nd (out of 639). In the overall ranking, Microsoft is placed 1139th out of 4696.
Source: Seeking Alpha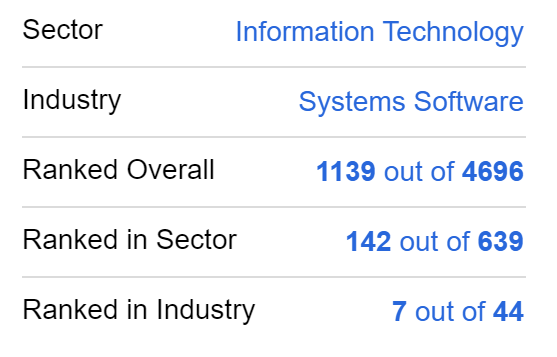
Microsoft According to the Seeking Alpha Authors Rating and Wall Street Analysts Rating
The Seeking Alpha Authors Rating indicates that Microsoft is currently a hold. According to the Wall Street Analysts, the company is rated as a strong buy. Taking into consideration the Seeking Alpha Quant Ranking, the company is rated as a hold.
Source: Seeking Alpha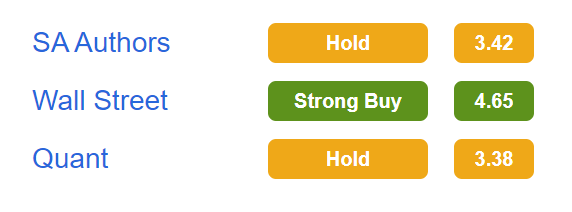
Microsoft According to the Seeking Alpha Dividend Grades
Let’s take a look at the Seeking Alpha Dividend Grades: in terms of Dividend Safety, Microsoft receives an A. For Dividend Growth, the company receives an A+. In terms of Dividend Yield, Microsoft gets a D+ and for Dividend Consistency, it receives an A. This excellent rating as according to the Seeking Alpha Dividend Grades, confirms that the company is an excellent choice for dividend growth investors.
Source: Seeking Alpha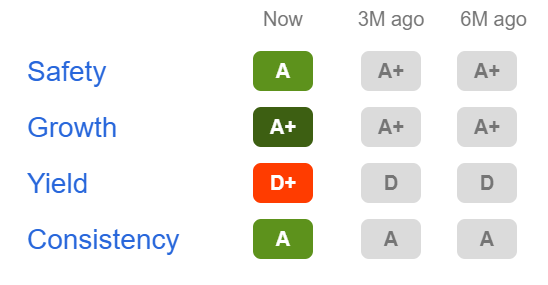
Risks
One of the main risk factors I see when investing in Microsoft is the fact that the company faces competition in various sectors and that it competes with rivals that also have strong competitive advantages.
Microsoft’s cloud computing service Azure faces competition from other similar providers such as Amazon, Google, IBM and Oracle (NYSE:ORCL). Microsoft’s Xbox and its cloud gaming services face competition with other online streaming services, operated by, for example, Amazon, Apple and Tencent (OTCPK:TCEHY). Additionally, the company’s gaming platform competes with console platforms from Nintendo (OTCPK:NTDOY) and Sony (NYSE:SONY). In addition to that, Microsoft faces competition from computer, tablet, and hardware manufacturers that offer high-quality industrial design and innovative technologies. One of the main competitors in this industry is Apple. The intense competition that Microsoft faces with its opponents, can result in declining profit margins in the future.
An additional risk I see for investors would be if Microsoft fails to meet growth expectations in one of the following quarters. This could have a significant impact on its share price in the short term. However, I consider this risk to be less important for long-term investors.
Although Microsoft faces strong competition in various areas in which it operates, I consider the risk of investing in the company as being relatively low. This is due to the fact that the company has a wide economic moat, which helps it to maintain its competitive advantages. Particularly, Microsoft’s own ecosystem, its strong brand image and strong financials contribute to the fact that I consider the investment risk to be relatively low. Microsoft’s strong financials are underlined by the company’s Aaa credit rating by Moody’s and its Total Cash & ST Investments Position of $104,749M.
In addition to the above, the HQC Scorecard rates Microsoft as very attractive when it comes to risk and reward, which once again underlines my theory that the risk of investing in Microsoft can be considered as relatively low.
Growth Drivers for Microsoft
Particularly in the following areas I still see a lot of growth potential for Microsoft:
Cloud Service
According to Fortune Business Insights, the global Cloud Computing Market Size will reach $791.48B in 2028, growing with a CAGR of 17.9% from 2022 till 2028. According to data from Statista, Amazon’s AWS is currently the leading cloud infrastructure service provider with a worldwide market share of 34%. Microsoft’s Azur is second with a market share of 21%, ahead of Alphabet’s Google Cloud (market share of 10%), Alibaba Cloud (5%) and IBM Cloud (4%).
Personally, I expect the cloud computing market to grow significantly in the years to come since it provides its customers with enormous opportunities. Customers can save on costs, since they do not have to set up their own data center and it also enables companies to have significantly more flexible capacities.
Due to the potential of Cloud Computing, there is still enormous growth potential for Microsoft, even if the company failed to succeed in further expanding its market share in the years to come.
Data and Artificial Intelligence
In my opinion, data is one of the company’s most valuable assets and is very important for the decision making process of managers.
According to Microsoft, the company will create more data in the next three years than they did in the past 10. With Azure Synapse, Microsoft brings together data integration, data warehousing, and big data analytics and offers companies the ability to ensure that data is used for their own benefit.
With LinkedIn, Microsoft has access to the data of 774 million LinkedIn members. Since Microsoft acquired LinkedIn back in 2016, the revenue of the platform has nearly tripled. Today, it is a leading platform in B2B advertising as well as in professional hiring and corporate learning. I expect LinkedIn to continue its growth story in the years to come.
Gaming Sector
I see the gaming sector as an additional growth driver for Microsoft in the upcoming years. Worldwide, three billion people play games, making gaming the largest category in the entertainment industry. The Xbox Game Pass helps Microsoft to transform how people connect and engage with games. In addition to that, Microsoft’s acquisition of Activision Blizzard will give the company the opportunity to provide even more games and additional content to its customers. It also enables the company to charge higher fees for their Game Pass in the future.
The Bottom Line
Microsoft has strong competitive advantages over its competitors: the company has built its own ecosystem and has a strong brand image. In addition to that, it has a broad and diversified product portfolio and strong financials (Aaa credit rating by Moody’s and $104,749M in Total Cash & ST Investments). The fact that the company spends more than $20B annually in Research and Development helps it to maintain its competitive advantages over less financially strong competitors.
Despite its size (current market capitalization of 1.86T and revenue of $198.27B in 2022), Microsoft still has plenty of growth potential. In this analysis, I have shown that I still see enormous growth potential for the company in the areas of Cloud Computing, Data and Artificial Intelligence and the Gaming Sector.
Due to Microsoft’s strong competitive advantages, the company’s attractive valuation in combination with its growth perspectives, I rate Microsoft as a strong buy. Microsoft’s very attractive rating as according to the HQC Scorecard (88/100 points) underlines my theory that the company is currently a strong buy.
In addition to that, I consider Microsoft to be an excellent pick for dividend growth investors. This is underlined by the company’s Dividend Growth Rate [CAGR] of 9.71% over the last five years and its growth potential.
Do you agree that Microsoft is currently a strong buy? Thank you for sharing your opinion!
Be the first to comment