

Tero Vesalainen/iStock via Getty Images
Investment Thesis
Microsoft Corporation (NASDAQ:MSFT) remains an excellent stock for a long-term hold, given its impressive 10Y Price Total Return of 1002.3%. We last covered the stock in March 2022. With the recent market correction in November 2021 breaking its decade-long gain, we are definitely seeing an apparent decoupling of its stellar operating metrics/ financial performance with its stock price/ valuations. Therefore, given the bearish market sentiments and potential recession crashing the stock market and MSFT stock prices moving forward, we encourage caution for any investors looking to add during this perceived dip, since we may eventually see a more attractive entry point in the short and intermediate-term.
In addition, we prefer the clarity that MSFT’s FQ4’22 earnings call will provide on 26 July 2022, given its FY2023 guidance. Patience, my dears.
MSFT Had Clearly Benefited From The Cloud Boom
S&P Capital IQ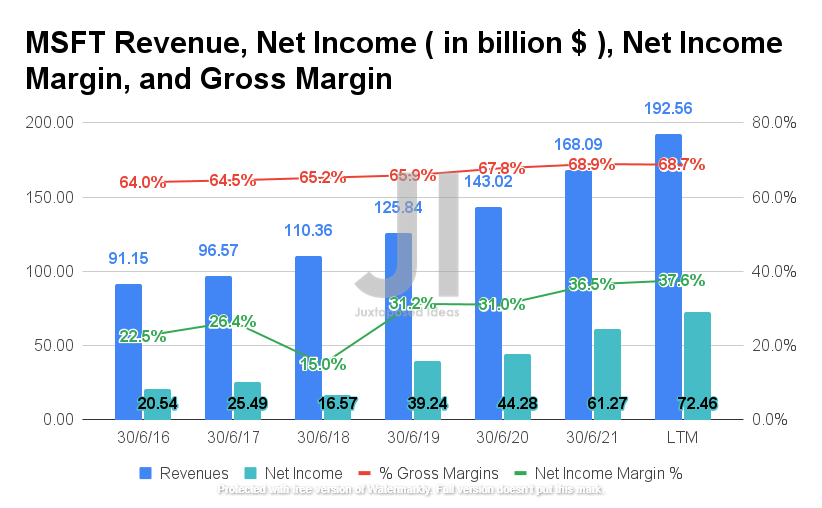
MSFT has had exponential growth in revenue in the past three years with a CAGR of 15.23%, compared to pre-pandemic levels of 11.35%. In addition, the company also continues to report enhanced gross and net income margins, highlighting the growth in its profitability and improved operating efficiencies thus far. By the LTM, MSFT reported revenues of $192.56B and gross margins of 68.7%, representing an increase of 53% and 2.8 percentage points from FY2019 levels, respectively. In addition, the company also reported a record-breaking net income of $72.46B and net income margins of 37.6%, representing an increase of 84.6% and 6.4 percentage points from FY2019 levels, respectively. It is evident that the pandemic has been kind to MSFT thus far, which accelerated its growth by one year.
S&P Capital IQ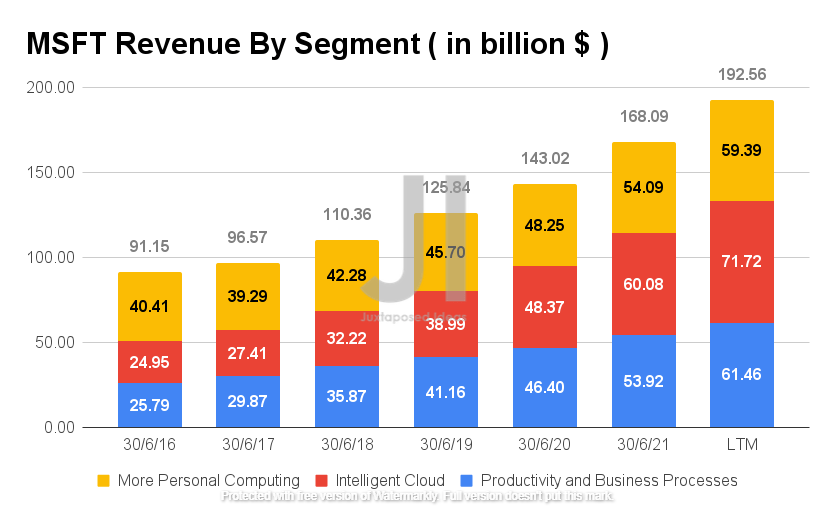
As seen from the chart, MSFT has been reporting massive growth in its Intelligent Cloud segment, which began to account for the majority of its revenues by FY2020. By the LTM, the company reported revenues of $71.72B for its cloud segment, representing an increase of 83.9% from FY2019 levels. The COVID-19 pandemic has indeed pulled forward the consumer demand for cloud services, since Amazon (AMZN) also reported a similar 91.6% growth for its AWS segment from FY2019 levels.
The Public Cloud Services market has grown immensely in the past two years, from $45.7B in 2019 to $90.89B in 2021, with analysts in Gartner projecting further growth to $156.27B by 2023. At the same time, MSFT has also been growing its market share from 17.4% in 2019 to 21.1% in 2021, with continued growth expected moving forward, thanks to its strategic vertical integration and packaged pricing for its enterprise software and services. Even Big Tech giants, such as Meta (META), had expanded their cloud partnership with MSFT’s Azure supercomputing powers for large-scale AI research. As a result, given the robust consumer demand and continuing migration to cloud computing in this and coming decade, we expect MSFT to excel indeed.
S&P Capital IQ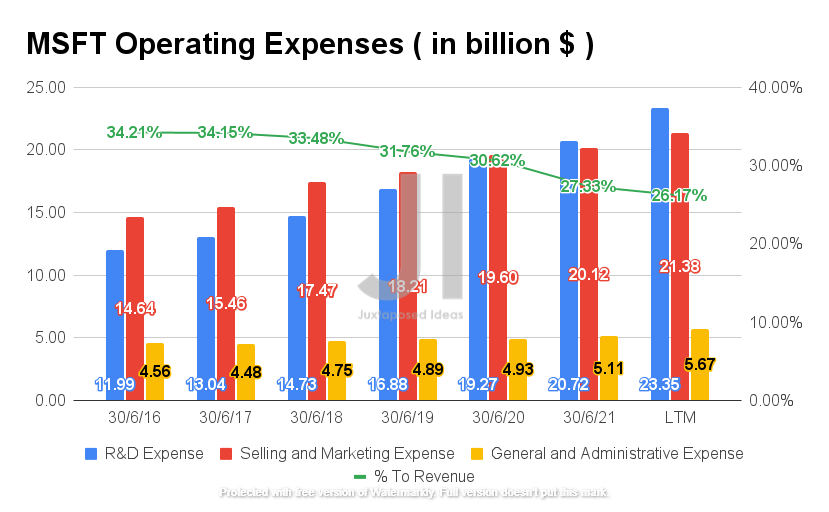
Therefore, it is not surprising that MSFT has also been increasing its operating expenses, given the massive growth in its cloud segment thus far. By the LTM, the company reported total operating expenses of $50.4B, representing a notable increase of 26.1% from FY2019 levels. Nonetheless, the ratio to its growing revenue has also decreased accordingly by 5.59 percentage points, from 31.76% in FY2019 to 26.17% by the LTM, thereby ensuring the sustained rise in its net income profitability.
S&P Capital IQ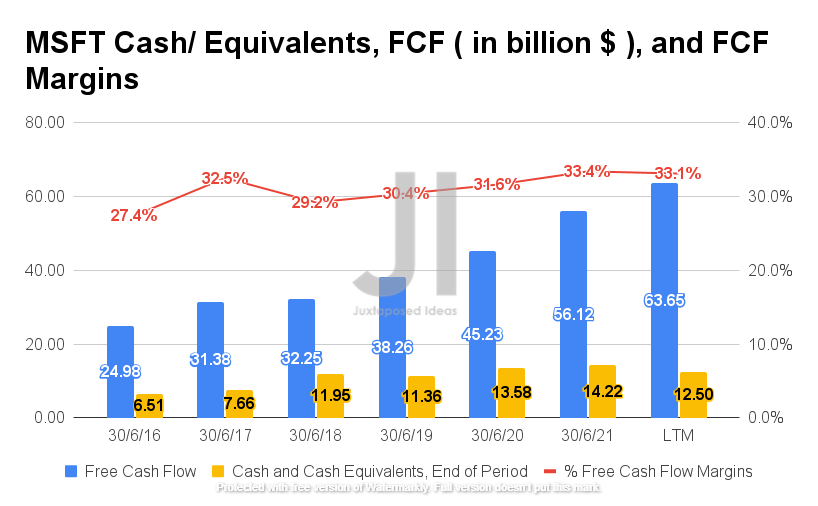
As a result of its elevated net income profitability, MSFT has also been generating robust Free Cash Flow (FCF) of $63.65B with a growing FCF margin of 33.1% in the LTM, representing an increase of 66.3% and 2.7 percentage points from FY2019 levels. Given the consensus estimates’ projected revenue and net income growth, we expect the company to continue recording robust FCF growth moving forward, thereby improving its chances of stock recovery during or after the potential recession in FY2023.
S&P Capital IQ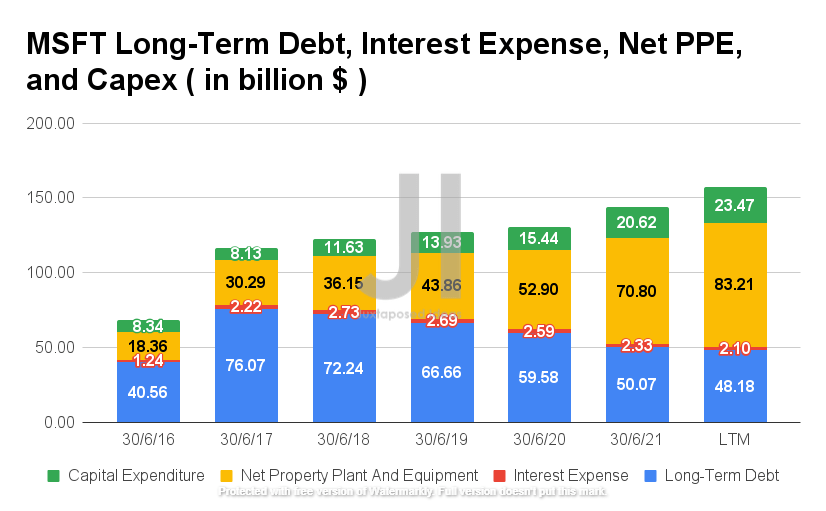
As the chart above shows, MSFT has been successfully deleveraging its long-term debts since FY2018. By the LTM, the company reported long-term debt of $48.18B and interest expense of $2.1B, representing a massive decline of 27.7% and 21.9% from FY2017 levels, respectively.
In contrast, MSFT has been diligently growing its capabilities through its net PPE assets to $83.21B with an increase in capital expenditure to $23.47B in the LTM, representing an enormous growth of 89.7% and 68.4% from FY2019 levels, respectively. Since these investments would be directly top and bottom lines accretive, we are highly encouraged by its aggressive expansions ( especially Azure’s 60-plus data center regions connected by over 175,000 miles of fiber over 190 points of presence by FQ3’22 ), given the company’s robust net income and FCF profitability.
S&P Capital IQ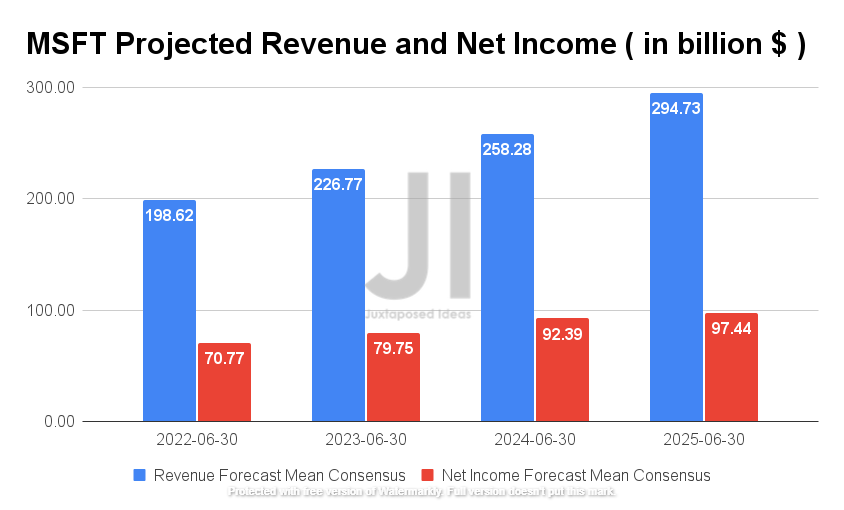
Over the next three years, MSFT is expected to report revenue growth at a CAGR of 14.06% and net income at 11.25%. For FQ4’22, consensus estimates that the company will report revenues of $52.23B and net incomes of $14.79B, representing YoY growth of 13.1% though a decline of 10%, respectively. Nonetheless, it is also evident that MSFT is expected to report normalized net income margins moving forward, from 36.5% in FY2021 to 33.1% in FY2025, though it is still a notable improvement from its pre-pandemic levels of 31.2% in FY2019. We shall see.
MSFT Is Still A Decent Dividend Stock
MSFT 10Y Share Price and Dividend Yield
S&P Capital IQ
As evident from the chart, the MSFT stock has had a robust upwards trend in the past ten years, excluding the market-wide correction since November 2021. Combined with its decent dividend yield of 0.9%, long-term investors would have had a more than impressive 10Y Price Total Return of 1002.3%, given the adj. stock price appreciation from $29.60 in July 2012 to $267.66 in July 2022. Even newer investors would have been more than happy with MSFT’s 5Y Price Total Return of 308.3%, demonstrating the stock’s high investment quality.
Though MSFT’s dividend yield has unfortunately declined by -64.09% in the past decade, it has also been increasing its quarterly dividend payouts from $0.20 in 2012 to $0.62 in 2022. It is worth noting that the company also raised its dividend payouts twice during the pandemic, from $0.51 in FQ4’19 to $0.56 in FQ4’20 to $0.62 in FQ4’21. Assuming that the trend holds up, we may expect to see MSFT raise its dividend payouts again by FQ4’22, speculatively to $0.69, assuming an 11% quarterly dividend hike similarly in FQ4’21. We shall see.
S&P Capital IQ
In addition, MSFT also approved a record-breaking $60B share buyback program with no expiration date in September 2021. The program highlights the immense value the company would be bringing to its long-term investors, negating its elevated historical Stock-Based Compensation (SBC). Therefore, despite MSFT’s high SBC expenses of $7.08B in the LTM, we are not overly concerned since the company has always kept its diluted shares outstanding in check. In addition, these SBC compensations would also help MSFT keep its top talents in the highly competitive tech environment, ensuring its leadership and sustained relevance moving forward.
So, Is MSFT Stock A Buy, Sell, or Hold?
MSFT 5Y EV/Revenue and P/E Valuations
S&P Capital IQ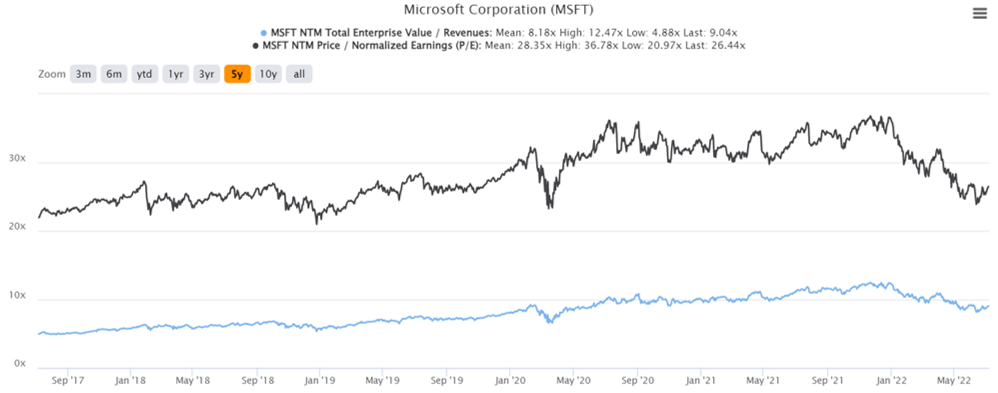
MSFT is currently trading at an EV/NTM Revenue of 9.04x and NTM P/E of 26.44x, higher than its 5Y EV/Revenue mean of 8.18x though lower than its 5Y P/E mean of 28.35x. The stock is also trading at $253.67, down 27.4% from its 52 weeks high of $349.67, nearing its 52 weeks low of $241.51. The MSFT stock also experienced the infamous market-wide correction since November 2021, breaking its historical bull run in the past decade. It is evident that there is a notable decoupling of the company’s improved operating metrics and financial performance from its stock price/ valuations in the current bearish market.
MSFT 5Y Stock Price
Seeking Alpha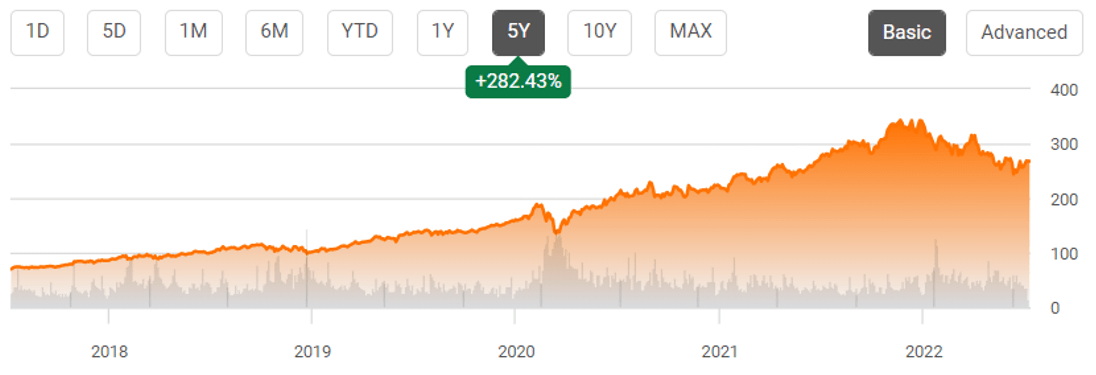
Unfortunately, given the rising inflation and the potential recession reducing corporate consumer spending, we may expect another drastic correction as we saw in the previous recession in 2008 and 2009. The MSFT stock had plunged by 56.8%, from $36.32 in December 2007 to $15.67 in March 2009, while also reporting a decline of -3.3% in revenues and -17.6% in net incomes YoY in FY2009.
Therefore, despite the consensus estimates’ strong buy rating with a price target of $347.75, we are unconvinced of MSFT’s 29.92% upside and the eventual timeline for stock recovery. As a result, we advise investors to be patient for now, since MSFT is expected to report FQ4’22 earnings on 27 July 2022. This way, we will gain more insight into the company’s current performance and, most importantly, its FY2023 guidance.
Therefore, we rate MSFT stock as a Hold for now.
Be the first to comment