

krblokhin/iStock Editorial via Getty Images
Micron (NASDAQ:MU) ticked slightly higher after releasing earnings that included a dire outlook. The memory chip company appears to be heading towards the rough end of the cycle as demand growth is expected to fall behind supply growth. While the stock might look cheap on a price to earnings basis, free cash flow is likely to be pressured in the near term – though the strong cash-rich balance sheet should help the company to weather the storm. Given other valuations across the tech sector, it is still difficult to recommend buying what amounts to a cyclical stock trading at typical valuations.
MU Stock Price
After a recent slide, MU is now trading nearly 50% lower than all time highs reached earlier this year. The stock’s trading pattern indeed resembles one of a cyclical nature.
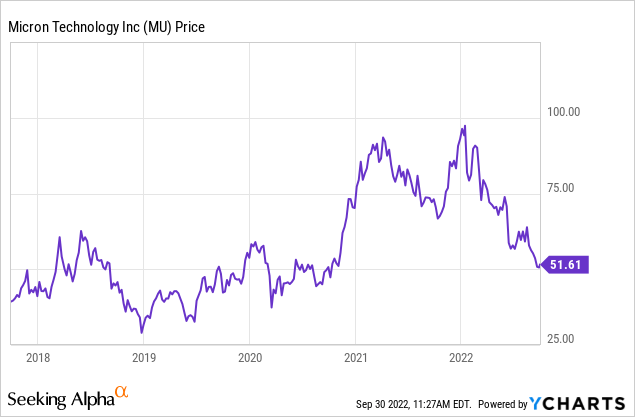
I last covered MU in August where I remained neutral on the stock due to my analysis of cross-cycle free cash flow multiples. The stock has since fallen 21% though given where everything else is trading, it may still be too early to back up the truck.
MU Stock Key Metrics
MU wrapped up its fiscal 2022 year, a year in which it generated solid growth in both revenue and net income.
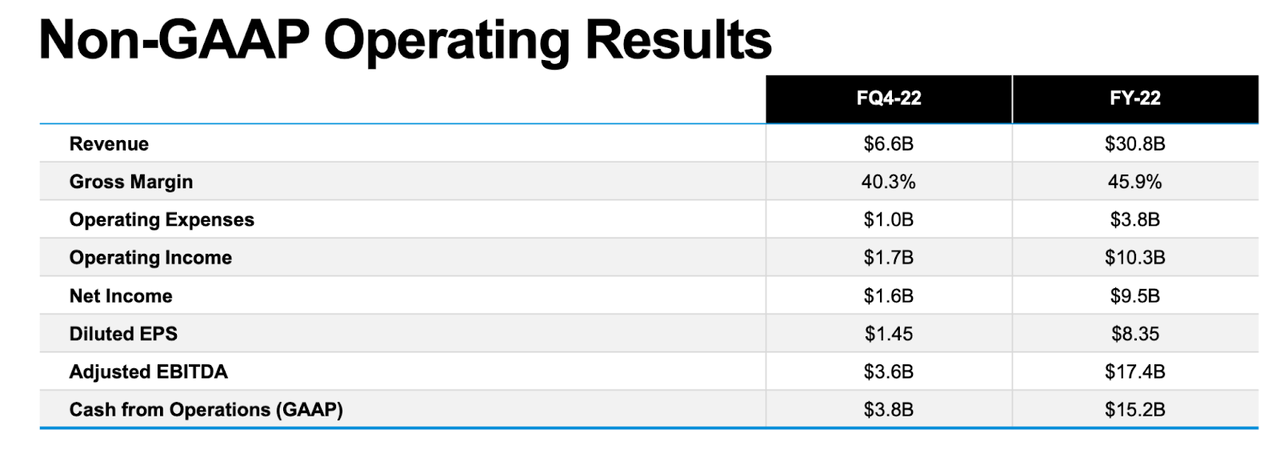
FY22 Q4 Presentation
Unfortunately it is the recent quarter that matters most. MU saw revenues decline both sequentially and year over year in all business units.
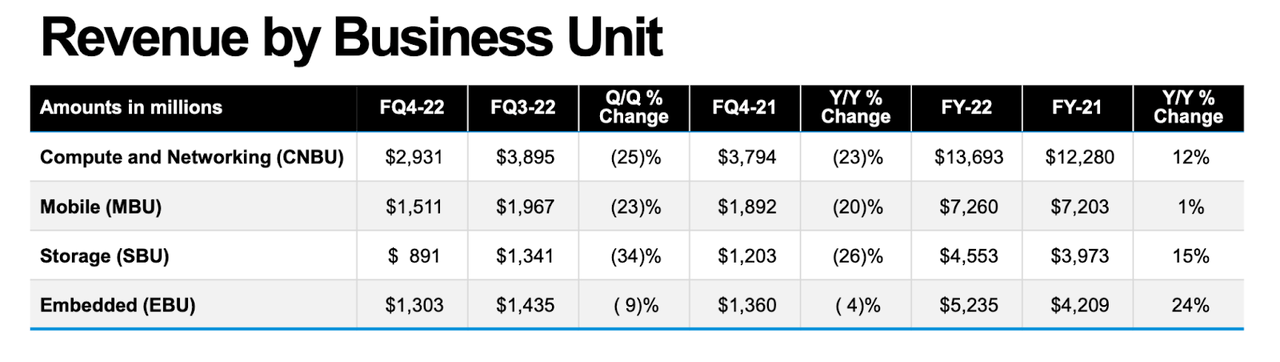
FY22 Q4 Presentation
A common thread was that lower demand led to declines in prices. Some readers may be surprised to see that revenues declined even in the data center business considering that semiconductor peers AMD (AMD) and Nvidia (NVDA) continue to report solid growth there. It is in times like these that it is important to recognize the business model differences even within the semiconductor industry – the cyclical nature of the memory chip market helps to explain why NVDA and AMD always trade at significantly higher multiples.

FY22 Q4 Presentation
MU expects the weak supply-demand dynamic to persist until next year, with an “extremely aggressive pricing environment” for the remainder of this year.
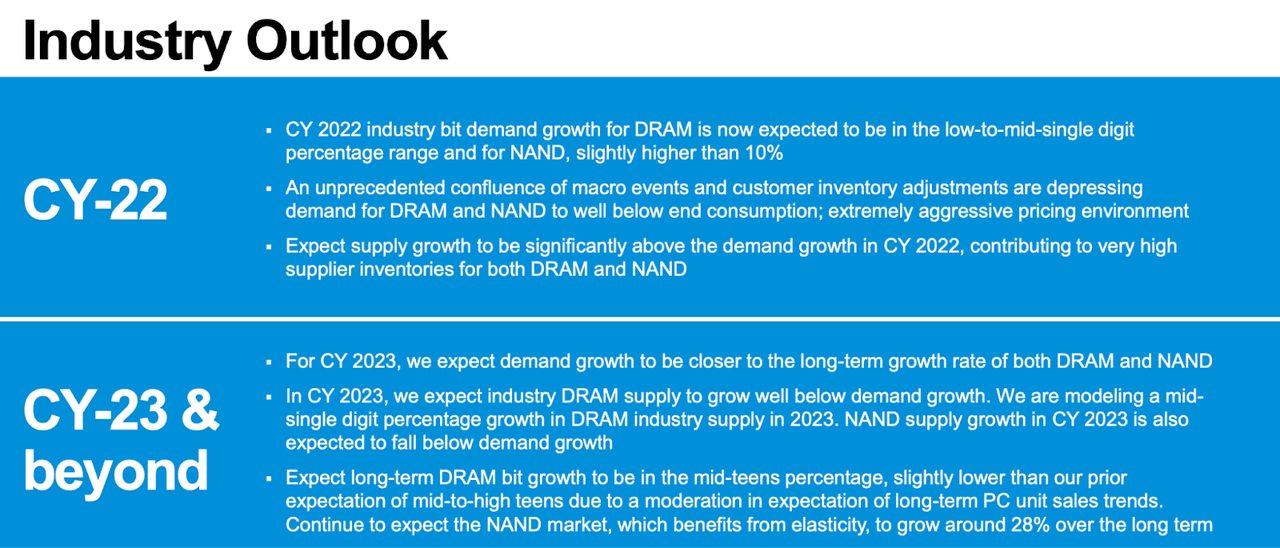
FY22 Q4 Presentation
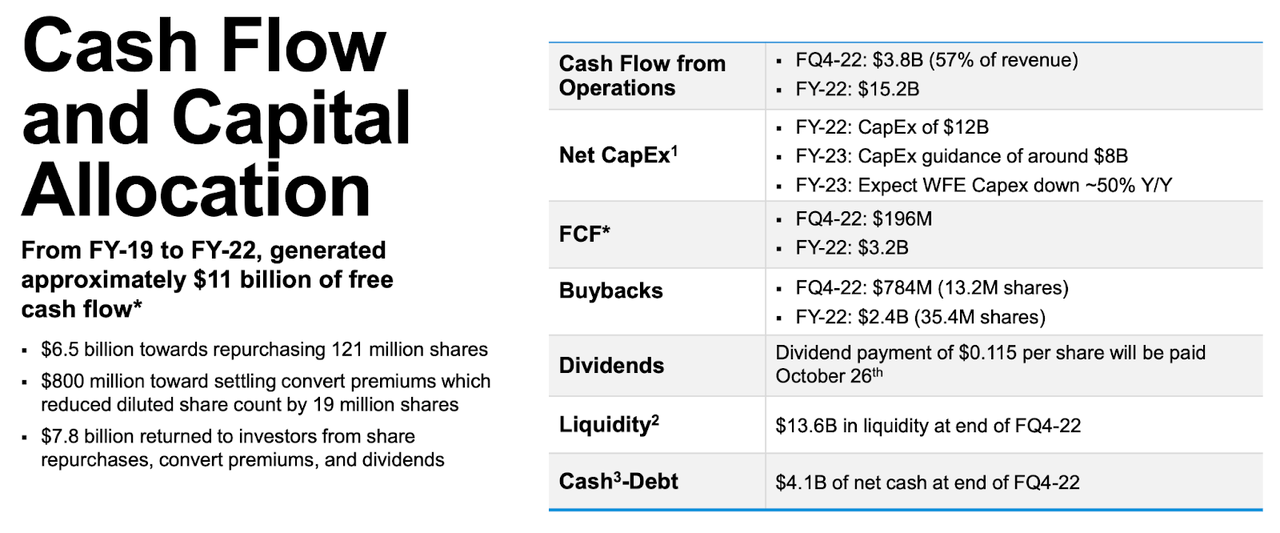
On the conference call, management guided for capital expenditures to decline 30% year over year as they do their part to reduce supply.
In the quarter, MU generated only $196 million of free cash flow (compare that to the $1.6 billion in non-GAAP net income) but still repurchased $784 million of stock. That led the net cash position to decline from $5 billion in the sequential quarter to $4.1 billion as of the end of the latest quarter.
FY22 Q4 Presentation
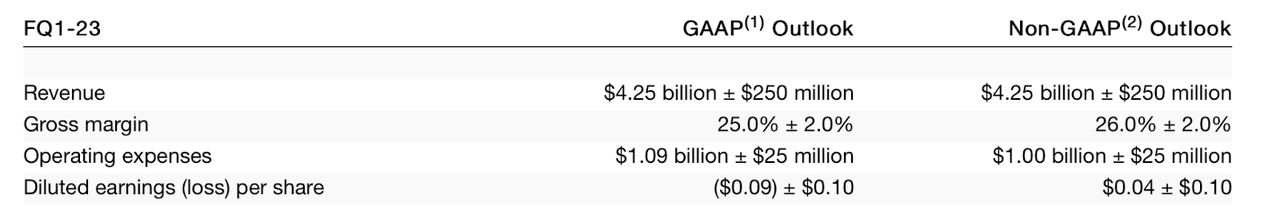
Looking ahead, MU guided for only $4.25 billion in revenue, with non-GAAP earnings expected to come in at $0.04 per share. For reference, MU generated $5.77 billion of revenue and $0.78 non-GAAP EPS in the prior year’s first quarter.
FY22 Q4 Presentation
Is MU Stock A Buy, Sell, or Hold?
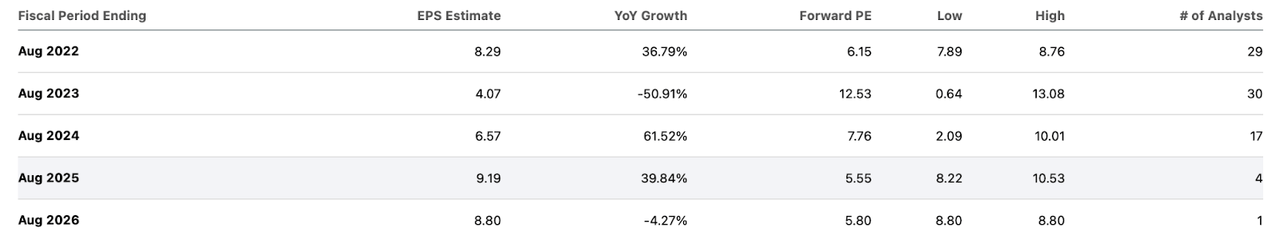
MU has long been a popular stock among retail investors due to its low earnings multiple. MU trades at around 6x trailing earnings but at 13x forward earnings due to the projected weakness. We can see below that earnings are not expected to move materially over the next four years.
Seeking Alpha
Revenue is expected to grow by just under 18% over that same time frame.
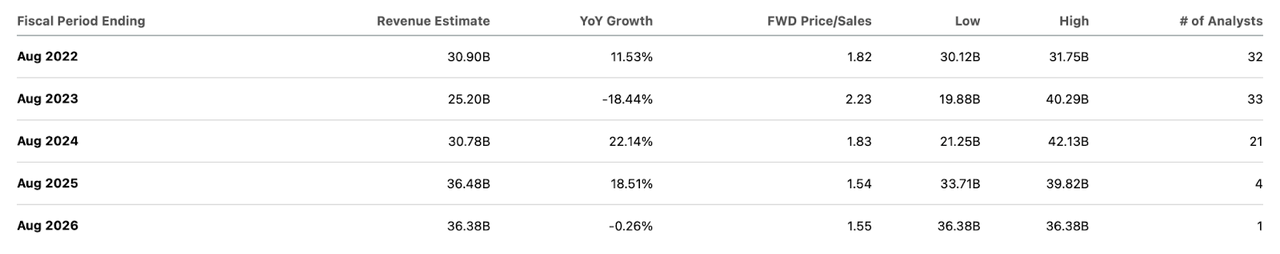
Seeking Alpha
Wall Street analysts appear to be expecting the commoditized nature of the memory chip market to lead to minimal top-line growth coupled with margin compression, explaining the lukewarm earnings projections.
Perhaps even more importantly, investors should focus more on free cash flow rather than earnings because depreciation and amortization historically dramatically trails capital expenditures. Free cash flow totaled just $3.2 billion this past fiscal year versus $9.5 billion in adjusted net income. Whereas MU trades at 6x trailing earnings, the stock trades at 18x trailing free cash flow. On a 4-year average basis, MU generates around $3.5 billion in annual free cash flow. In some years it might generate more than that – in others less. MU has not historically paid large special dividends like those you’d expect from cyclical stocks in other industries like the energy or shipping sectors, but that was mainly due to the company choosing to prioritize strengthening its balance sheet. With the company boasting over $4 billion in net cash, I do not expect a necessity for similar actions in the future, at least not to the same extent. That does mean that investors may be justified in hoping for special dividends in the next cyclical upswing, which may imply significant upside in a recovery. That said, my investing style aims to value stocks based on cross-cyclical fundamentals. I typically apply lower multiples to cyclical stocks due to their increased risk. I continue to target a 10x free cash flow multiple for MU before buying the stock – that implies a stock price of $33 per share, or 38% lower. Management did not sound like they intend to repurchase shares in the near term during the projected period of free cash flow weakness. In the absence of share buybacks, it is reasonable to expect that we will see lower prices in the near and medium term, especially considering the valuations of the broader tech sector. I rate shares a hold until the valuation proposition improves.
Be the first to comment