

Jae Young Ju/iStock via Getty Images
In recent days, Micron (MU) has been rocked by the resignation of its CFO David Zinsner. This is a significant headwind for the company, which I discuss in this article. But there are two tailwinds that came to light this past week that are also discussed. One is Samsung Electronics’ (OTC:SSNLF) Q4 earnings pre-announcement. The second is that I’ve learned that Samsung is moving some DRAM-allocated EUV lithography systems to its foundry. These two tailwinds are detailed in this article.
Headwind 1 – Departing CFO
Micron announced in a press release on Jan 20, 2022, that David Zinsner, executive vice president and chief financial officer, has resigned from the company. Zinsner started at Micron in February 2018 and is departing to join Intel Corporation (INTC) as its CFO.
I’ve been reading the comments to the announcement on Seeking Alpha and many investors remarked that the move was more or less a non-event. Clearly these readers underestimate the role of the CFO and the roll of Zinsner at Micron.
I suspect that many readers only interface with a CFO during earnings calls when he/she presents financial details of the past quarter as well as guidance. They also interface with the CFO’s printed works – Financial Statements, Earnings Presentations, and SEC Filings. In these examples, a CFO is more or less a numbers cruncher, and hence the move by Zinsner could be considered a non-event.
But tied in with the manipulation of financial data, a CFO works with the CEO and the board of directors in overseeing financial planning and balancing revenues and expenses. That means managing revenues and accounts receivables, balancing them with on outgoing payments and short-term and long-term liability. These data are balanced with budgets developed in collaboration with department heads.
A key role often overlooked by CFOs is a strategy of stock buybacks and dividends, and these are not “non-events” to the shareholder. And CFOs are instrumental during any merger and acquisition, where he/she works with the CEO to validate the profitability thesis of the deal and help evaluate the risks. A CFO directs and guides external advisers in the financial, tax diligence areas, and assumptions in pro forma financial statements. In addition, a CFO has to wear the hat of the CEO in understanding the business of a target company and then work to integrate the targeted business into the company. Finally, a CFO has to find the funding for the acquisition, whether by cash, stock, or even debt.
It’s the non-number crunching aspect of Zinsner where he excelled in order to be considered for the role of CFO at Micron in 2018. As the Senior VP and CFO at Analog Devices (NASDAQ:ADI), he managed the financial operations of the company including ADI’s acquisition strategy. His last acquisition at ADI was the purchase of Linear Technology for $15 billion. Prior to ADI, Zinsner was the Senior Vice President of Intersil Corporation and was part of the management team that, together with a private equity firm, purchased the assets from Harris Corporation and subsequently took the company public in 2000.
And let’s look at Zinsner’s role at MU since he replaced the retiring Ernie Maddock on Feb. 5, 2018, to mitigate the problems as the memory market crashed.
On Jan. 22, 2018, I wrote a Seeking Alpha article entitled “Samsung Electronics 2018 Capex Could Be Bad For Competitors, Great For Suppliers.” I warned:
- Samsung Electronics had a capex spend of $26 billion dollars in 2017 and is forecast to spend $24 billion in 2018, more than twice its competitors.
- High levels of capex spend will increase memory capacity and output, increasing supply and resulting in lower selling memory prices. The Capex spend by Samsung means that competitors MU, INTC, Western Digital (WDC), Toshiba, and SK Hynix (OTC:HXSCL) will need to up the ante in their own Capex spend, negatively impacting their earnings.
- So, a huge semiconductor Capex spend by Samsung Electronics will accentuate the drop in ASPs and stock prices by increasing supply, since I noted the correlation between memory ASPs and stock valuations in the above articles.
I had previously written a series of articles warning of a drop in MU stock price, and, as the most hated writer on Seeking Alpha, the article had 38 comments and 0 likes.
As we fast forward to the present time, I show that, indeed, ASPs started dropping. Chart 1 shows DRAM ASPs between CY Q1 2016 and Q3 2021. ASPs reached a peak in Q3 2018, two quarters after my much-hated article.
The Information Network
Chart 1
Table 1 shows the YoY change in DRAM capex by company between 2016 and 2020. Overall capex increased 45% in 2017 and 67% in 2018, coinciding with the increase in ASPs in Chart 1. DRAM companies drastically cut back in capex in 2019 and 2020 as the DRAM industry was in freefall and ASPs plummeted.
The Information Network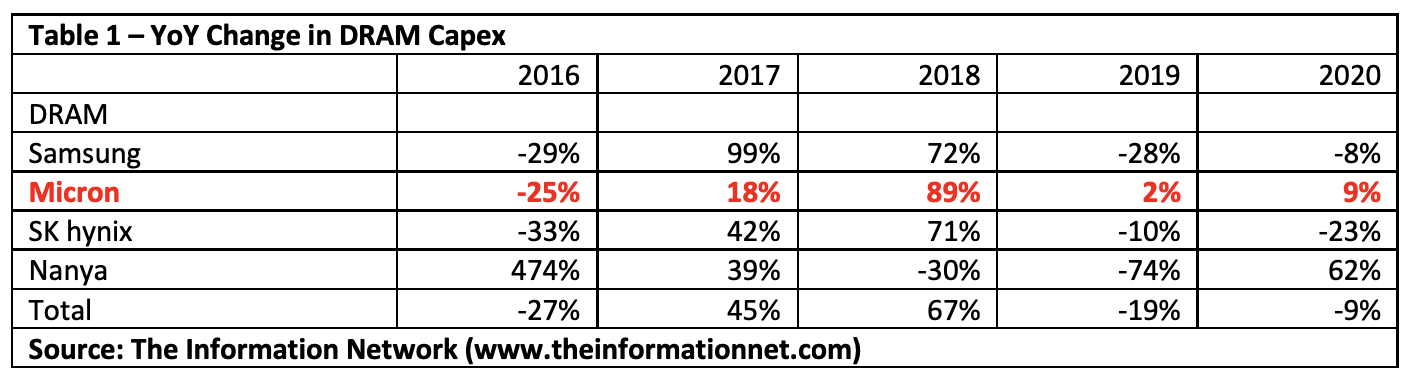
Chart 2 shows NAND ASPs between CY Q1 2016 and Q3 2021. ASPs reached a peak in Q3 2017, two quarters before my article.
The Information Network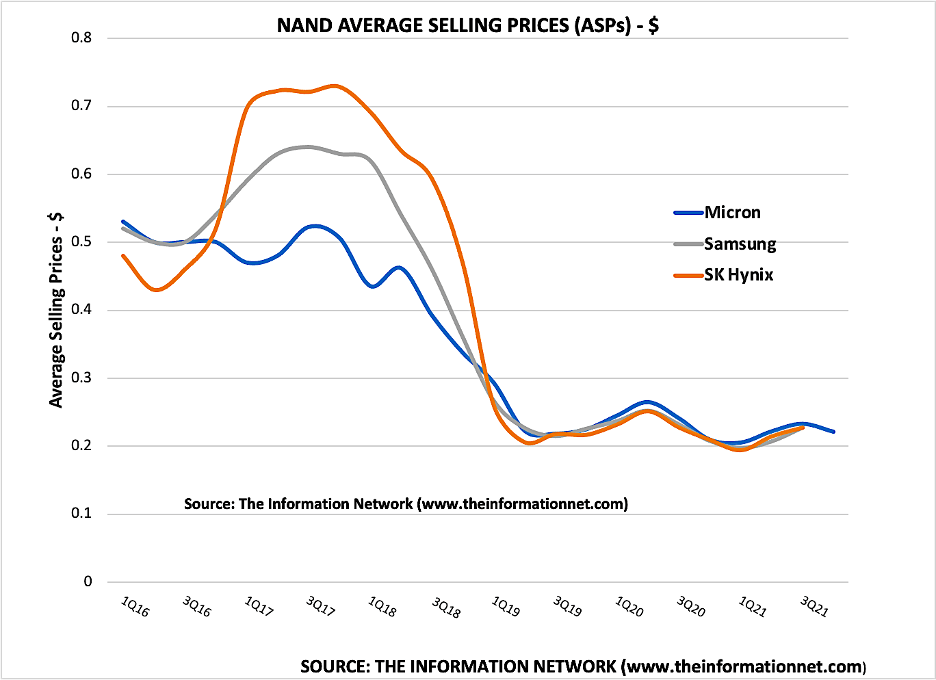
Chart 2
Table 2 shows the YoY change in NAND capex by company between 2016 and 2020. Overall capex increased 43% in 2016 and 63% in 2017, coinciding with the increase in ASPs in Chart 2. NAND companies drastically cut back in capex in 2018 and 2019 as the NAND industry was in freefall and ASPs plummeted.
The Information Network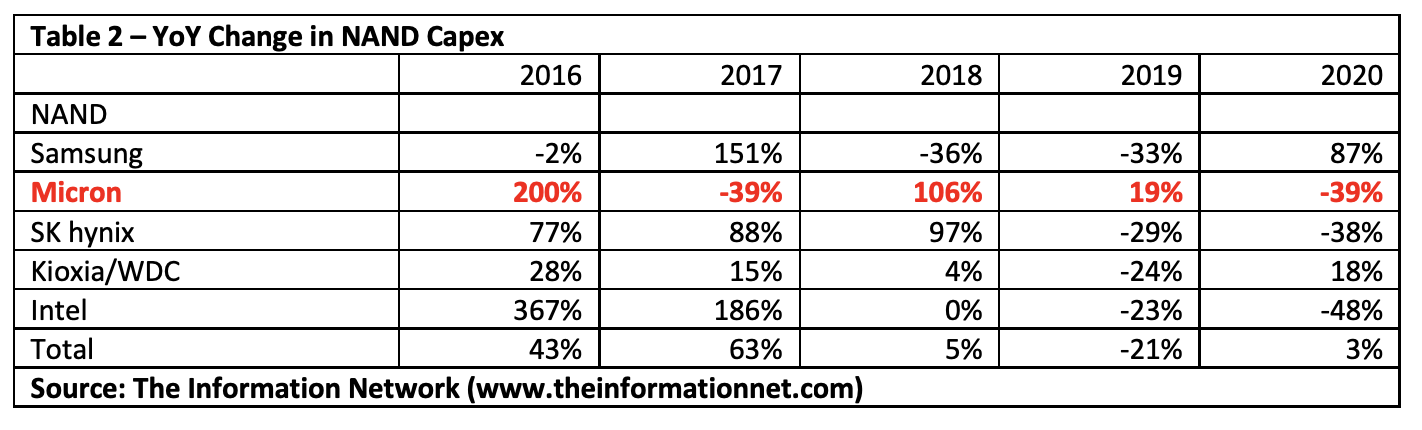
Chart 3 shows MU stock between 2016 and 2022. We can see the peak in stock in mid-2018 coinciding with the increase in ASPs. This shows that analysts and SA authors were wrong. Indeed, ASPs and stock price coincided with stock price on the way up and on the way down.
But these analysts and SA authors, many of which SA readers would genuflect at their name and couldn’t gloat enough about their articles, didn’t understand simple supply -demand dynamic – a fundamental economic principle. One of these SA authors, a strong proponent of anti-gravity, actually admitted a year later he had quietly sold MU.
YCharts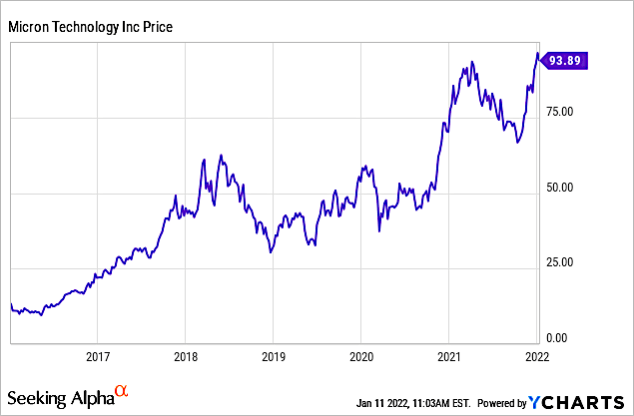
Chart 3
Chart 3 shows that MU stock is rising, not because of ASPs, but because of judicious capex spending, keeping supply-demand dynamics in tow. And this I attribute somewhat to MU’s CFO Zinsner. He read my articles, agreed with me, cut capex spend, and a year after joining MU, the stock has been on a tear.
Tailwind 1 – Samsung Preliminary Q4 Financials Favorable With Micron
Samsung Electronics provides preliminary financial data several weeks before its quarterly earning call. This is important because SSNLF is on a calendar year ending Dec. 31, which is one month ahead of Micron’s fiscal year ending Aug. 31. With Micron’s earnings call one month earlier than Samsung’s, this pre-announcement by Samsung provides competitive analysis of Micron’s results and guidance.
Bit Growth
For Micron in its last earnings call for the quarter ended Dec. 2, 2021, DRAM bit shipments declined in the mid-single-digit percentage range. This is comparable to Samsung’s reported mid-single digit percentage decline.
Micron’s NAND bit shipments were approximately flat, compared to Samsung’s low single-digit decline.
Revenue
Micron’s DRAM revenue declined 8% quarter over quarter and was up 38% year over year. This compares to Samsung’s DRAM revenue, which also declined 8% QoQ.
Micron’s NAND revenue declined 5% quarter over quarter and was up 19% year over year. This compares to Samsung’s NAND revenue, which declined 7% QoQ.
ASPs
Micron’s DRAM ASPs declined 2% QoQ, while Samsung’s NAND ASPs were flat QoQ.
Micron’s NAND ASPs declined 5% QoQ, while Samsung’s NAND ASPs declined 6% QoQ.
Table 3 shows that Micron’s recent quarterly metrics compare favorably with Samsung’s preannouncement data for Q4 2021. It also shows that DRAM memory is stable, unlike many analyst reports of a crash in DRAM prices (using spot ASPs) resulting in several downgrades of Micron.
The Information Network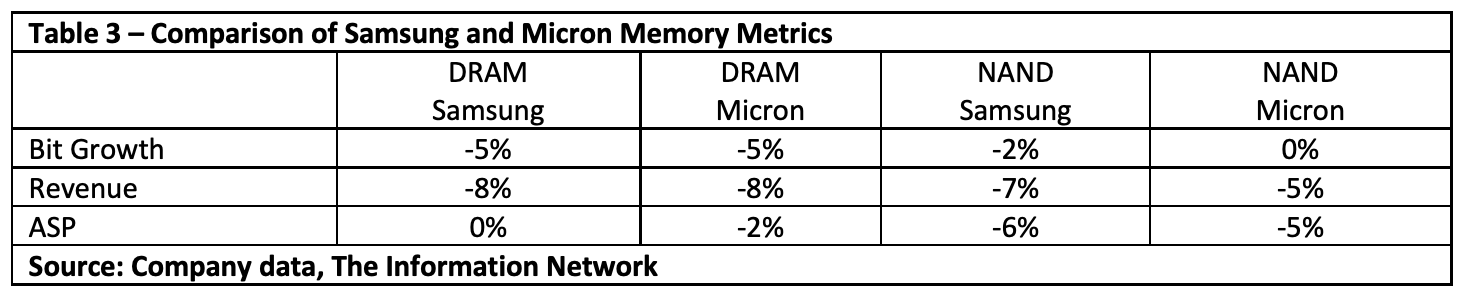
Tailwind 2 – Samsung Moving EUV Lithography System From DRAM To Foundry
Table 4 shows the DRAM roadmap of all DRAM products. In January 2021, Micron announced it was shipping memory chips built using the world’s most advanced DRAM process technology – the 1α nm process node – ahead of any competitors.
The Information Network
Micron opted to move to the 1α nm process node using DUV lithography. Samsung and SK Hynix, which introduced its 1z nm in 2Q 2020, opted to focus on EUV lithography. Micron, nevertheless, continues its evaluation of EUV for cost optimized insertion.
Importantly, Micron is planning for volume DRAM production on extreme ultraviolet (EUV) lithography in 2024 with its 1γ (1-gamma) node.
Chart 4 shows two important facts about EUV lithography, according to our report entitled “Sub 100nm Lithography: Market analysis and Strategic Issues.”
- DRAM performance increases > 20% from one node to the next according to ASML (ASML) utilizing EUV lithography. This represents a tailwind for Samsung and SK Hynix, particularly since Micron won’t introduce EUV for two more nodes until the 1γ in 2024.
- Logic/MPU performance increases ~30% per node. Samsung foundry has purchased numerous EUV systems for logic chip production. Details about Samsung’s attempt to become the world’s largest foundry can be found in my Jan. 11, 2022, Seeking Alpha article entitled “Taiwan Semiconductor: A Clear Winner At <7nm Nodes Vs. Samsung And Intel.”
ASML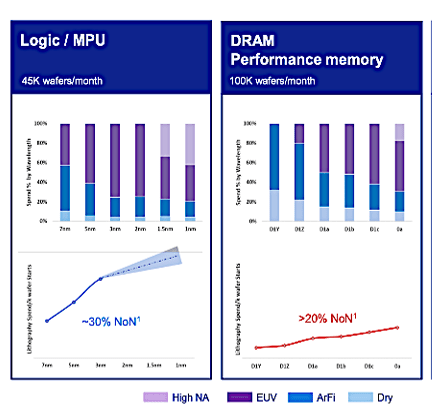
Chart 4
A fire that occurred inside a part of ASML’s factory in Berlin, Germany, on Jan. 3 has caused its EUV line to be put offline. According to my sources in Korea, because of concerns for longer lead times in securing EUV systems from ASML, Samsung is moving some of its DRAM-allotted EUV system to its Samsung foundry business.
Also from my understanding, Samsung has moved DRAM-allotted EUV systems to foundry in the past. I estimate backlog for EUV systems at 75 in Q2, up from 51 in Q1. The amount of conversion by Samsung from DRAM production depends on economic and performance benefits with DRAM EUV compared to that of logic EUV, and the benefits in Chart 4 are clear.
As a result of this conversion of production capacity, Micron stands to benefit. At its recent earnings call, Micron CEO Sanjay Mehrotra noted:
“Based on our assessment of the progress EUV has been making and aligned with our technology strategy and industry-leading DRAM scaling roadmap, we plan to insert EUV into our DRAM roadmap starting in the 2024 timeframe.”
Investor Takeaway
The loss of CFO David Zinsner is a real headwind for Micron. Reading between the lines, I wonder whether his resignation had some nefarious undercurrents. For example, as reported in a SA News blurb:
In a statement, Micron Chief Executive Sanjay Mehrotra said that even with Zinsner’s departure, “Micron’s strong financial position is the result of the transformation we have driven,” and that the company is in a position for “continued growth” this year.
I didn’t read eulogy in Mehrotra’s statement, about his performance and how he would be missed. He merely said MU will continue.
On the other hand, Intel’s Gelsinger was confirmatory. Gelsinger called Zinsner “a proven finance leader, who brings a unique combination of strategic thought, deep knowledge of semiconductors and manufacturing, capital allocation discipline, and a track record of value creation for shareholders.”
Citi analyst Christopher Danely was equally complimentary, saying that Zinsner has improved operating margins by roughly 10% at each public company and when combined with Pat Gelsinger, Intel has one of the best semiconductor leadership teams as the company executes its turnaround story.
Fortunately for Micron, Mohentra is correct, and the company IS in a position for “continued growth” this year. Samsung, the leader in both NAND and DRAM, gave preliminary Q4 financials and in NAND metrics, Micron outperformed Samsung, and was essentially even with DRAM, as shown in Table 3. Micron continues to have a dominant share position in automotive DRAM and NAND with an estimated 50% market share. During its F1Q22 earnings call, Mohentra noted:
“New EVs are becoming like a data center on wheels, and we are already seeing examples of 2022-model-year EVs supporting level 3 autonomous capability with over 140GB of DRAM and also examples with over 1TB of NAND. In addition to continued content growth, we expect CY22 auto unit production to increase as non- memory component shortages ease. We entered into a new supply agreement with UMC to improve our ability to support our automotive customers with NAND solutions as market demand strengthens in CY22.”
Samsung’s movement of EUV from DRAM to foundry utilization can also be a confirmation that Micron is right in waiting for its 1γ nm DUV. The comparable DRAM metrics in Table 3 suggests that the benefits of EUV at this point in time are mute.
Chart 5 shows Micron’s stock price, illustrating continuing improvement in Micron’s stock performance as the memory industry recovers.
YCharts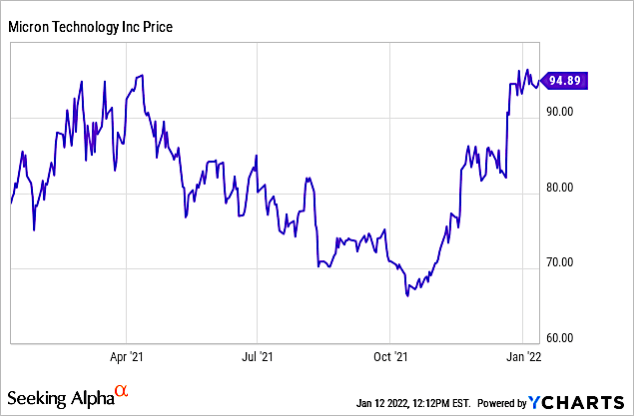
Chart 5
Chart 6 shows that in the past one-year period, Micron’s EPS Diluted (“TTM”) more than doubled to 6.48.
YCharts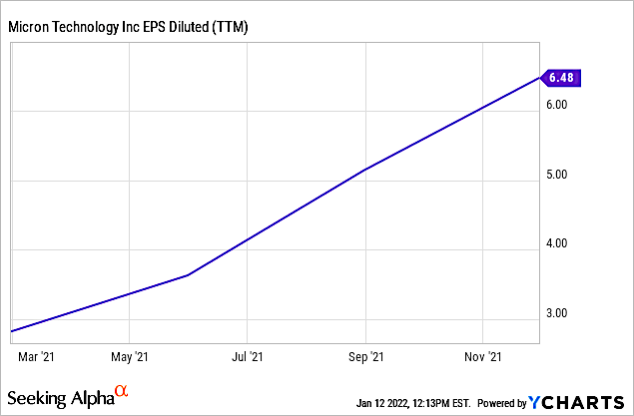
Chart 6
Chart 7 shows Micron’s Gross Profit Margin is now at 41.37%, an increase of 35% in the past year.
YCharts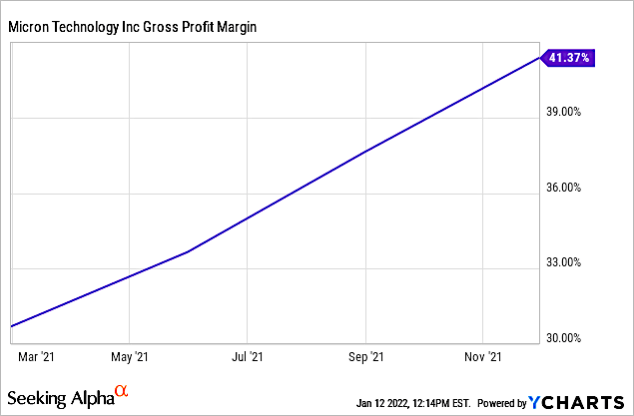
Chart 7
Micron has the potential for continued growth, and is my top semiconductor pick again this year. Ideally the loss of CFO Zinsner will not impact the momentum Micron has enjoyed as the memory industry recovery continues.
Be the first to comment