

Davel5957/iStock Unreleased via Getty Images
By Jill Mislinski
The November Preliminary Report came in at 54.7, down 5.2 (8.7%) from the October Final. Investing.com had forecast 59.9. Since its beginning in 1978, consumer sentiment is 36 percent below the average reading (arithmetic mean) and 35.2 percent below the geometric mean.
Surveys of Consumers chief economist, Richard Curtin, makes the following comments:
Consumer sentiment fell about 9% below October, erasing about half of the gains that had been recorded since the historic low in June. All components of the index declined from last month, but buying conditions for durables, which had markedly improved last month, decreased most sharply in November, falling back 21% on the basis of high interest rates as well as continued high prices. Overall, declines in sentiment were observed across the distribution of age, education, income, geography, and political affiliation, showing that the recent improvements in sentiment were tentative. Instability in sentiment is likely to continue, a reflection of uncertainty over both global factors and the eventual outcomes of the election.
Inflation expectations are little changed. The median expected year-ahead inflation rate was 5.1%, up from 5.0% last month. Long run inflation expectations, currently at 3.0%, have remained in the narrow (albeit elevated) 2.9-3.1% range for 15 of the last 16 months. [More…]
See the chart below for a long-term perspective on this widely watched indicator. Recessions and real GDP are included to help us evaluate the correlation between the Michigan Consumer Sentiment Index and the broader economy.
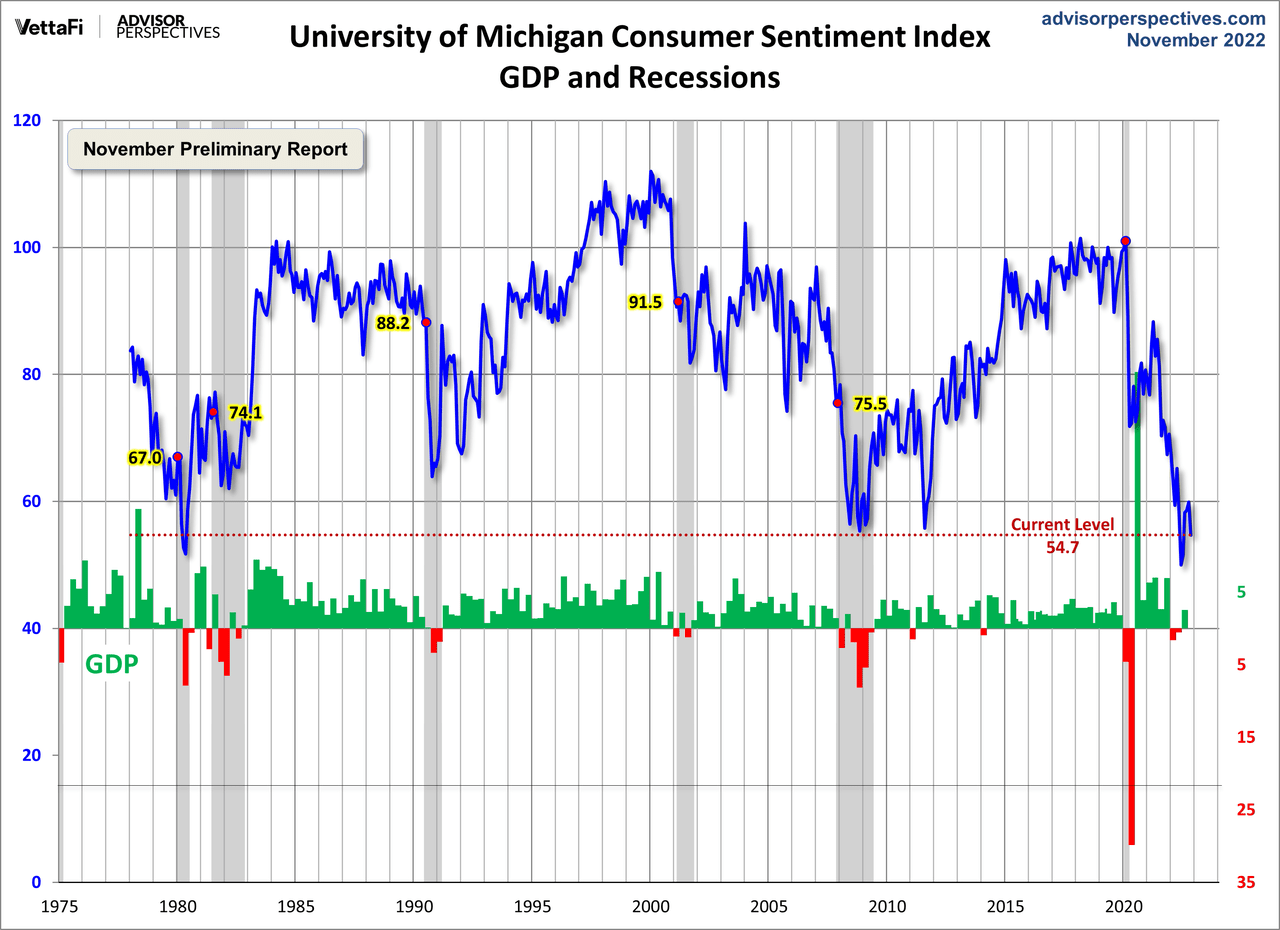
To put today’s report into the larger historical context since its beginning in 1978, consumer sentiment is 36 percent below the average reading (arithmetic mean) and 35.2 percent below the geometric mean. The current index level is not quite at the 1st percentile of the 539 monthly data points in this series.
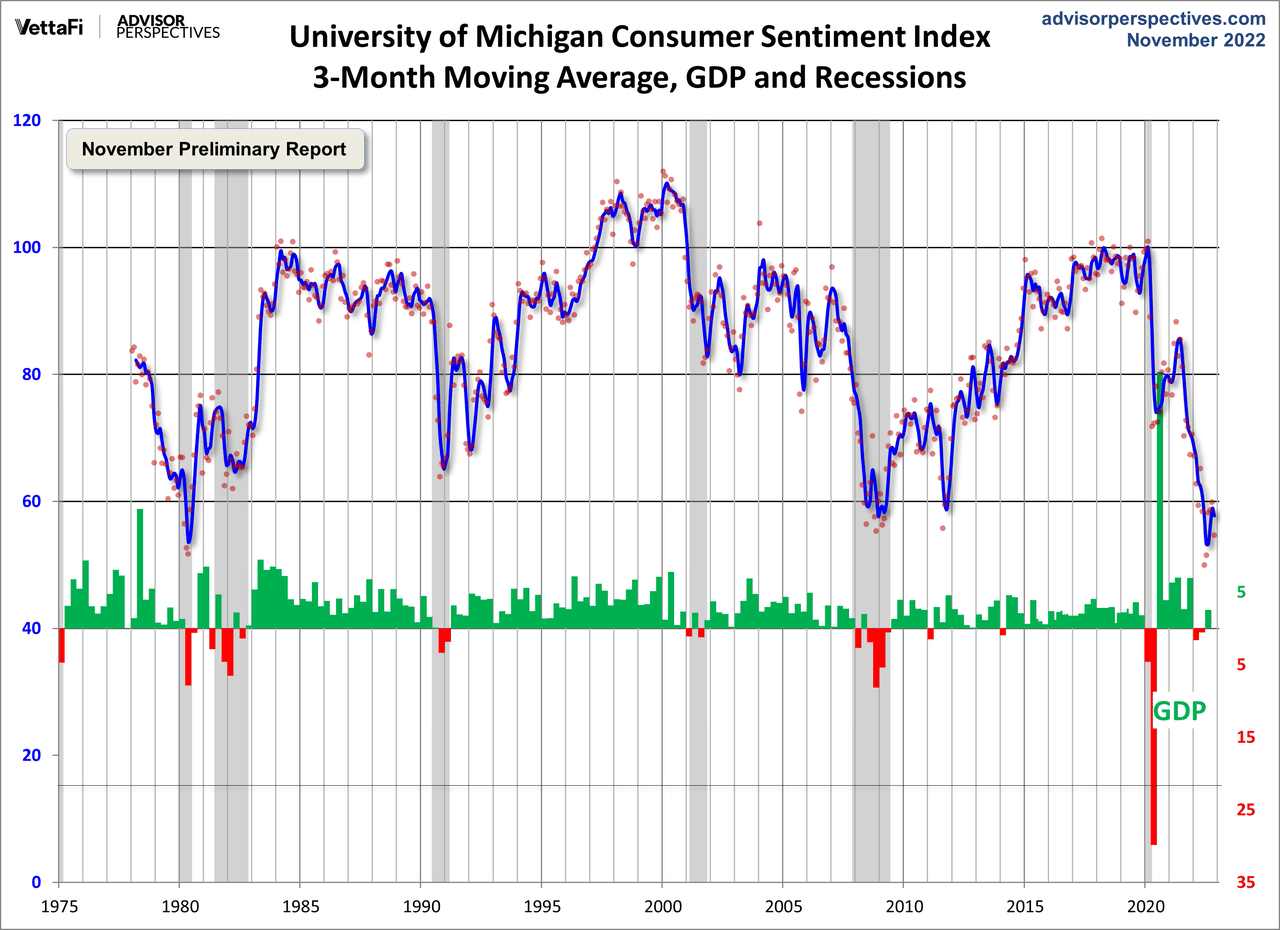
Note that this indicator is somewhat volatile, with a 3.0 point absolute average monthly change. The latest data point saw a 5.2 point increase from the previous month. For a visual sense of the volatility, here is a chart with the monthly data and a three-month moving average.
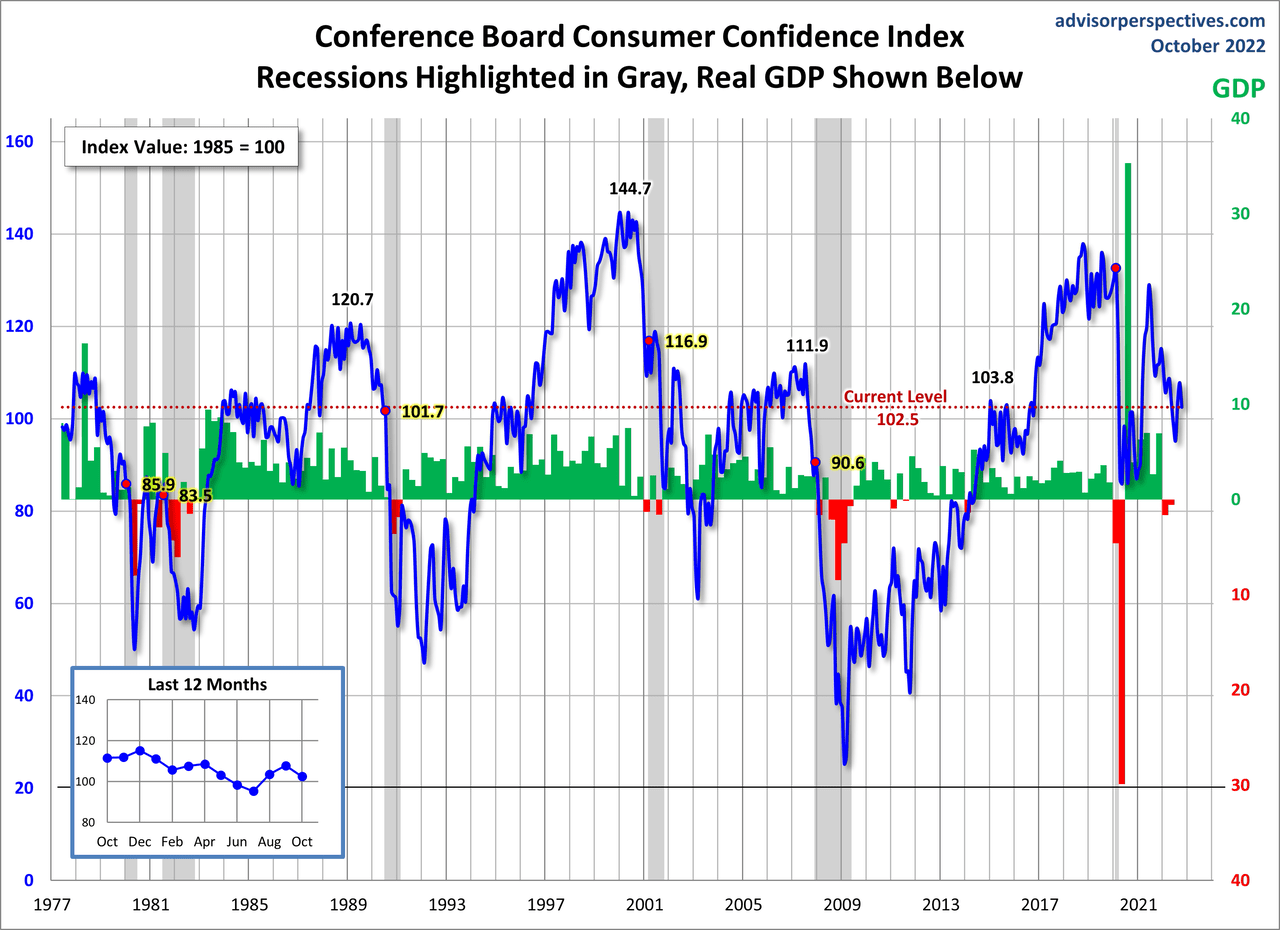
For the sake of comparison, here is a chart of the Conference Board’s Consumer Confidence Index (monthly update here). The Conference Board Index is the more volatile of the two, but the broad pattern and general trends have been remarkably similar to the Michigan Index.
And finally, the prevailing mood of the Michigan survey is also similar to the mood of small business owners, as captured by the NFIB Business Optimism Index (monthly update here). 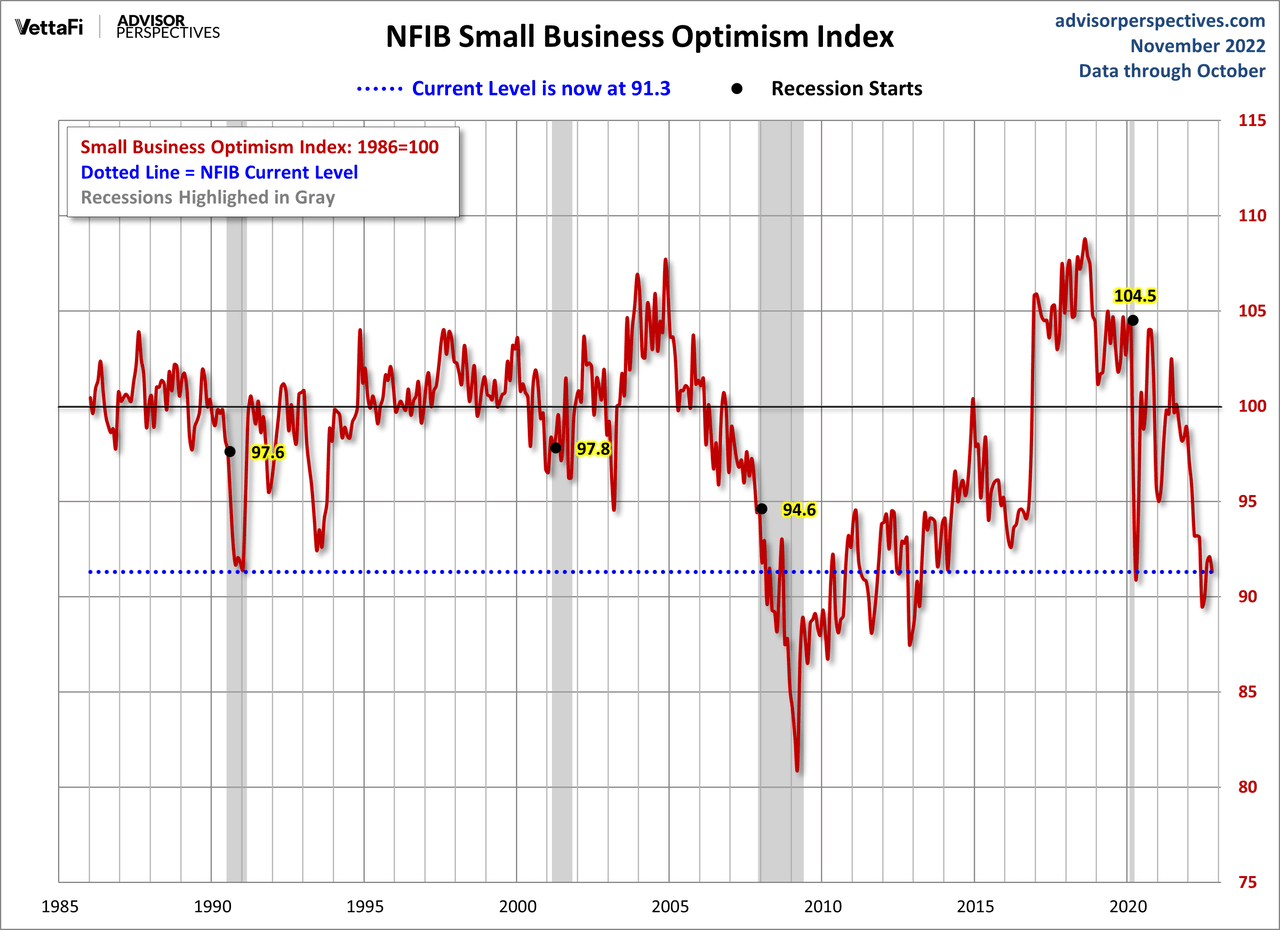
Editor’s Note: The summary bullets for this article were chosen by Seeking Alpha editors.
Be the first to comment