

braverabbit/iStock via Getty Images
Thesis
I last wrote about the Vanguard Mega Cap Growth ETF (NYSEARCA:MGK) back in July 2021. At that time, my thesis was that:
MGK is toward the most overvalued end of the various market sectors, both in absolute and relative terms. Its absolute PE was ~38x, among the most expensive. In relative terms, it also displays substantial overvaluation both in terms of its dividend Z-score and technical Z-score. Both dividend Z-score and technical Z-score are near or above 3, in the so-call 3-sigma regime.
Indeed, the fund has lost more than 16% since then, about 10% more than the overall market’s loss of 5.8%. such a sizable correction has also brought its valuation to a more reasonable level of ~29x. However, despite such a sizable correction, the fund still faces significant valuation risks ahead, especially when compared to the overall market and risk-free rates, as discussed immediately below.
Seeking Alpha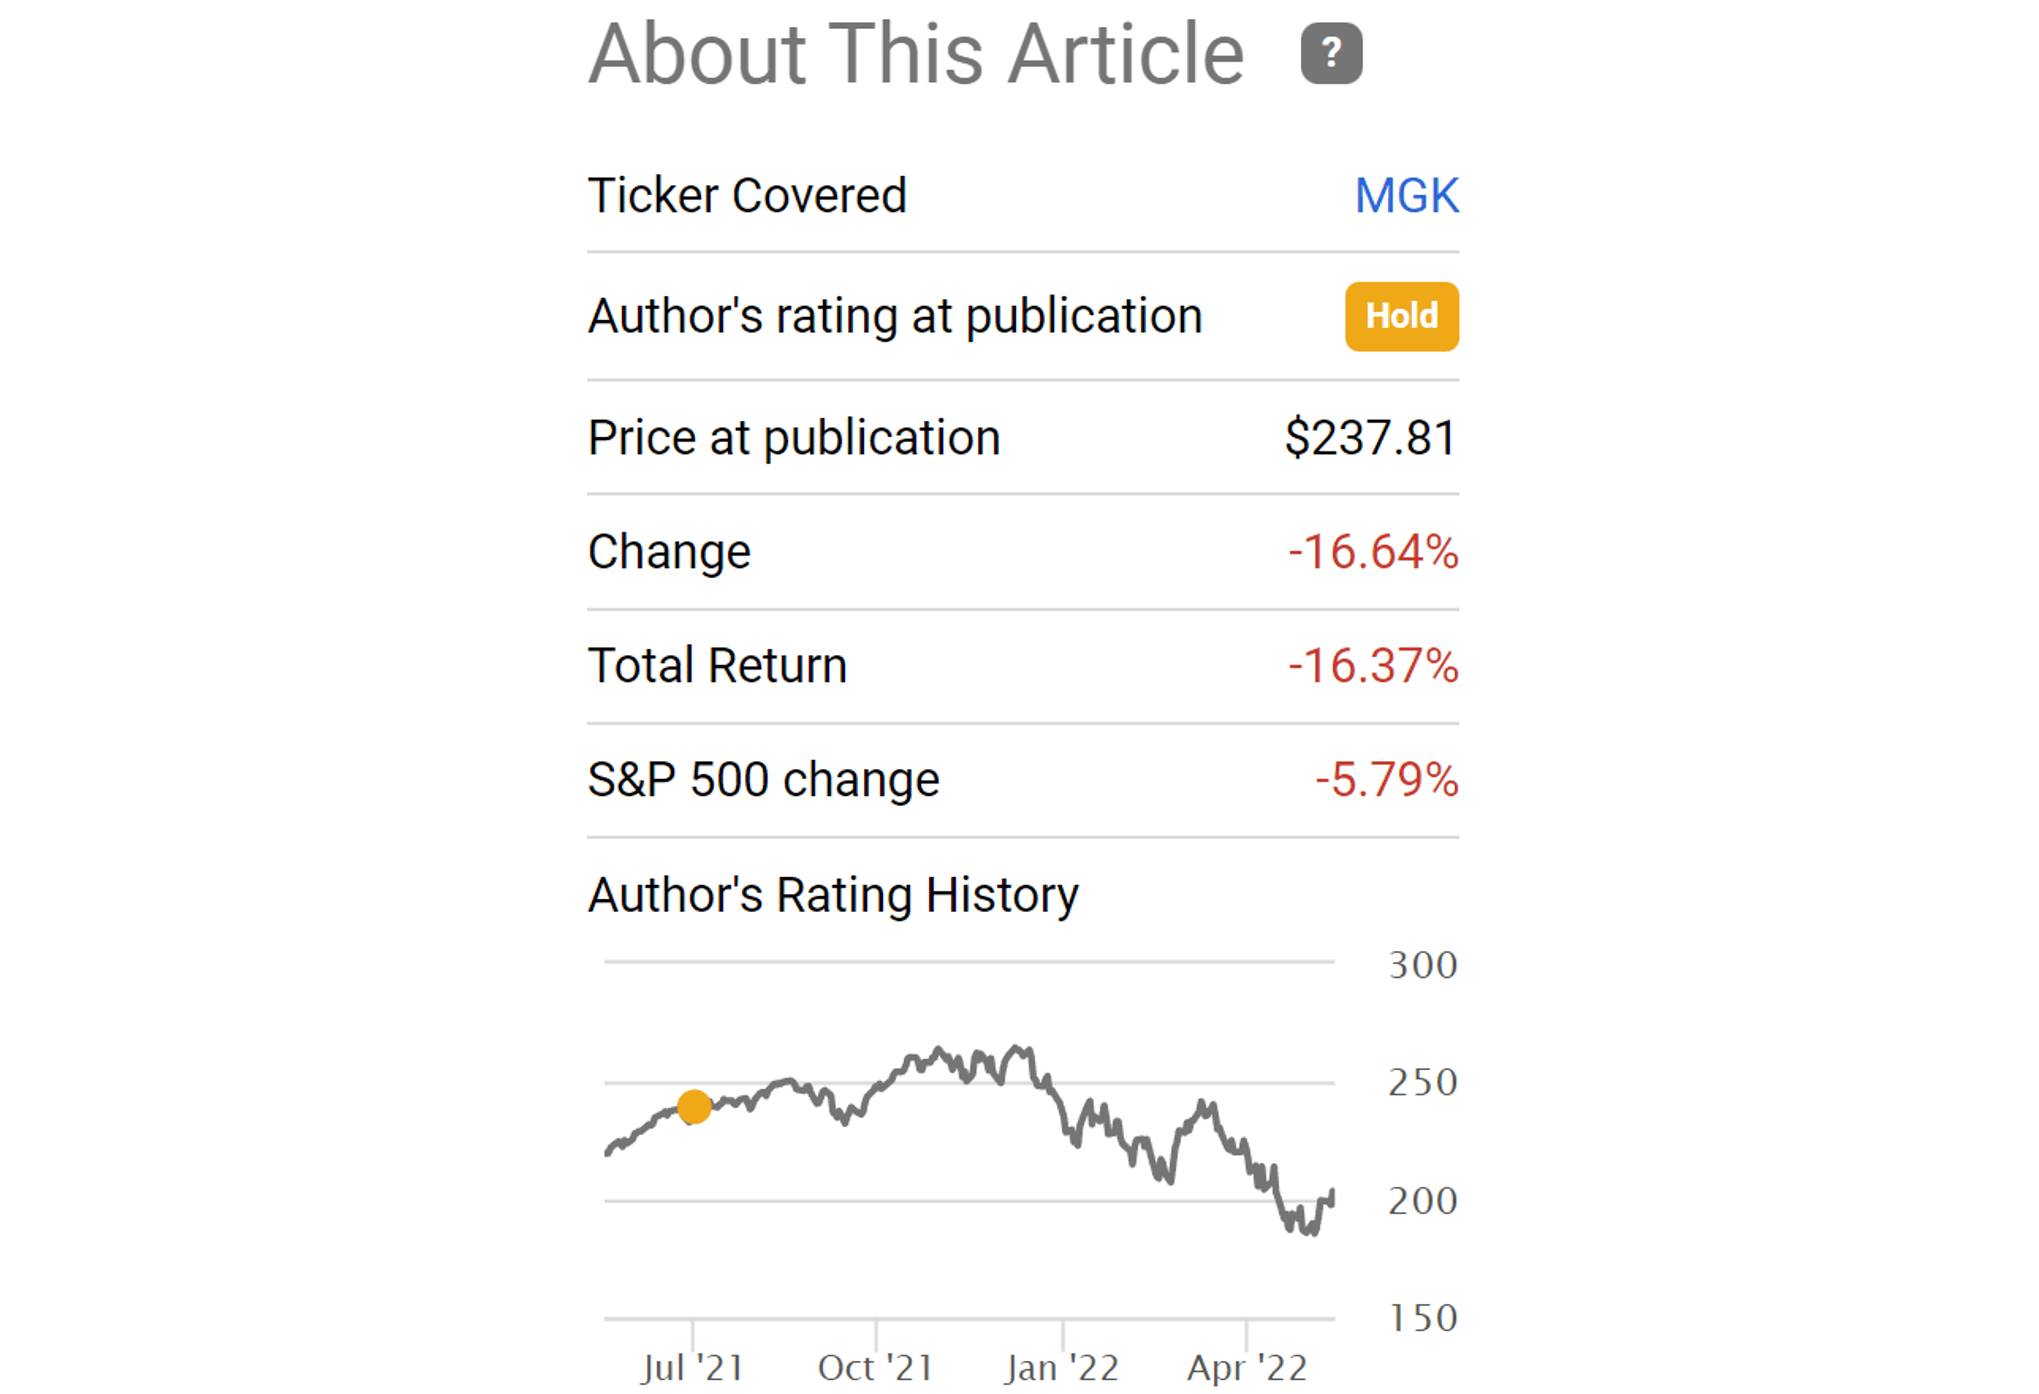
Concentration risks and valuation risks
MGK faces substantial concentration and valuation risks ahead due to its indexing method. The fund seeks growth companies in the large-cap space based on the following indexing method,
MGK provides focused exposure to the largest growth companies in the US. It selects companies exhibiting six growth characteristics: future long-term growth in earnings per share (“EPS”), future short-term growth in EPS, three-year historical growth in EPS, three-year historical growth in sales per share, current investment-to-assets ratio, and return on assets. Securities are scored and ranked based on the composite of these six growth factors.
Because of this particular indexing method, the fund is even more top-heavy than the overall market represented by the S&P 500 index. For example, it holds a total of 106 companies, compared to about 500 from the S&P 500 index. Its top ten holdings represent almost 60% of its total assets, more than 2x that of the 27% represented by the top 10 holdings in the S&P 500 index.
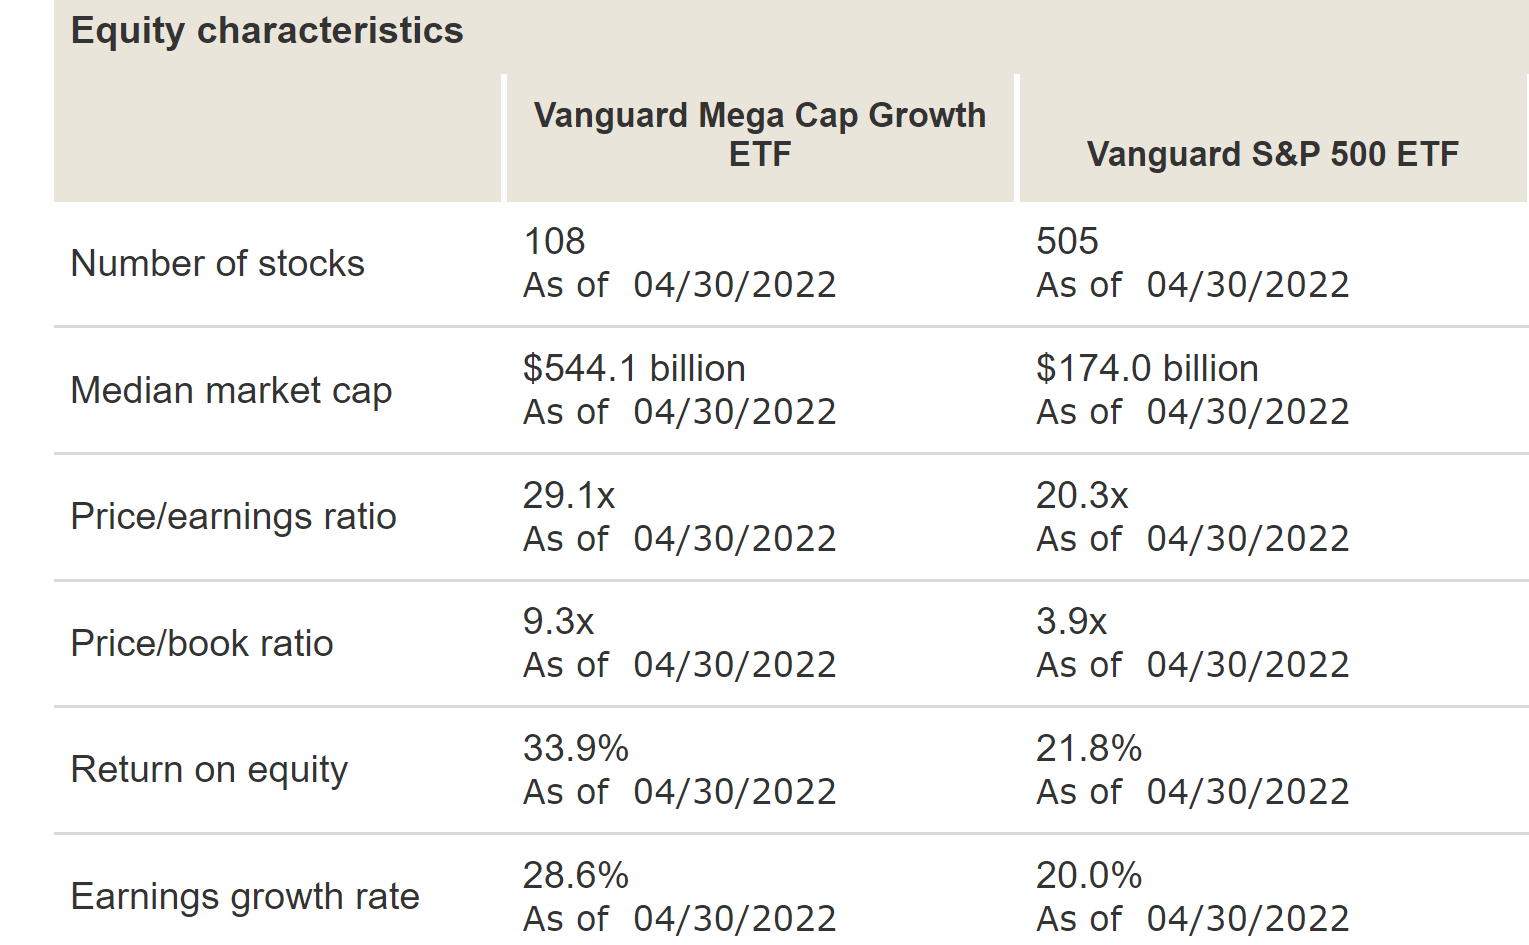
Due to its focus on growth, the fund is also at a substantial valuation premium compared to the S&P 500 index as you can see from the second chart. The fund is currently valued at a 29.1x price/earnings ratio. Compared to a PE ratio of 20.3x for the S&P 500, the fund is valued at a premium of about 45%.
Of course, the companies in this fund enjoy higher profitability. As measured by return on equity, MGK’s ROE is about 34%, compared to about 21.8% for the SP500. At the same time, companies in this fund are also projected to grow their EPS faster than the SP500. The projected EPS growth rate is 28.6% for MGK, compared to a 20% growth rate projection for S&P 500.
However, my overall view is that A) such growth projections are too optimistic both for MGK and also for the overall economy, and B) that the profitability superiority is insufficient to justify the 45% valuation premium.
Source:ETF.com Source: Vanguard Group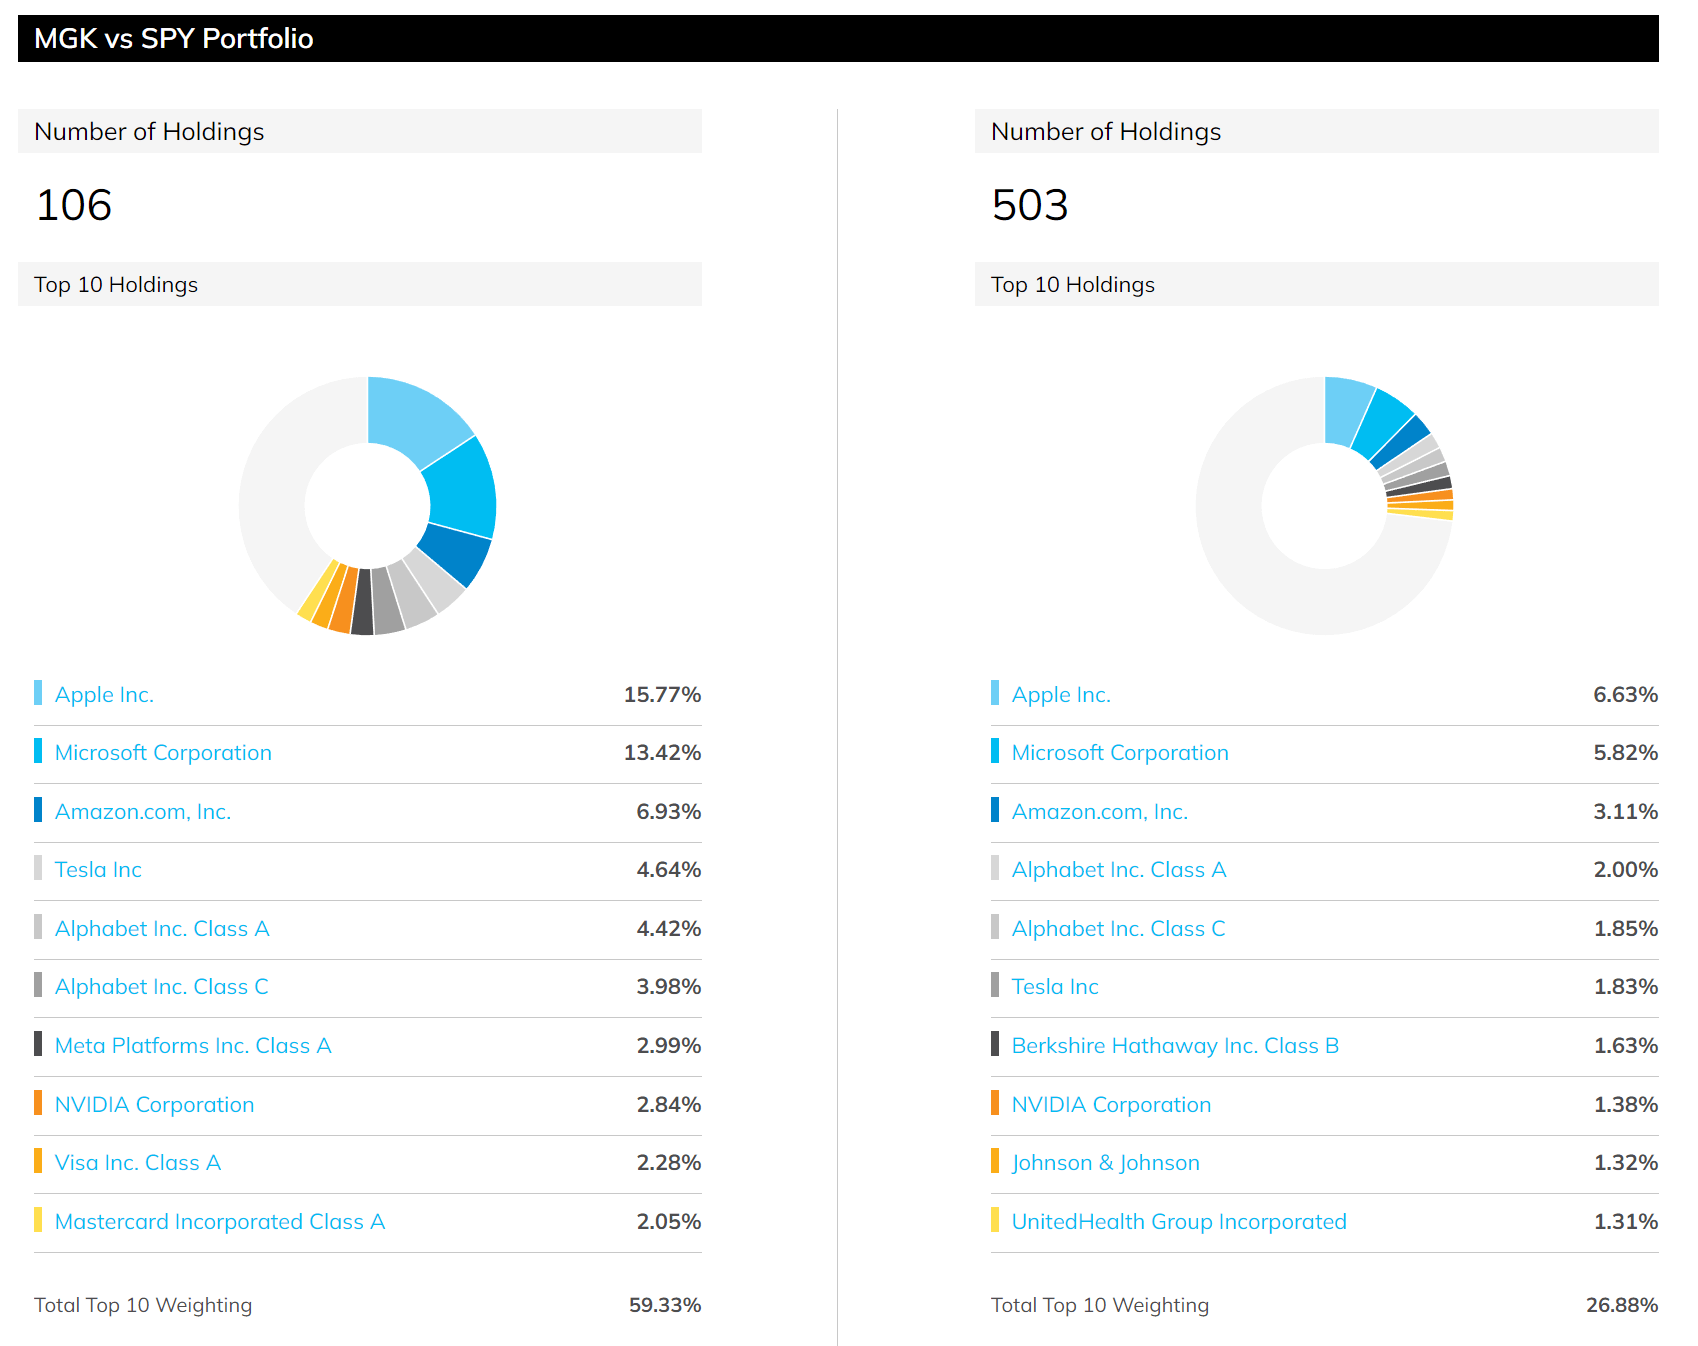
Yield spread at thinnest level in a decade
The valuation risks of MGK are even higher when judged by the yield spread relative to the risk-free treasury rates.
As detailed in our earlier writings,
For bond-like equity funds such as RYLD and QYLD that pay regular dividends, a major indicator I rely on (and fortunately with good success so far) has been the yield spread, i.e., the dividend yield minus the 10-year treasury bond yield. The spread also provides a measurement of the risk premium investors are paying. A large spread provides a higher margin of safety, and vice versa, therefore serving as a market timing indicator.
The following chart shows the yield spread between MGK against the 10-year treasury. As you can see, its yield spread has been range-bound since its inception in 2011. The yield spread has been fluctuating within a stable range between 0% to -2.0% most of the time. The current yield spread is at a negative 2.3%, not only the thinnest level since its inception but also thinner than its normal range of random fluctuations.
Author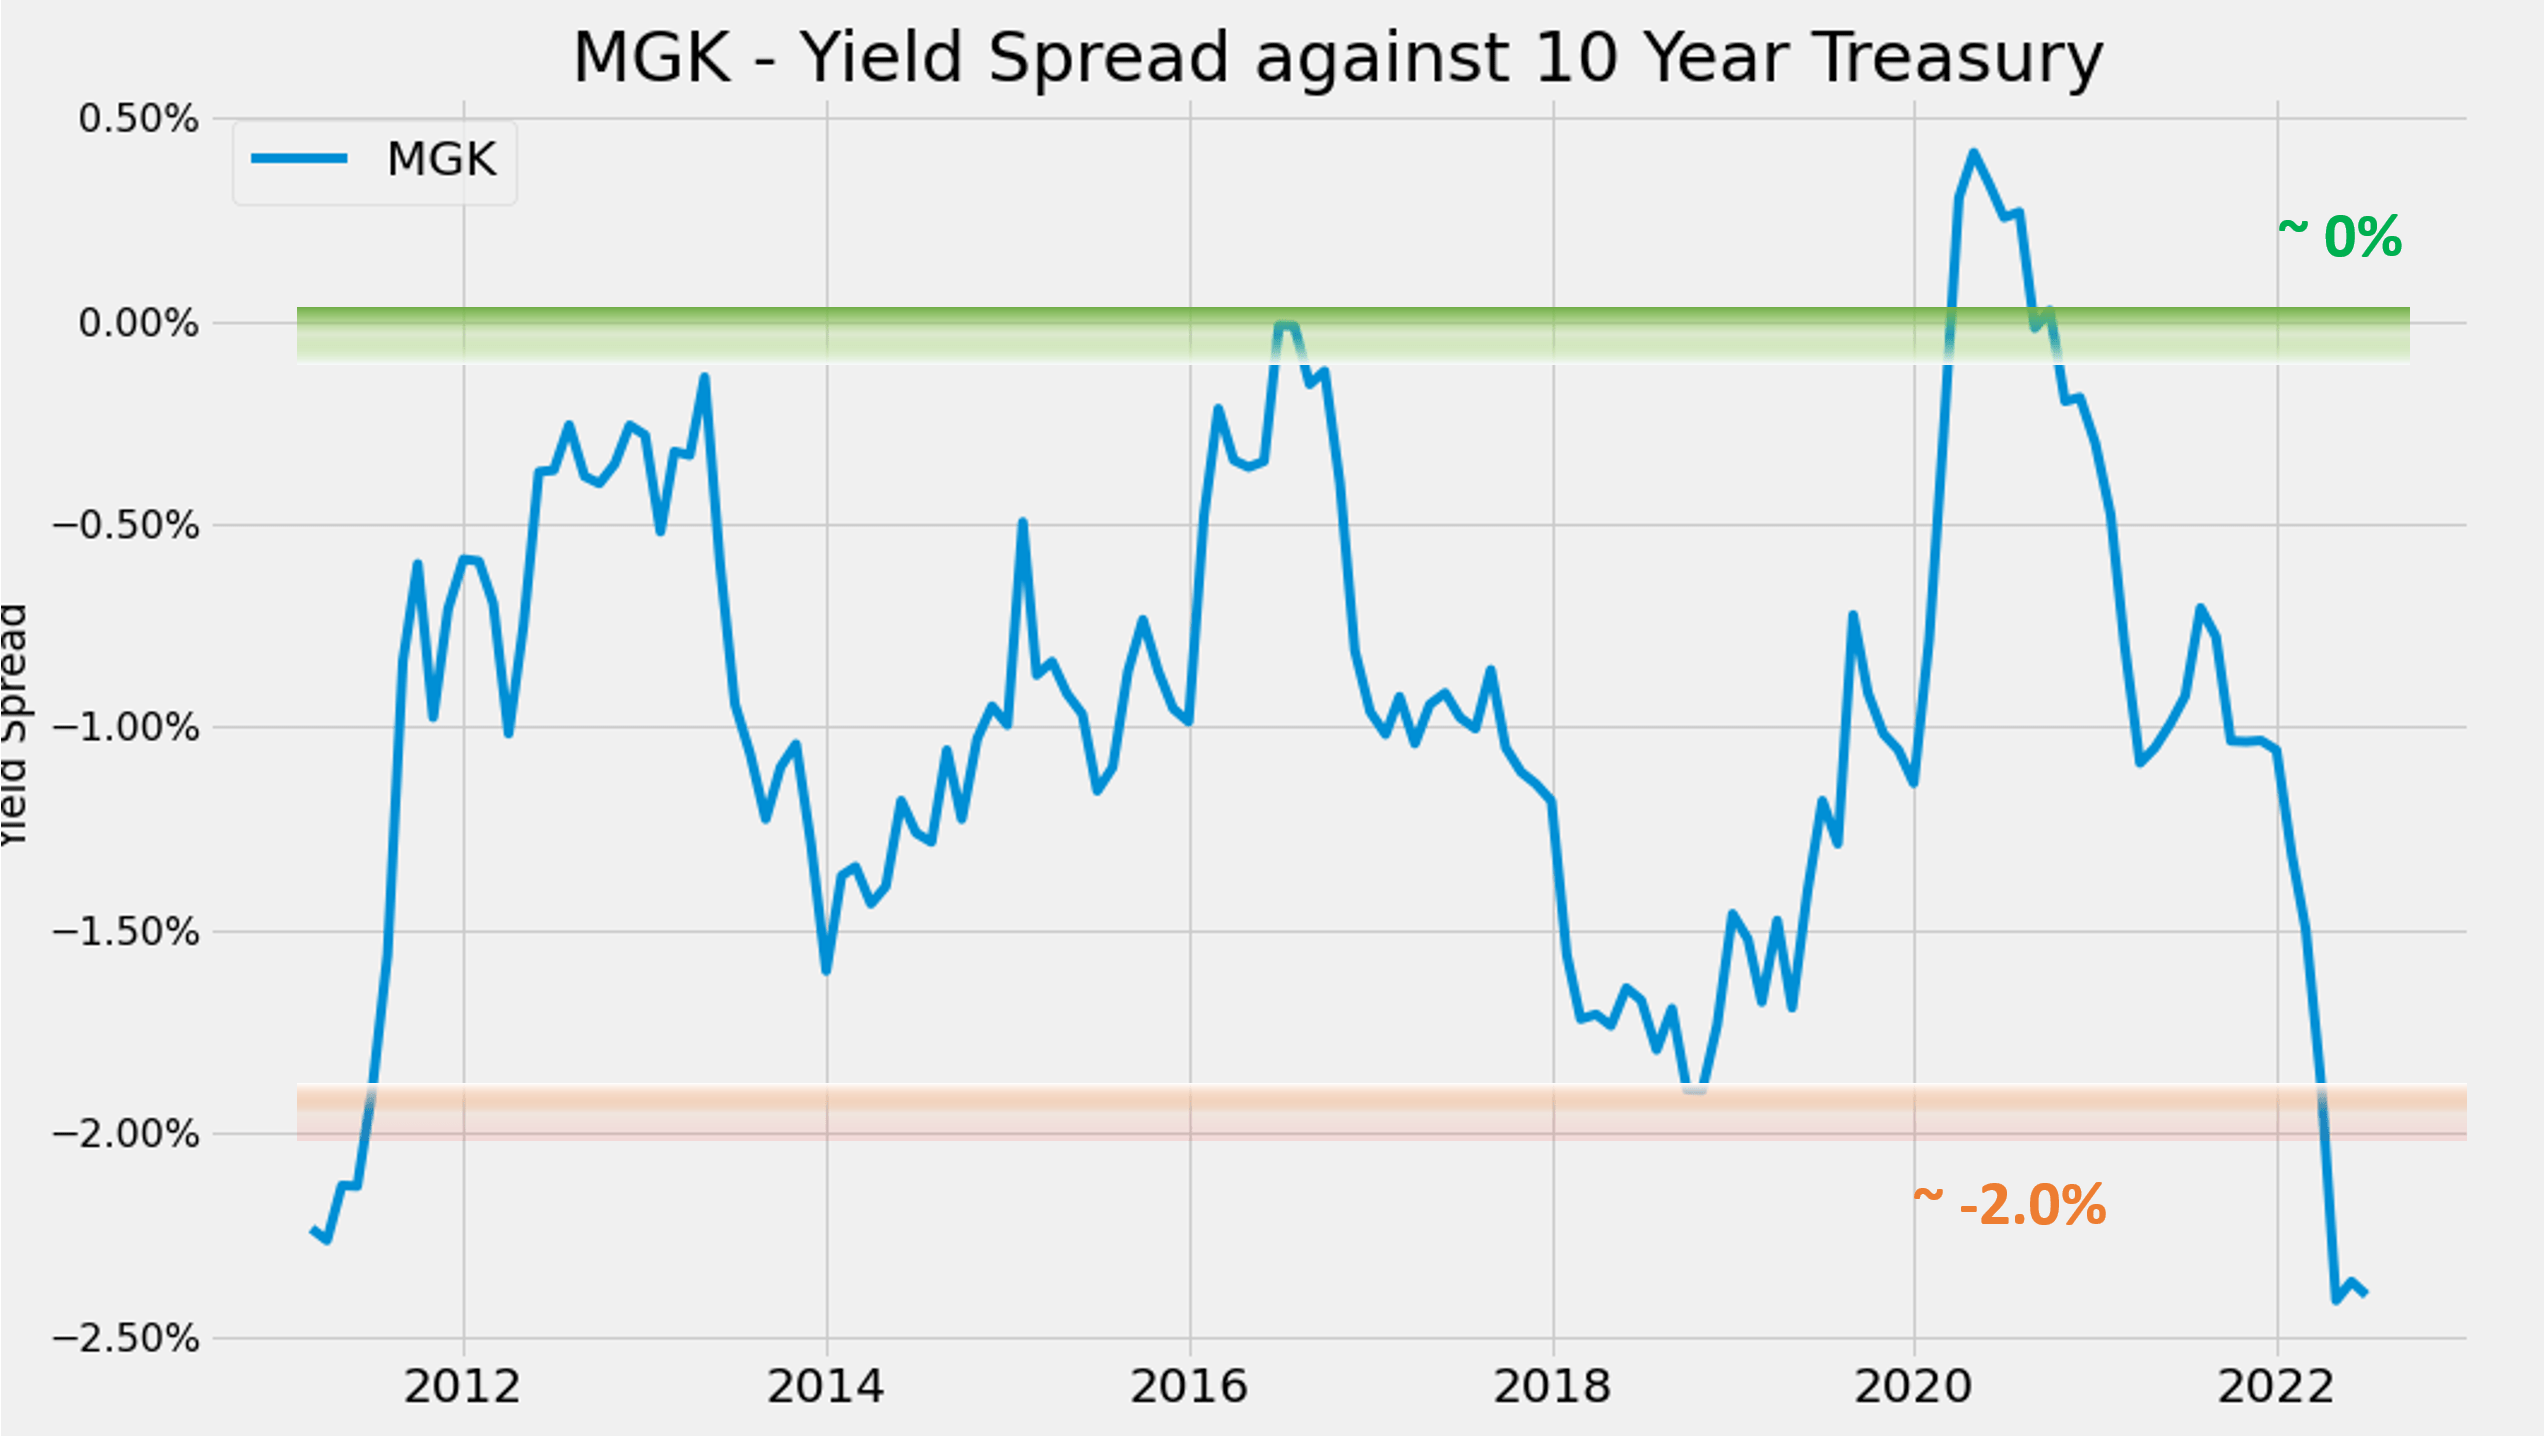
Such a thin level of yield spread signals substantial valuation risks ahead because short-term returns are closely correlated with the yield spread for funds that pay regular dividends. The next chart shows the 1-year total return on MGK (including price appreciation and dividend) regressed on yield spreads. There is a clear positive correlation, and the Pearson correlation coefficient is 0.49. Particularly as shown in the orange box, when the spread is near the upper range of about 0.0% or higher as mentioned above, the total returns in the next year have been all positive and very large (all above 10% and ranges up to ~50%+).
Currently, the yield spread is at -2.42%, a record thin level. And as historical data suggest, such a level signals substantial valuations risks ahead and is very susceptible to further rate uncertainties.
Author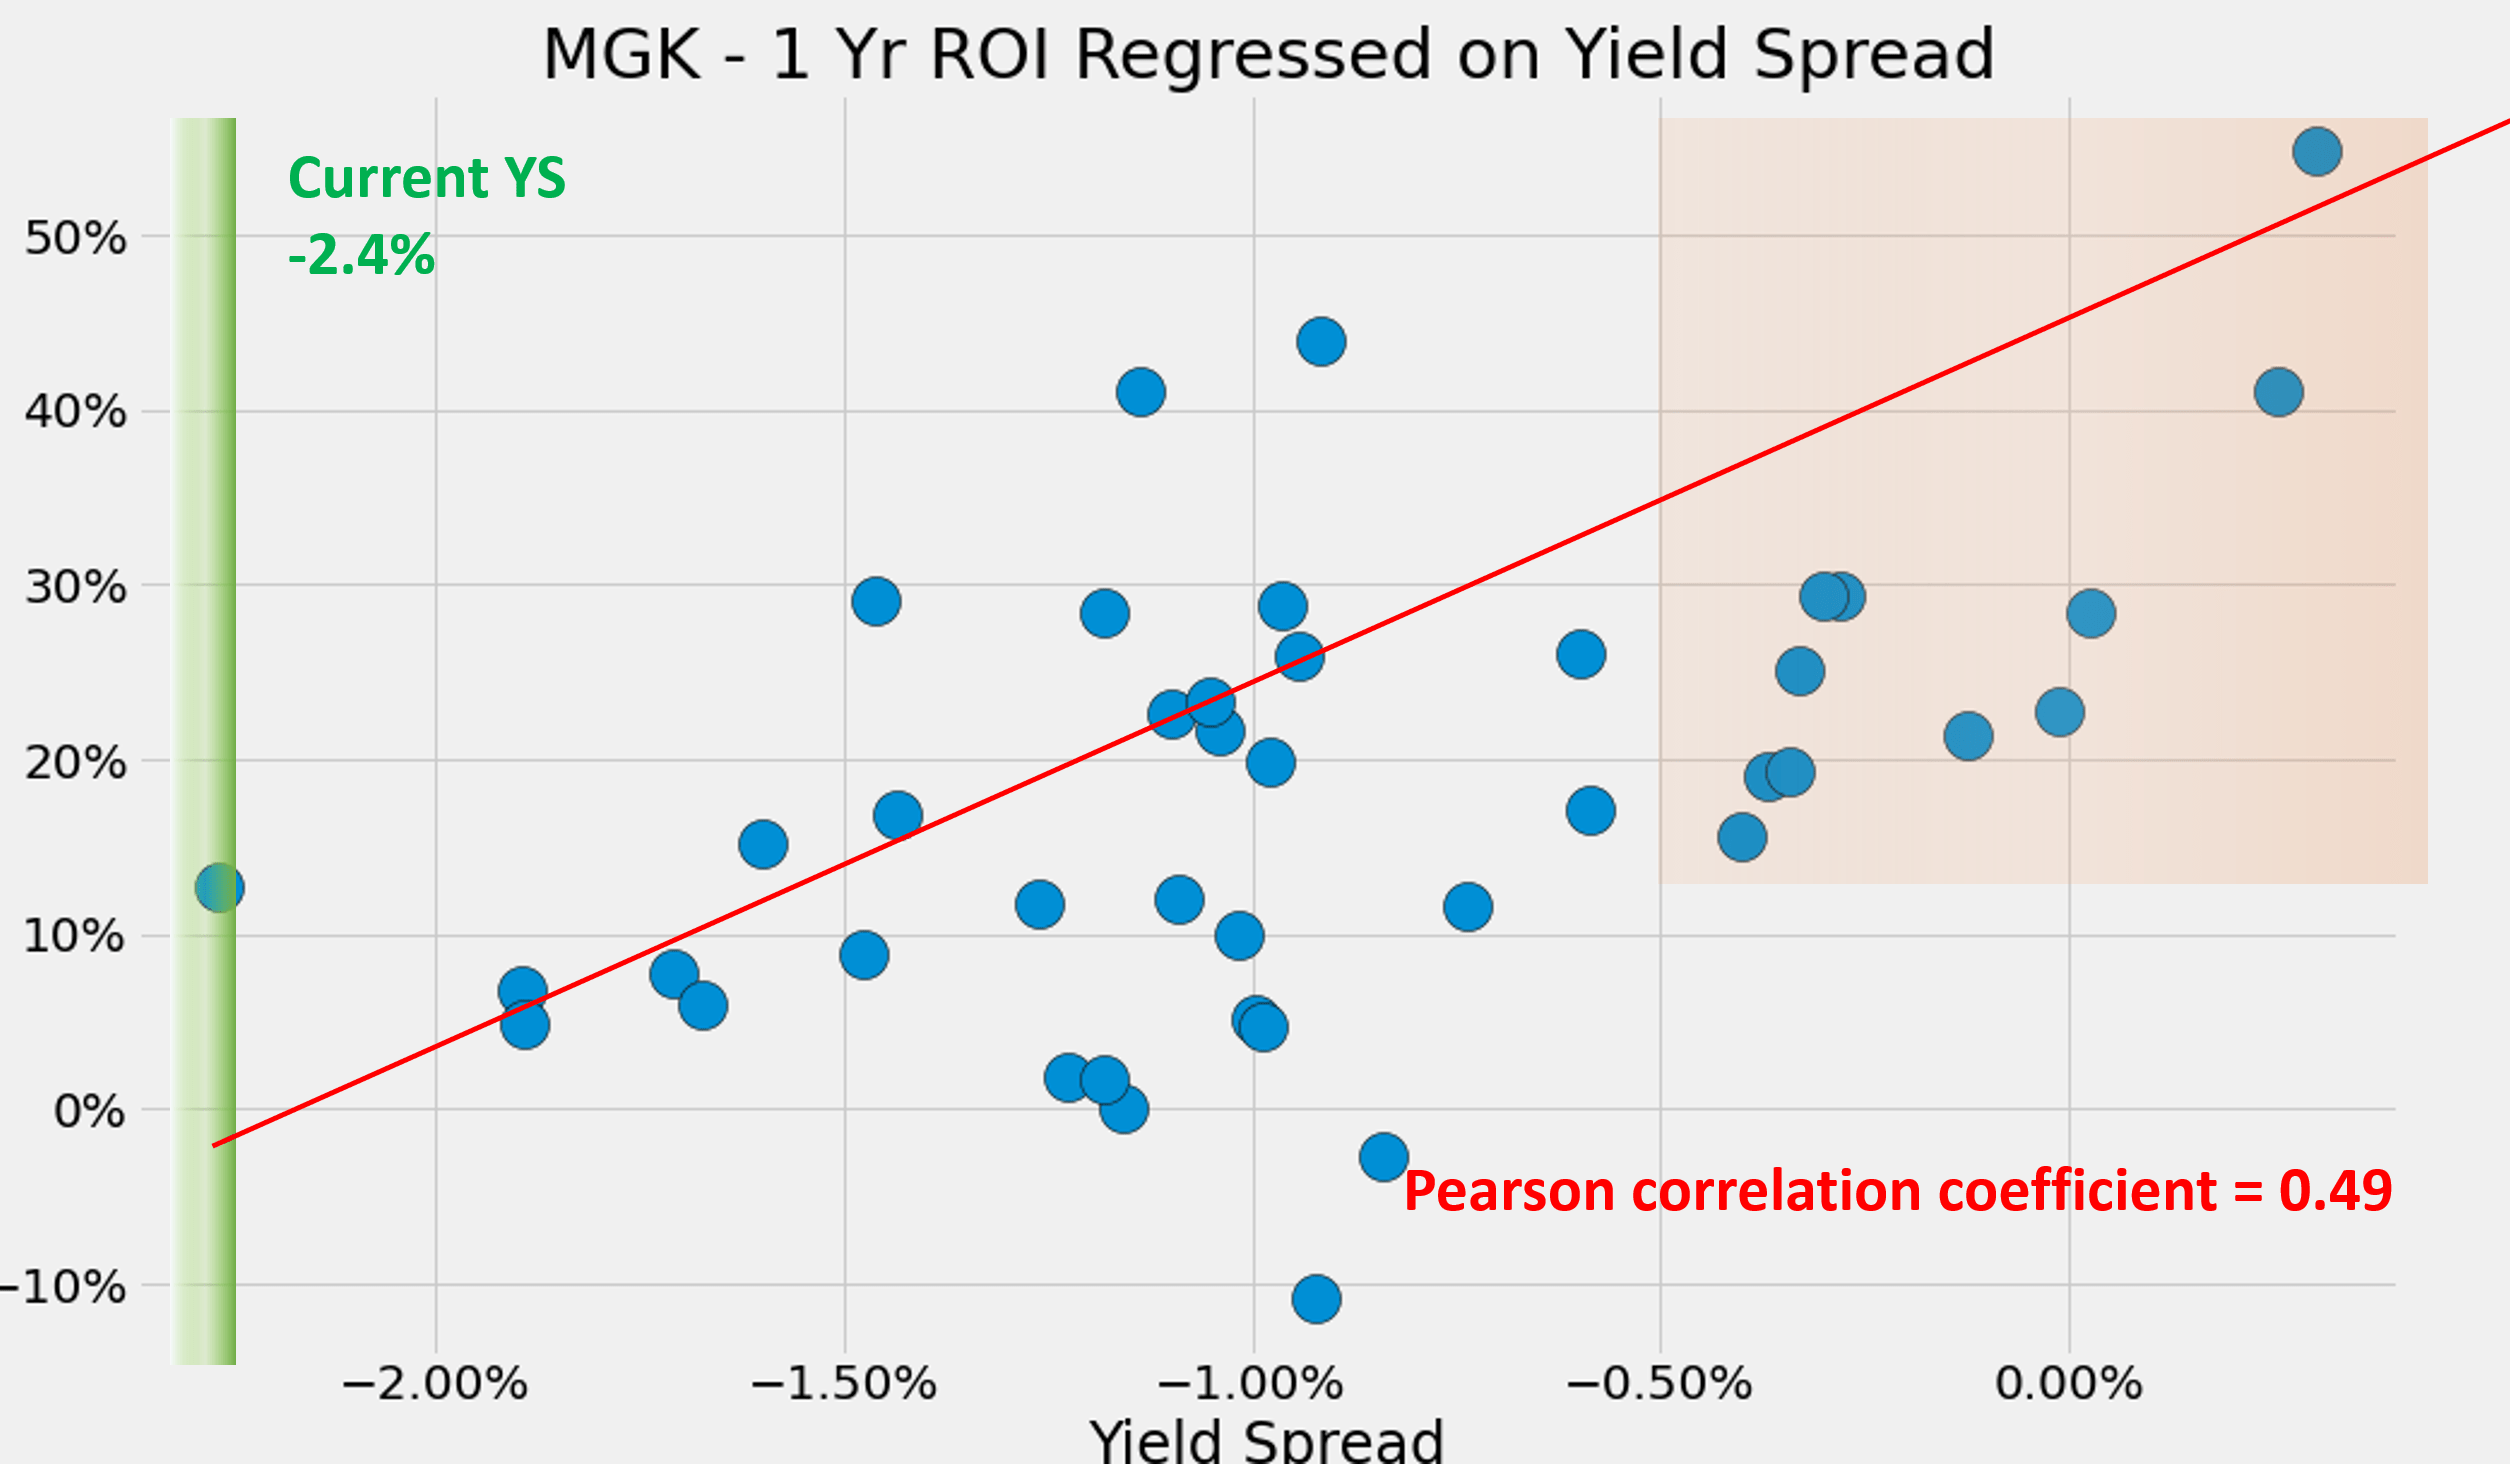
Summary and final thoughts
MGK has corrected by more than 16% (and underperformed the overall market by more than 10%) since I first cautioned about its valuation risks about 1 year ago. Today, despite the large correction, its valuation risks are still substantial both in absolute terms and relative terms.
Its absolute PE is currently 29x, still a quite elevated level. Relative to the overall equity market, it is at about a 45% valuation premium. My view is that the fund’s growth projections are both too optimistic and insufficient to justify the valuation premium. Relative to risk-free interest rates, its current yield spread is at -2.42%, the thinnest level since its inception in 2011, signaling substantial valuation risks ahead and extreme sensitivity to further rate uncertainties.
Be the first to comment