

rticknor/iStock via Getty Images
Introduction
On March 25, 2022, the Vancouver, British Columbia-based Canadian Metalla Royalty & Streaming Ltd. (NYSE:MTA) announced its operating and financial results for the fourth quarter and full-year 2021.
1 – 4Q21 full-year 2021 results snapshot
4Q21 revenue was $0.80 million, in line with expectations, with gold equivalent production of 772 GEOs sold at $1,718 per ounce. It was a busy year from an acquisition point of view.
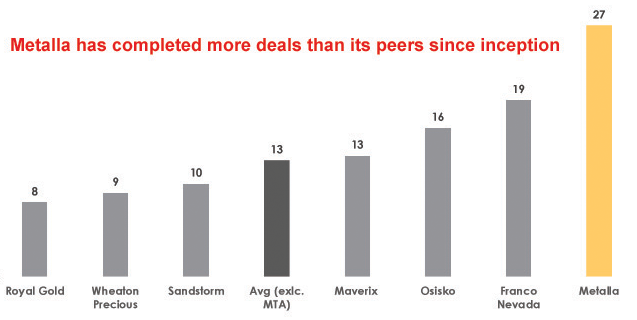
MTA: Acquisition in 2021 Presentation (Metalla Royalty & Streaming) MTA: Chart comparison acquisition from Presentation (Metalla Royalty & Streaming)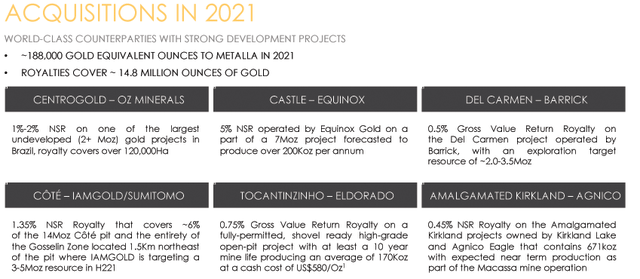
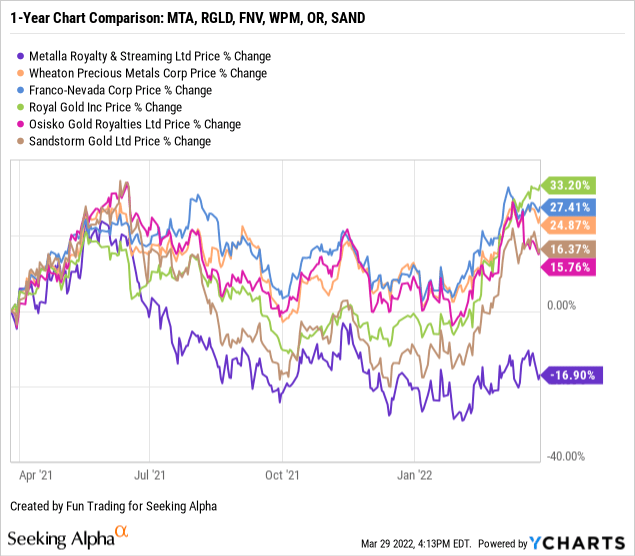
2 – Stock Performance
Metalla Royalty has dropped significantly on a one-year basis.
MTA is now down 17% on a one-year basis. It continues to be the worst performer in the group.
We can compare MTA with Osisko Gold Royalties (OR), Sandstorm Gold (SAND), and my two long-term streamers Franco-Nevada (FNV) and Wheaton Precious Metals (WPM).
3 – Investment Thesis
The investment thesis is quite simple. The company remains in the development stage, and the risk of dilution for shareholders is high.
It is evident when we look at the balance sheet. The use of an ATM is not helping the stock, but, on the other side, it is a simple way to finance expansion.
MTA: Map presentation (Metalla Royalty & Streaming)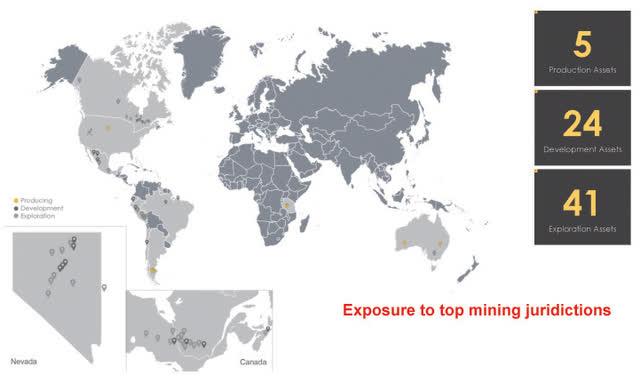
Thus, I recommend investing only a small cash amount in MTA as a long bet with a time horizon of about five years. It is essential to focus on trading the short-term LIFO gold volatility while keeping a minimal core position.
Trading about 65% to 75% of your total investment using Technical Analysis seems prudent.
Metalla Royalty & Streaming Ltd.: 4Q21 Financial Snapshot History – The Raw Numbers
Note: The numbers are indicated in $US.
| Metalla Royalty | 4Q20 | 1Q21 | 2Q21 | 3Q21 | 4Q21 |
| Total Revenues in $ Million | 1.31 | 0.68 | 0.70 | 0.79 | 0.80 |
| Net Income in $ Million | -4.75 | -2.38 | -2.73 | -2.19 | -3.13 |
| EBITDA $ Million | -2.78 | -1.68 | -2.10 | -1.48 | -2.07* |
| EPS diluted in $/share | -0.13 | -0.06 | -0.06 | -0.05 | -0.07 |
| Operating Cash Flow in $ Million | -2.58 | 0.06 | 0.39 | 0.43 | -0.58 |
| Capital Expenditure in $ Million | 4.68 | 14.71 | 10.58 | 0.04 | 10.69 |
| Free Cash Flow in $ Million | -7.26 | -14.65 | -10.20 | 0.39 | -11.27* |
| Total Cash $ Million | 5.30 | 4.13 | 3.45 | 9.98 | 4.10 |
| Total Long Term Debt in $ Million | 3.06 | 3.18 | 3.31 | 3.32 | 10.52 |
| Shares Outstanding (diluted) in Million | 36.21 | 40.71 | 42.28 | 43.29 | 44.04 |
| Producing assets | 4Q20 | 1Q21 | 2Q21 | 3Q21 | 4Q21 |
| Gold in GEOs | 1,404 | 731 | 646 | 766 | 772 |
| Gold equivalent price realized | 1,784 | 1,751 | 1,778 | 1,733 | 1,718 |
Data Source: Company release
Gold Production and Balance Sheet Details
1 – Revenues were $0.80 million for the fourth quarter of 2021
MTA: Quarterly Revenue history (Fun Trading)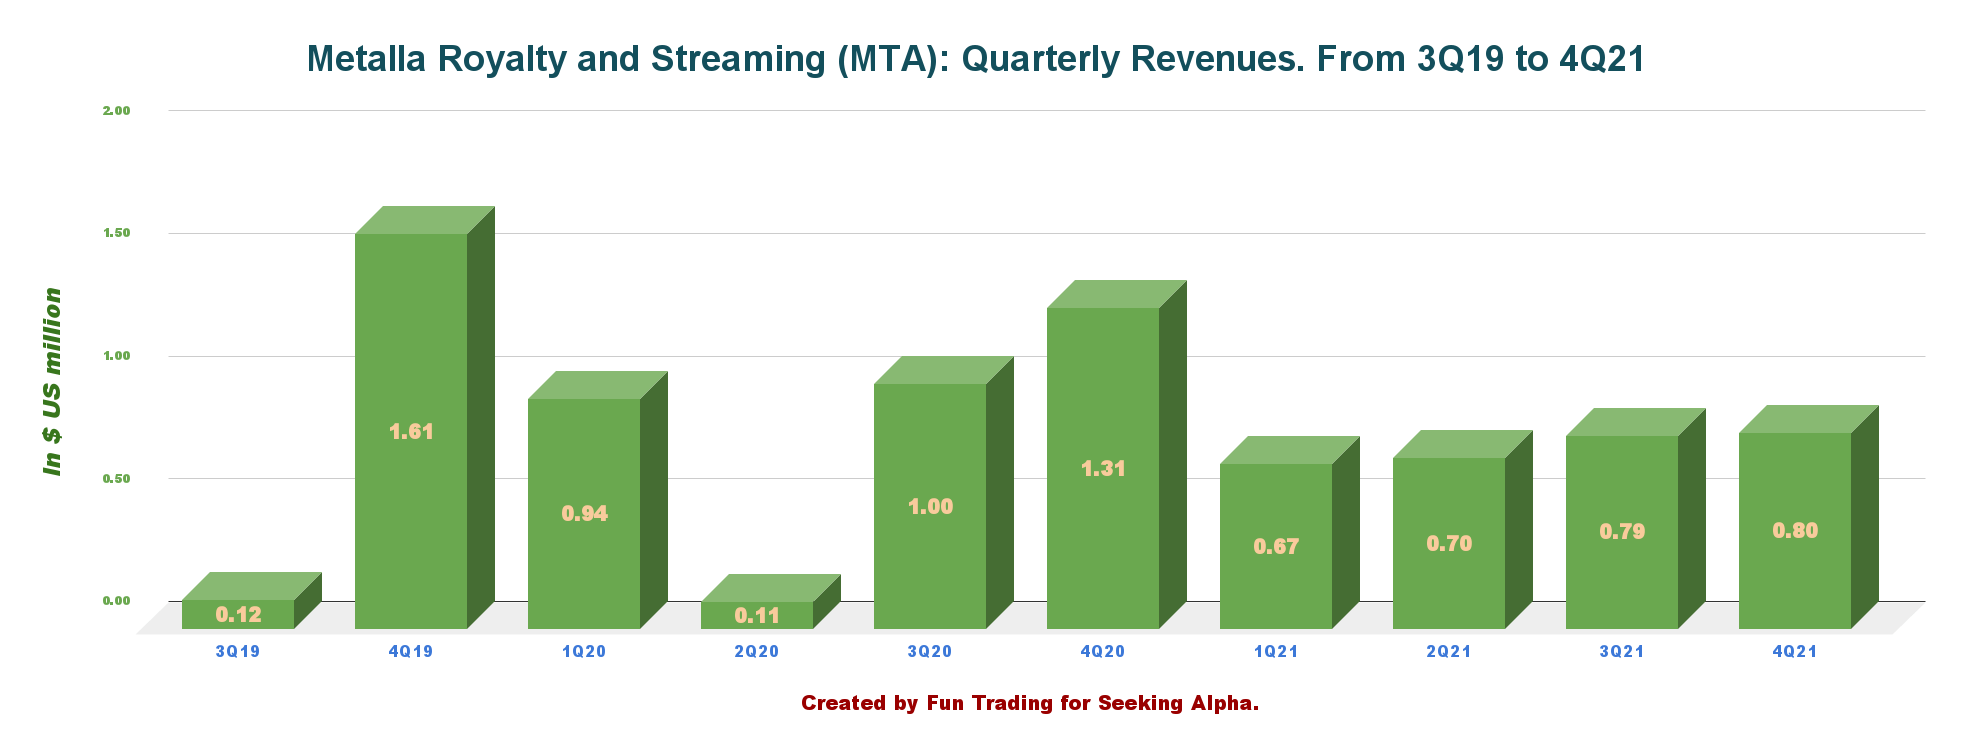
The quarterly revenue came in at $0.80 million, with a net loss of $3.13 million. Income was derived mainly from the Wharf, Joaquin, and COSE royalties, the New Luika Gold Mine stream held by Silverback Ltd., the Higginsville derivative royalty asset, and other royalty interests.
Brett Heath, President and CEO of Metalla, said in the press release:
2021 represented another major step in the continued growth of Metalla, adding seven high-quality development royalties all being advanced by top operators on proven geological trends. The 1.35% royalty on the Côté-Gosselin project and the 5% royalty on the Castle Mountain project show signs of becoming cornerstone parts of the Metalla portfolio, and the other five royalties acquired by Metalla in 2021 provide an enhanced diverse growth profile of production that is just getting started.
2 – Free cash flow was a loss estimated at $11.27 million for 4Q21
MTA: Quarterly Free cash flow history (Fun Trading)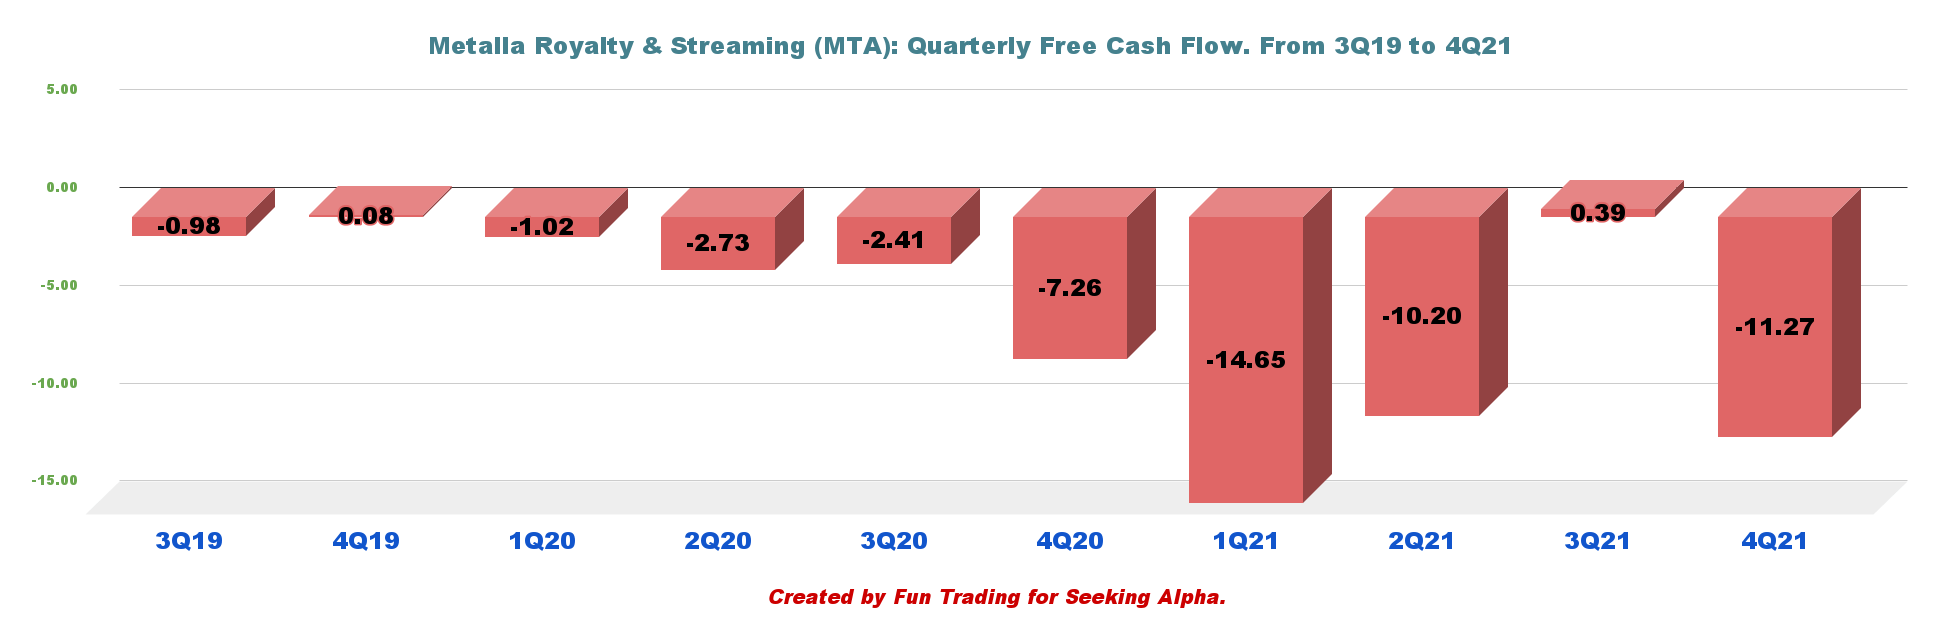
Note: Generic free cash flow is the cash from operations minus CapEx.
In my preceding article, Metalla is in the expansion phase. The company is not generating free cash flow on a one-year basis. In this case, it is standard to experience negative free cash flow when spending cash to acquire new assets is high.
During the quarter ending December 31, 2021, free cash flow was a loss estimated at $11.27 million. Trailing twelve-month free cash flow is now a loss of $35.73 million.
3 – Gold equivalent production details. Total production was 772 GEOs in 4Q21 and 2,915 GEOs in 2021
Revenue was $0.80 million, in line with expectations, with gold equivalent production of 772 GEOs sold at $1,718 per ounce.
For 2021, Metalla received 2,915 attributable Gold Equivalent Ounces (“GEOs”) at an average realized price of $1,718 and an average cash cost of $7 per GEO.
Note: The gold equivalent production was within the guidance of 2,200 to 3,200 attributable gold equivalent ounces.
MTA: Quarterly Gold equivalent production history (Fun Trading)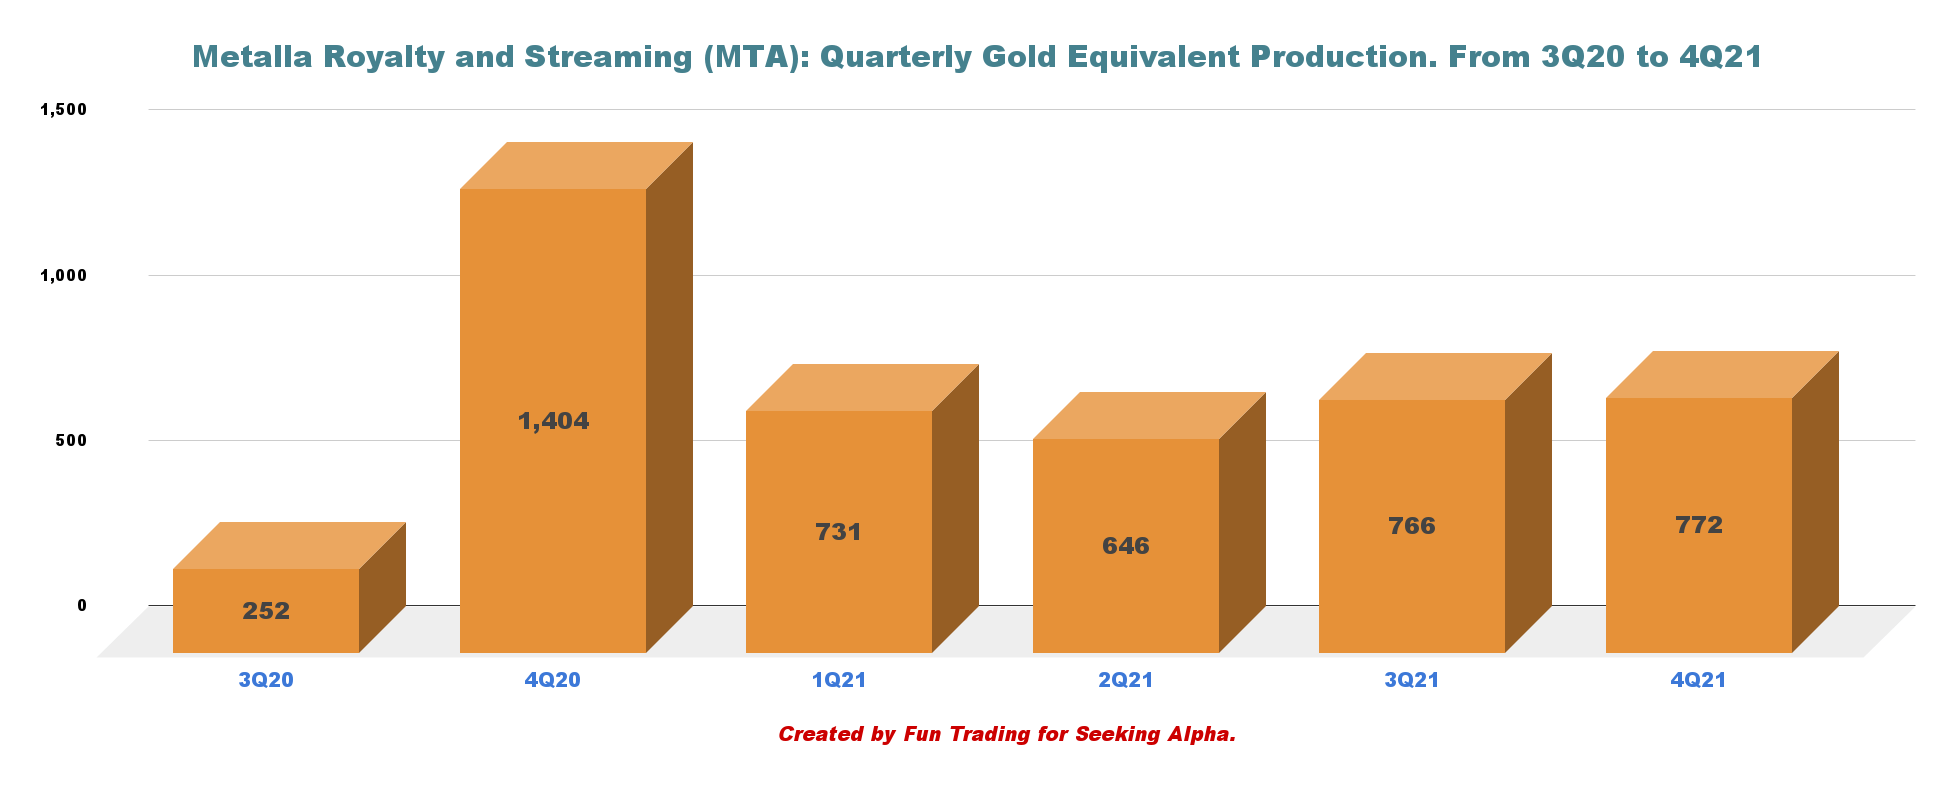
The company increased the number of royalties and streams held to 70 precious metal assets at the end of December 2021.
MTA: Quarterly gold price history (Fun Trading)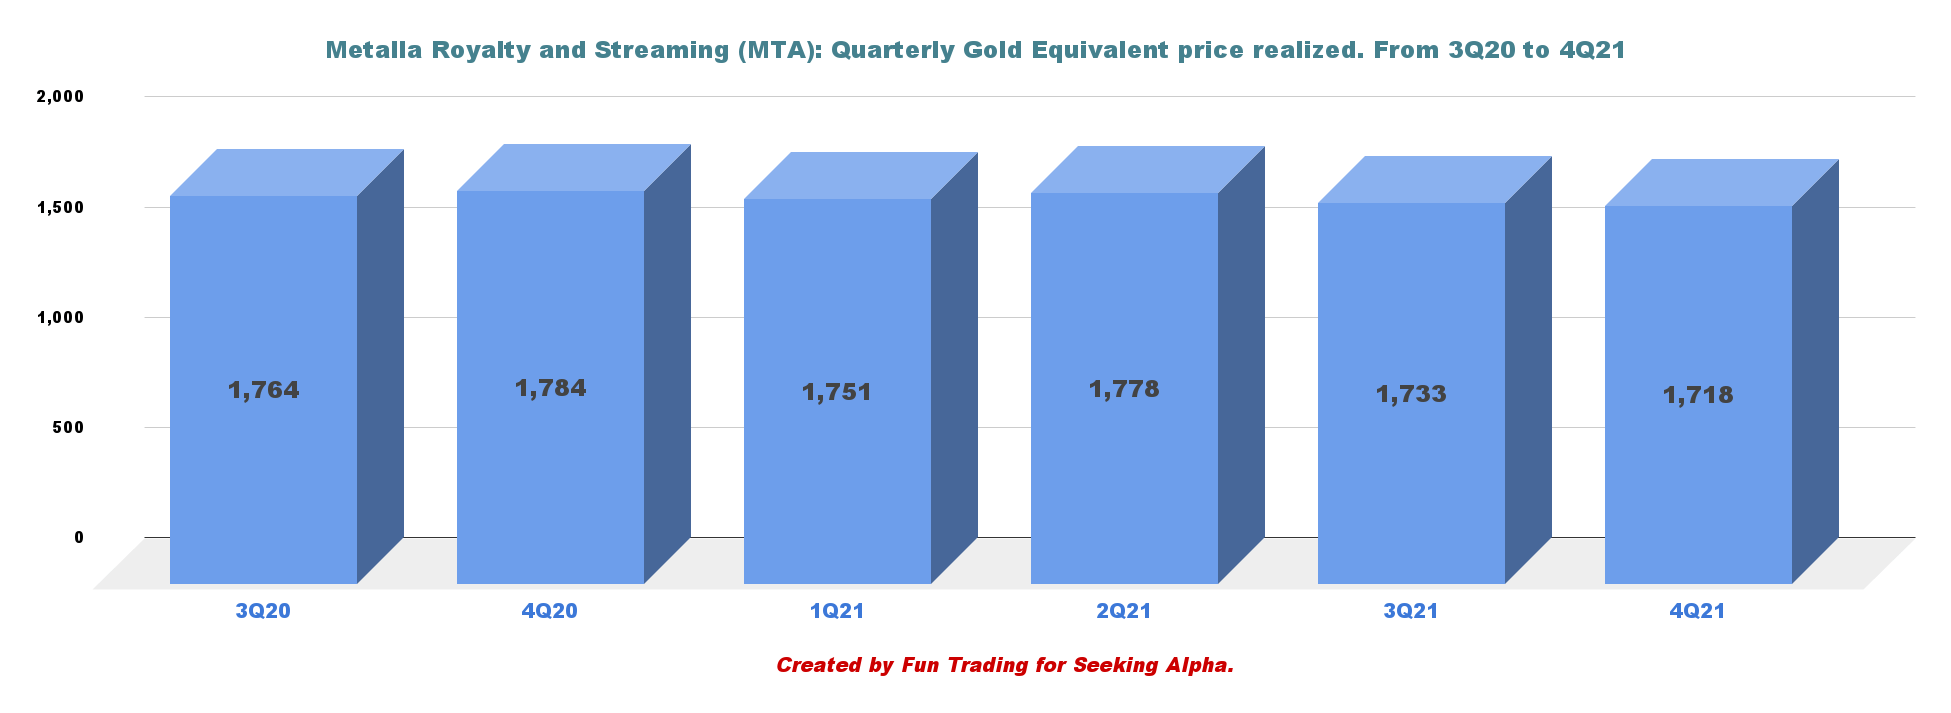
4 – Cash and debt situation
MTA: Quarterly Cash versus Debt history (Fun Trading)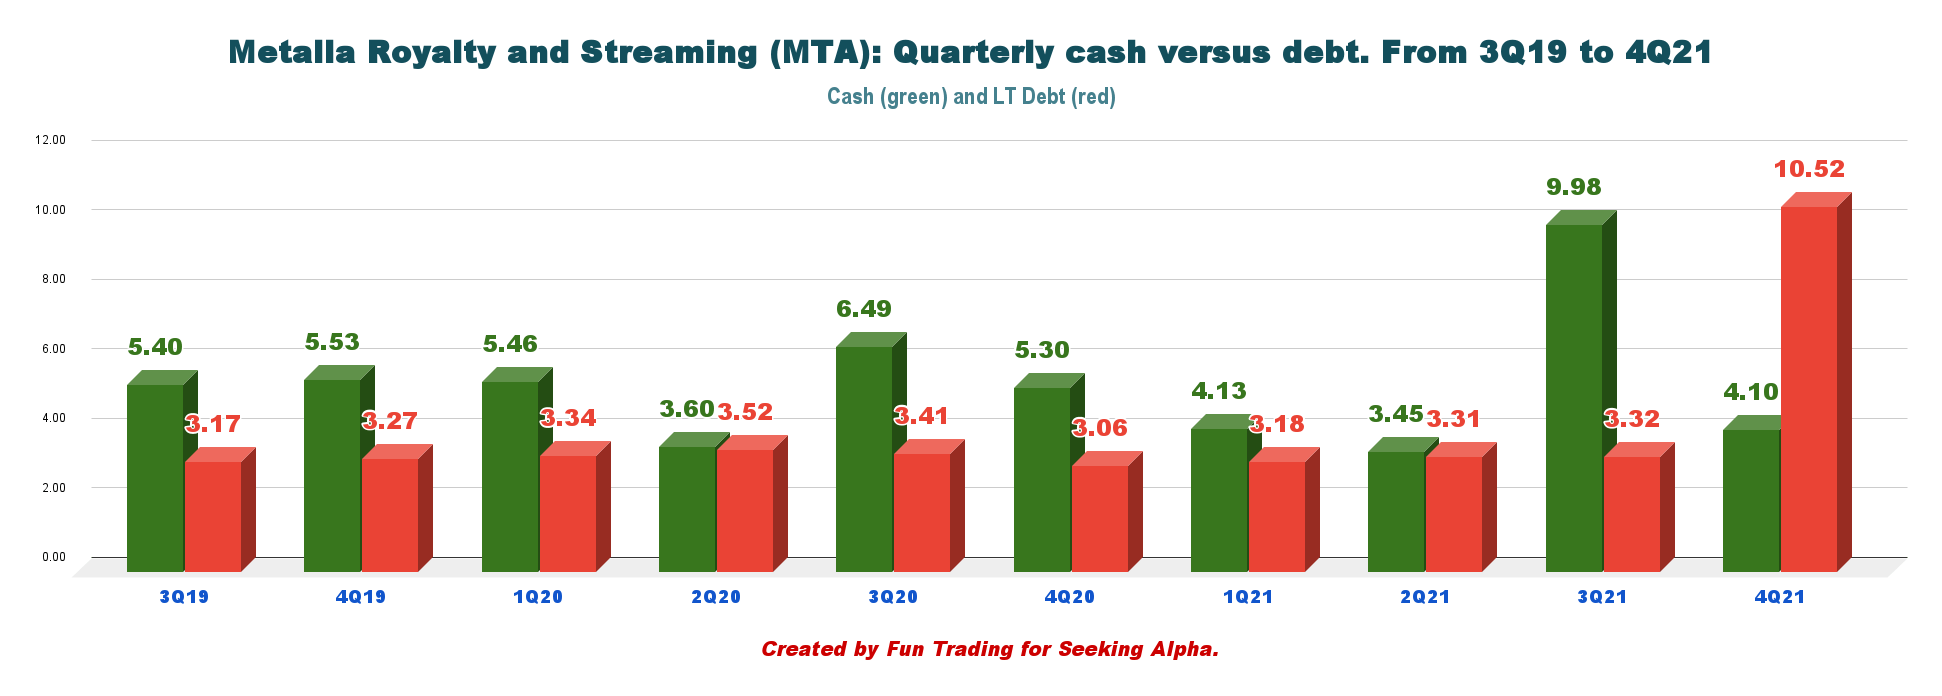
The company is financing its expansion by using its stock as a Banana Republic currency through an ATM Program that I do not like.
Cash on hand is $4.10 million, and long-term debt was $10.52 million at the end of December 2021.
5 – Risk of dilution attached to the ATM program:
The ATM raises the risk of dilution, and I am not a fan of such financing. However, it is often the cheapest and the fastest way to finance expansion from the company’s standpoint.
On May 14, 2021, the company announced a new equity distribution agreement.
Under the 2021 ATM Program, the Company may distribute up to $35.0 million (or the equivalent in Canadian dollars) in common shares of the Company.
MTA sold 1,622,165 shares from May 14, 2021 to December 31, 2021 for $13.0 million. However, in 2022, the company sold another 348,443 shares for an additional $3 million in net proceeds.
The critical part for shareholders is that Metalla still has $15.9 million remaining to sell in 2022.
Technical Analysis (Short Term) and Commentary
MTA: TA Chart (Fun Trading)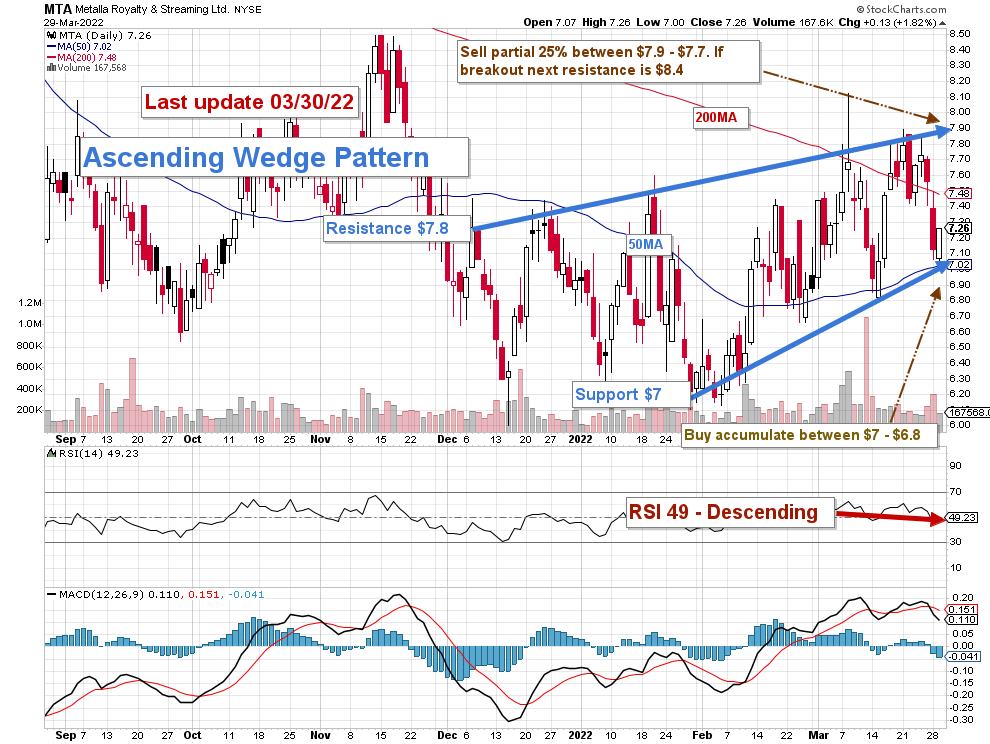
MTA forms an ascending channel pattern with resistance at $7.8 and support at $7.
The short-term trading strategy is to trade LIFO about 55%-60% of your position and keep a small core long-term position for a much higher payday. I suggest selling between $7.90 and $7.70 and waiting for a retracement below $7.
MTA could experience a breakdown if the gold price loses its strong momentum and retests the lower support at $6.30.
Conversely, if the gold price can trade above $1,975 per ounce due to a frightening jump in inflation and a continued unwillingness to act from the Fed, MTA could reach $8.50.
Watch gold like a hawk.
Warning: The TA chart must be updated frequently to be relevant. It is what I am doing in my stock tracker. The chart above has a possible validity of about a week. Remember, the TA chart is a tool only to help you adopt the right strategy. It is not a way to foresee the future. No one and nothing can.
Author’s note: If you find value in this article and would like to encourage such continued efforts, please click the “Like” button below as a vote of support. Thanks.
Be the first to comment