Fritz Jorgensen
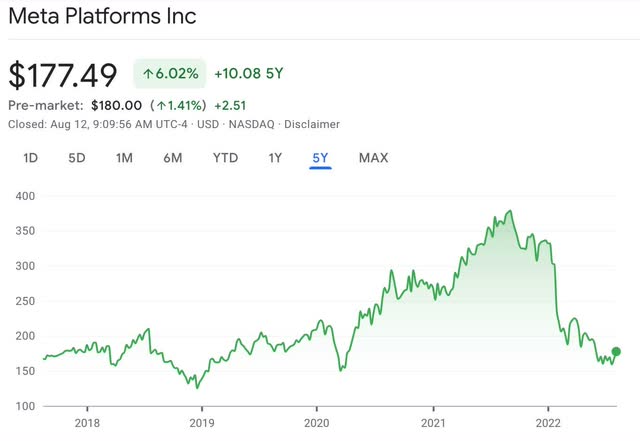
Meta Platforms (NASDAQ:META) (formerly Facebook) has been experiencing some headwinds of late as a result of weakening advertising demand and foreign currency exchange rates. This has led to Meta’s net income declining 29% for the first six months of its fiscal year. With the stock trading close to its 52-week low, it provides long-term investors with an opportunity to buy the stock at an attractive valuation. Yet, despite the challenges the company faces, it continues to grow its user base and engagement across its family of apps.
Analysis
Buy Rating: I have a Buy rating for Meta’s stock with a five-year target price of $451 per share.
In my analysis of Meta stock, I believe the company can continue to grow its revenue long term with a 20% growth rate. This is a conservative estimate relative to the 33% growth rate the company has seen in the last five years. Albeit, we are in a new phase of the market with high inflation that is tempering growth moving forward.
With the company’s ability to monetize user engagement into revenues, I am estimating that the company can continue to generate net margins in the high 20s to low 30s. For purposes of this analysis, I will use a 28% net margin moving forward.
In terms of valuation, I am estimating that Meta’s stock will eventually trade on par with the overall market, which currently stands at 17. As the overall market recovers, I expect Meta’s stock’s price-to-earnings ratio (P/E) to expand as well. Lastly, the company has an additional $24 billion authorized for their share repurchase program. At current prices, I estimate that Meta’s outstanding shares will decrease by 136 million shares. This will ultimately have an effect of boosting returns to investors by an additional 10%.
Below is a table contrasting the company’s current metrics (as of the end of its last fiscal year) and stock price to the 5-year estimate:
| Meta Platforms |
Current* (as of 8/11/22) |
5-Year Estimate |
|
Revenue (in millions) |
$117,930 |
$244,538 |
|
Net Margin (%) |
33.384% |
28.16% |
|
Net Income (in millions) |
$39,370 |
$68,862 |
|
# Outstanding Shares |
2,859,000,000 |
2,592,000,000 |
|
Net Income per Share |
$13.77 per share |
$26.57 per share |
|
Price/Earnings (PE) Ratio |
13 |
17 |
|
Stock Price |
$177.49 |
$451 |
Source of company metrics: Morningstar, Meta Platforms
*Current metrics based on fiscal year end 2021
How to Read the Table
The table above shows the metrics I use in calculating the stock’s future target price. Taking the most recent year end revenues in millions ($117,930) and multiplying it by the estimated growth rate (in this instance 20%) over five years, you get the estimated revenues five years out of $244,538 (in millions).
You then multiply the revenue five years out with the estimated net margin (28.16% for Meta in 2026) to arrive at the net income of $68,862 (in millions). Divide the net income by the number of outstanding shares (2,592,000,000), and you arrive at the estimated net income per share of $26.57.
To get the estimated share price in 5 years, multiply the net income per share ($26.57) by the estimated P/E (17) in 5 years. This results in a share price of $451. At its current price of $177.49, and a five year estimated price of $451 per share, Meta’s stock could potentially return 154% in five years or an average annual return of 30.8%.
Author’s Note
As a long-term investor, I provide a 5-year price target. In identifying a stock for a Buy rating, I look for stocks that can double in price within 5 years. This would produce close to a 20% annual return which would still exceed the market’s long-term average annual return of 8.91%.
When estimating a target price in the future, I try to be as transparent as possible in the methodology and metrics I use in my analysis and research to gain the reader’s confidence in my conclusions. This is a methodology that I have successfully used for over 25 years as an investment adviser and portfolio manager through the bull market of the 1990s, the dotcom bubble, the credit crisis of 2008-2009 and more recently through the Great Resignation.


Be the first to comment