

JamesBrey/E+ via Getty Images
Being financially independent is a must for retirees, but it could be a desirable way of life even for folks who are much younger and are several years away from retirement. Being financially independent does not mean that you necessarily want to retire early or quit working altogether, it just means that it affords you the choice of living life on your terms. In simple terms, being financially independent means that your passive investments generate (or can generate) enough income on a regular basis so as to meet your basic living expenses. Obviously, the surest way to achieve financial freedom is by saving more and investing wisely for the long term. It is also important to be able to distinguish between the ‘needs’ and ‘wants’ in your life and reduce unnecessary spending, thus reducing your basic living expenses. However, this is something that is very personal and can vary greatly from one person to another.
Whether you are a retiree or you just want to be financially independent, you need a strategy that should meet the following goals:
- Produce sufficiently high income to meet basic needs.
- Preserve capital in bad times.
- Provide reasonable growth for long-term wealth preservation.
Income:
When we say “sufficiently high income,” this is more of a subjective term, and it depends upon the size of your assets, your lifestyle, and basic living expenses. Obviously, different people have different needs. If you could reduce your expenses, then your need for income also gets lower accordingly.
Percentage Yield required = 100 * ( Yearly Expenses / Size of Assets)
In the above formula, retirees getting social security or any other fixed income should reduce the yearly expense by the amount of fixed income.
It’s a widely accepted notion that any portfolio that claims to produce more than 8% income would run the risk of depleting the capital. In fact, we would rather put the red line at 6%. Your portfolio could be generating more than 8%, but any excess income over 6% should be reinvested back into the portfolio for it to prosper in the long term. Withdrawing more than 6% of income from any portfolio would put the original capital at a higher risk of depletion. Sure, if your asset size is large enough and income needs are smaller than 6%, you should reinvest the balance back into the portfolio.
Capital Preservation:
There’s almost no financial investment that can preserve the capital 100% in all kinds of situations. Even the value of cash is subject to inflation and currency fluctuations over time, especially now when the inflation is running at 40-year high. It’s a given fact that your investments (other than cash) will have some level of volatility – obviously, the lower, the better. So, one has to know one’s tolerance for volatility. We can have all the talk about capital preservation, but the real test comes when the market takes a huge dive in real-time, something akin to what we saw in 2020 due to the coronavirus pandemic or during the financial crisis of 2008. An event or correction like this can act as a real eye-opener to review and judge if your portfolio is meeting its defined goals, especially risk tolerance. If not, you should modify your strategy.
Preservation of capital is probably one of the most important factors for retirees and conservative investors. In order to preserve capital, it’s important that our overall portfolio is able to achieve low volatility and smaller drawdowns while not compromising on growth during good times.
Reasonable Growth:
It’s debatable as to how much growth is reasonable. It can vary based on your personal expectations and factors like the rate of inflation and interest rates. But assuming an average of 3% rate of long-term inflation, in our view, a 9%-10% overall annual growth of the capital (including the income withdrawals) would be very reasonable. However, more recently, inflation has been running at a much higher clip, which makes things a bit more complicated for savers.
Financial Independence:
We have already talked about it in the introductory section. Just like many other things in life, the meaning of this term would vary from person to person. There’s no universal definition of financial independence. One size does not fit all. However, the way we see it is that if your investment portfolio can safely generate enough income to sustain your basic needs (not including luxuries or vacations, etc.), you should consider yourself financially independent.
For example, your annual earnings are $100K, but if your basic needs are only $50K, then your investment portfolio should generate at least $50,000 annually, minus any other fixed income like Social Security, pension, or rental income. You could be financially independent in your 30s or 40s and still be pursuing a great career, whatever that may be. However, what financial freedom does is that it accords you the freedom to choose to do what interests you rather than doing something that you hate to do. In essence, it’s a great stress reducer that you are not fearful of losing your job on an everyday basis.
Investment Strategy:
In this article, we present a multi-basket strategy that attempts to meet most of the above goals. As such, besides growth, we focus on income-producing strategies that also preserve capital during times of crisis.
We will review our multi-basket strategy that’s not overly complicated and easy to get started. We will provide as many as five sub-strategies (or buckets), but as an individual, you could just do fine by picking and mixing up to three sub-strategies. We also will provide some backtesting examples for each sub-strategy and how they would have behaved during the 2020 crisis or during the 2008-09 financial crisis.
Please note that we manage most of these strategies/portfolios in our Marketplace service that has live performance records at least since 2018 and for some limited portfolios since 2014.
Brief Description Of Multi-Basket Strategy
Here we will discuss a multi-basket strategy, with each sub-strategy being unique in terms of income, growth goals, and risk levels. One of the buckets is specifically designed to provide the hedging mechanism to bring lower volatility and lower drawdowns to the overall portfolio. An individual investor will be well served to pick up at least three buckets and preferably include the hedging bucket.
Below we will provide several investment buckets for consideration, along with their performance overviews. Depending upon your personal situation, you can pick and choose various baskets and assign them the allocation percentages.
DGI Basket 1: (With Individual Stocks):
Allocation: 35-50%
We believe that a diversified DGI (Dividend Growth Investing) portfolio should hold roughly 15-25 stocks. We like to invest in individual stocks, and that’s what we are going to focus on in this bucket. The best part of owning individual stocks is that once you have acquired the position, there are no ongoing fees or expenses.
For our sample portfolio presented below, we will look for companies that are large-cap, blue-chip, relatively safe, and have solid dividend records. For our list below, we will try to select stocks that are likely to provide a high level of resistance to downward pressure in an outright panic situation.
We must put emphasis on diversifying among various sectors and industry segments of the economy. A selection of roughly 15-25 stocks could provide more than enough diversification. We will present 15 such stocks based on our past research, current dividend payouts, and a high level of dividend safety.
For this part of the portfolio, our focus is to select stocks that tend to do well in both good times and during recessions/corrections. This is especially important if you are a retiree. Please note that this is just a list for demonstration purposes, and there can be many other stocks that could be equally qualified.
Stocks selected:
AbbVie Inc. (ABBV), Amgen (AMGN), Clorox (CLX), Digital Realty (DLR), Enbridge (ENB), Fastenal (FAST), Home Depot (HD), Johnson & Johnson (JNJ), Kimberly-Clark (KMB), Lockheed Martin (LMT), McDonald’s (MCD), Altria (MO), NextEra Energy (NEE), Texas Instruments (TXN), and Verizon (VZ).
Table-1:
Author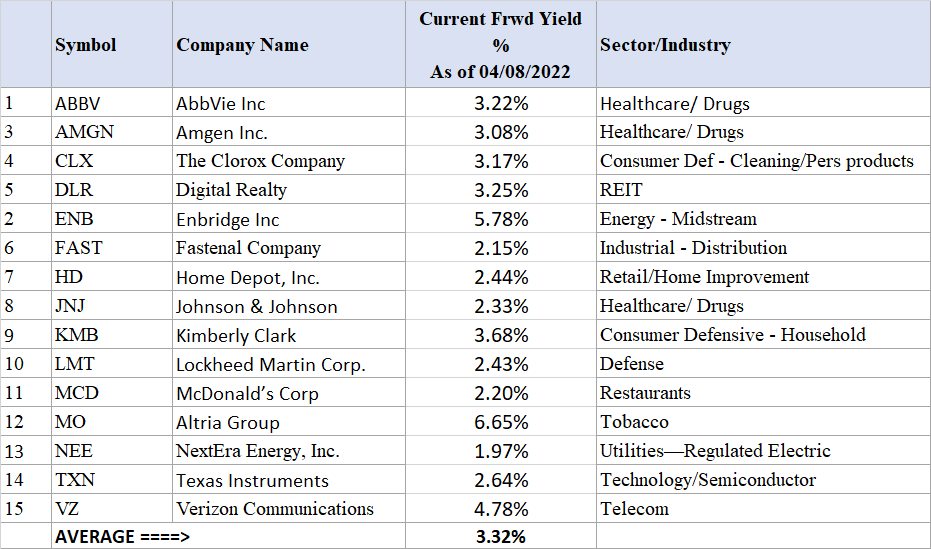
The average yield from this group of 15 stocks is reasonable at 3.32% compared to 1.3% from S&P 500. If you still have some years before retirement, reinvesting the dividends for a few years would take the yield on cost up to 4% easily.
Chart 1:
The below chart provides a backtested performance comparison with the S&P 500.
Author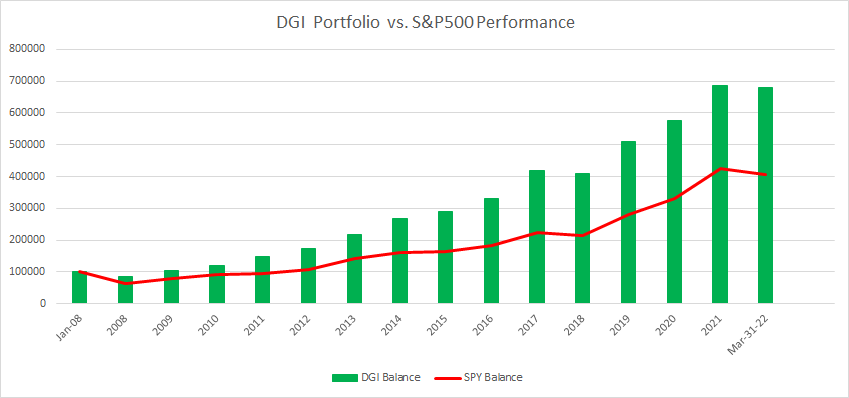
Note: For performance analysis, ABBV was replaced with its parent co. ABT, prior to the year 2013 (prior to spinoff).
DGI Basket 2: (With ETFs and Funds)
(Allocation: 35-45%)
This bucket is an alternative to DGI-bucket with individual stocks.
Many folks do not like to own individual stocks. Some do not have time or interest to research individual stocks, while others just want to have a more simplified way of investing. So, keeping in mind the interests of such investors, we will provide two options for the DGI portfolio based solely on funds or ETFs. Even though constructing a DGI portfolio of individual stocks is not a complicated process, in this bucket, we will make it even simpler.
In this option, we will not pick individual stocks. We will select a few low-cost ETFs and mix them with a few high-yield closed-end funds. We provide two options, a conservative one and another one that is a bit aggressive. Please note that option-1 may underperform the market (during bull runs), whereas option-2 should match the market performance. But in both options, the distribution yield is very respectable and more than double of S&P 500.
Please note that in option-1, we allocate up to a total of 21% to high yield securities that include two CEFs and one energy partnership. In option-2, we allocate up to 40% to high-yield funds, including four CEFs and an energy partnership.
Table 2: Option 1 (conservative)
VYM, VIG, QQQ, EFA, GLD, EPD, TIP, UTG, NBB, PFF
Author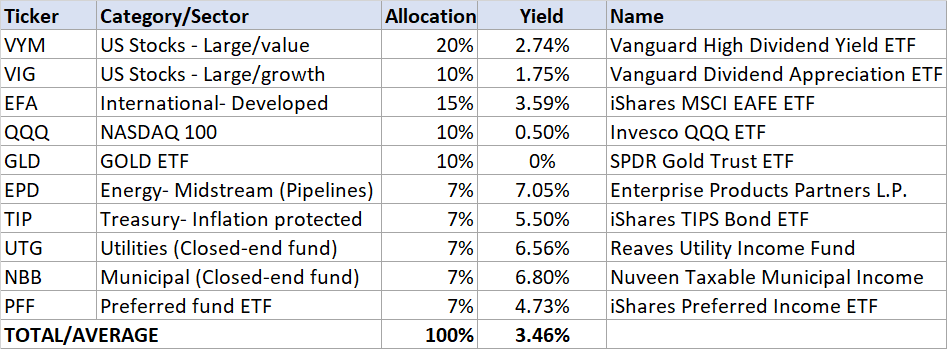
Table 2B: Option 2 (Moderately Aggressive):
VYM, VIG, QQQ, GLD, EPD, UTG, PFN, RQI, FFC
Author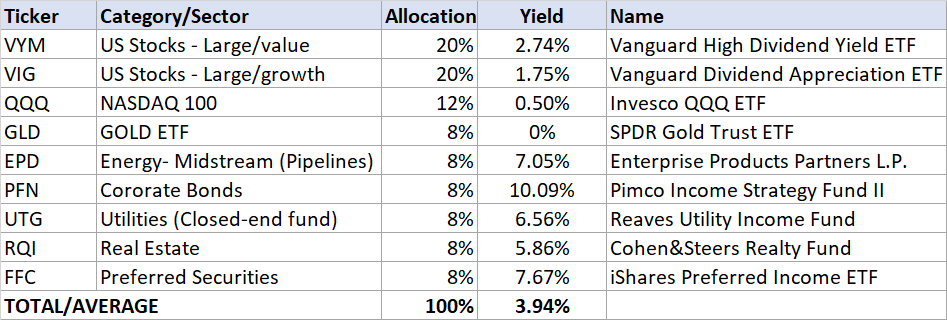
Notes:
- If this portfolio is within a taxable account, instead of NBB, one could choose a Tax-exempt Muni fund like Nuveen Municipal High Income Opportunity Fund (NMZ).
- EPD is a partnership and provides K-1 statements at tax time instead of the usual 1099-div.
Here is the comparative performance since Jan. 2008 for two options of the DGI-Fund portfolios in comparison to S&P 500. As you can see, option-1 has underperformed the market during the bull runs, whereas option-2 is more or less the mirror image of the broader market. But in both options, the distribution yield is very respectable and more than double or triple of S&P 500.
Chart-2:
Author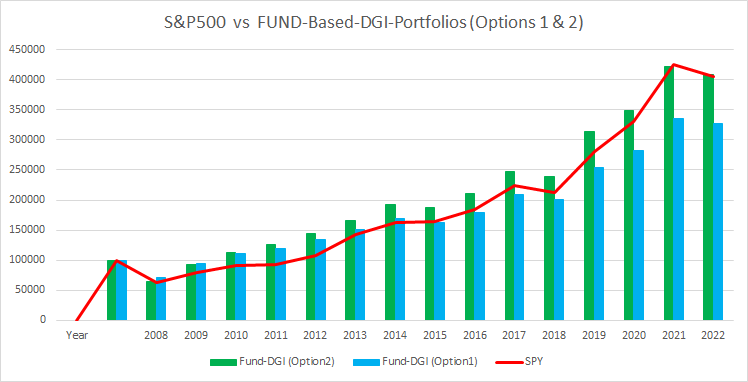
Bucket 3: Rotational Risk-Adjusted Basket
(Allocation 35% – 45%)
This is our hedging or insurance bucket, but by no means it’s short on growth. Here, in the article, we are providing one such strategy. We believe these strategies invariably work in the long term. Also, even though the strategy described below does not generate income specifically, due to low volatility, one can safely withdraw 6% of income on an annual basis. Since the Rotational strategies have very limited drawdowns and low volatility, withdrawing income does not risk depleting the portfolio at the wrong time.
Please note that we do not recommend moving a very large chunk of money in one lump sum to these strategies. What we recommend is that if you are a beginner, start with a small amount and test the waters for a few months. Thereafter, one should increase the allocation gradually over a long period of time.
Bull-N-Bear Risk-Adjusted Rotation Model
This portfolio is designed in such a way that it will preserve capital with minimal drawdowns during corrections and panic situations while providing excellent returns during the bull periods. Due to much lower volatility, this portfolio is likely to outperform the S&P 500 over long periods of time. However, it may underperform to some extent during the bull runs.
The strategy is based on eight diverse securities but will hold any two of them at any given time, based on relative positive momentum over the previous three months. Basically, we will select the two top-performing funds. The rotation will be on a monthly basis. The eight securities are:
- Vanguard High Dividend Yield ETF (VYM)
- Vanguard Dividend Appreciation ETF (VIG)
- iShares MSCI EAFE Value ETF (EFV)
- iShares MSCI EAFE Value ETF (EFG)
- Cohen & Steers Quality Income Realty Fund (RQI)
- iShares 20+ Year Treasury Bond ETF (TLT)
- iShares 1-3 Year Treasury Bond ETF (SHY)
- ProShares Short 20+ Year Treasury (TBF) **
Please note that TLT and SHY are long-term and short-term Treasury funds, which are used as hedging securities.
**Also, we have now added TBF (Short TLT) as part of the mix. This security was added on the suggestion from one of our marketplace subscribers, @jkane56. After doing some extensive backtesting, we found that this would add some definite value in the current environment, even though it does not show much-added benefit in the past due to differences in the interest rate environment.
The backtesting results going back to the year 2008 are presented below. The fund TBF was not available until 2009, so it could not be included for 2008 and 2009.
Growth Chart With No Income Withdrawals:
Chart-3:
Author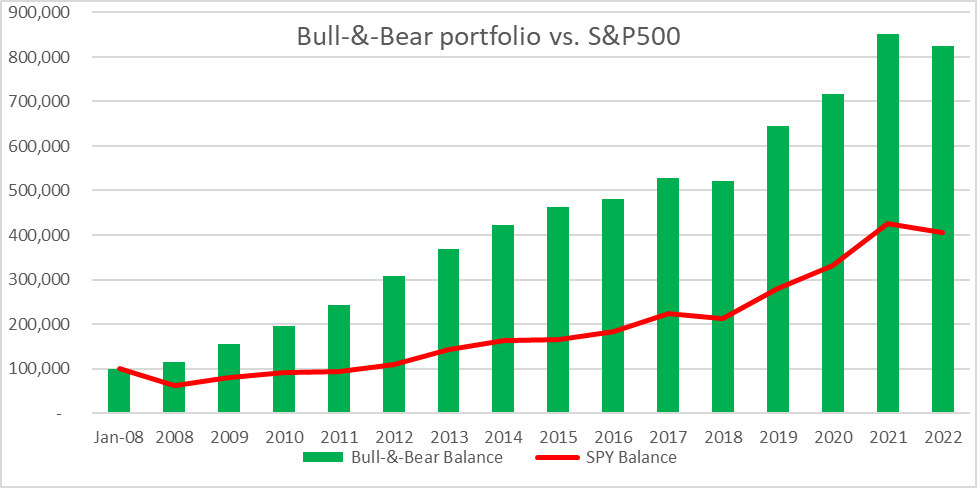
Growth Chart With 6% Income Withdrawals:
Nothing can demonstrate any better than the below chart the dangers of sequential risk that it poses to retirees. This chart demonstrates how devastating a deep correction can be at the onset of retirement (if you are to draw income). So, yes, drawdowns matter a lot, especially if you are a retiree who needs to withdraw income and a correction happens early in your retirement years. Due to a deep drawdown and a 6% income withdrawal, the S&P 500 never got a chance to make a comeback in spite of the extraordinary growth of the S&P 500 in the last 12 years.
If you had invested 100,000 in Jan. 2008 in S&P 500 and withdrew 6% income (with 3% raise every year), you would be barely above water with a balance of $120,000. However, the same amount invested in the Bull-&-Bear strategy with similar withdrawals would have resulted in a balance of $570,000 today.
Chart-3B:
Author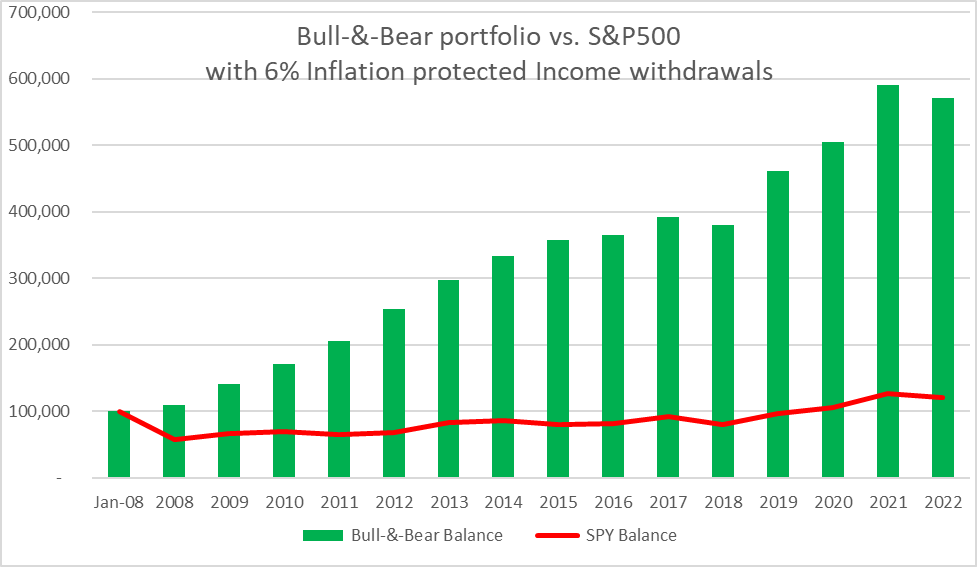
Bucket 4: High-Income (8% Income) Basket:
(Allocation: Max 25%)
This basket is recommended for investors who need significant income either in their retirement or otherwise. The main advantage of this basket is that it can lift the yield of the overall portfolio significantly while limiting the risk to a smaller bucket. In this basket, we usually recommend selecting one closed-end fund from each of the 10-12 asset classes that are available. In our articles on CEF funds and also based on our “8%-CEF-Income” portfolio, these are the eleven funds that we would have selected. In the energy midstream (pipelines) segment, we prefer individual partnership names like Enterprise Products Partners (EPD) and Magellan Midstream Partners (MMP).
These 11 funds are:
CHI, UTF, UTG, PDI, BBN, FFC, BST, HQH, MMP, USA, RQI.
Table-3:
Author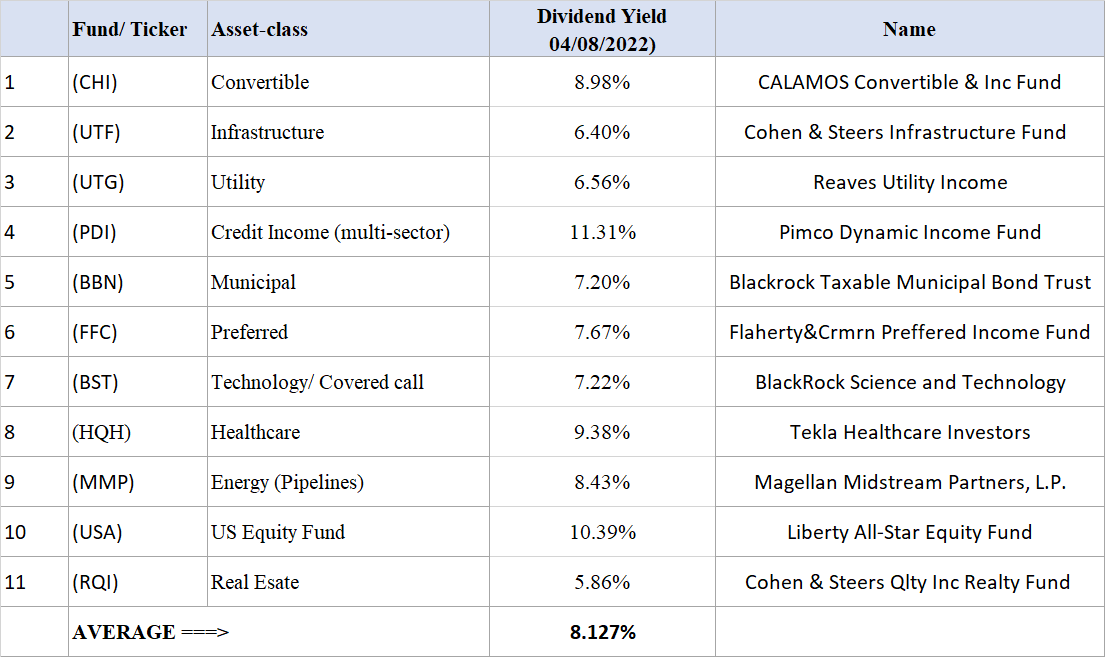
Note: MMP is a partnership and issues a K-1 statement for taxes instead of the usual 1099-div.
For the purpose of comparing the performance of this basket vis-à-vis the S&P 500, we will assume that we invested equally in these eleven funds as of Jan. 1, 2008. Now we will compare the performance of this portfolio with the S&P 500 from 2008 until March. 31, 2021. A couple of these funds did not exist all the way back to 2008, so suitable replacements were made for those years.
Please keep in mind that many of these funds use leverage, and this portfolio does not provide any downside protection. That’s why we recommend an allocation of no more than 25% but preferably less. The only purpose is to boost the income yield of the total portfolio.
Chart-4:
Author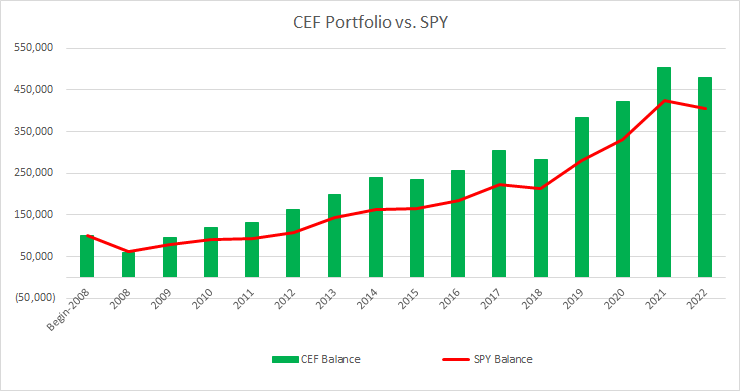
Bucket 5: Options-Income Basket
(Allocation: Max 25%)
This is one of the most active baskets and may appear to be a bit complex for readers who have never worked with options. So, in that sense, it is NOT for everyone.
That said, an options bucket has the potential to provide 10-15% income on a rather consistent basis. Sure, there are risks involved, but with some experience, the risks can be mitigated. Moreover, we do not recommend allocating more than 15-20% allocation to this bucket.
We are assuming that the reader has some prior experience with stock options and is well-versed in how to write/sell cash-covered PUTs or CALL options. If you do not have prior experience with options, we recommend reading some primer on options, having a trial account (without real money) with your broker, and gaining some experience before committing to real money. You could also read our monthly articles on Options.
We will use this bucket to sell some BUY-WRITE CALL options that have a long-term expiry, roughly one year out or less. You can buy or sell options as one contract or more, each contract representing 100 shares of the underlying security.
In the table below, we are using ten underlying stocks from different sectors/industry segments and selling BUY-WRITE CALL options. That means that we ask our broker to buy 100 shares of the underlying stock and sell the covered-call option for one contract at the same time. If you already own 100 shares (or more) of the stock in question, you may choose not to use BUY-WRITE but simply sell covered-CALL.
We are going to choose strike prices that are near or slightly below the prevailing prices to get the best premium. Also, by doing so, the chances are that at least half of the options will be CALLED away, though that would depend on the market direction. There are probably four likely scenarios:
- The market (as well as our stocks) moves up from here substantially. In this situation, we can close our positions prematurely by buying back the call options and selling the shares at much higher prices, netting 10-15% or more annualized gain.
- The market stays flat for almost the entire year (highly unlikely); we can then let the options run their entire course of one year. Chances are, 50% of our trades will get called away, and we can write fresh options on the remaining.
- The market dips 5-10% from here and muddles thru’ there for some time. In that case, we get to own shares at a nearly 10% discount from already lower price points, earn dividends, and write fresh options next year.
- The last and the worst scenario is that market (and our stocks) enters into a full-blown bear market from here. We will have to be patient in that case and keep earning nearly 3% dividend. The consolation will be that we own some of the best and most stable dividend-paying companies, and we got to buy them at nearly 10-20% lower than their 52-week highs. It should serve us well in the long term. During a market recovery, these companies have the best chance of recovering faster than most others.
A suggestive and sample list of trades is presented below:
Table-4:
Author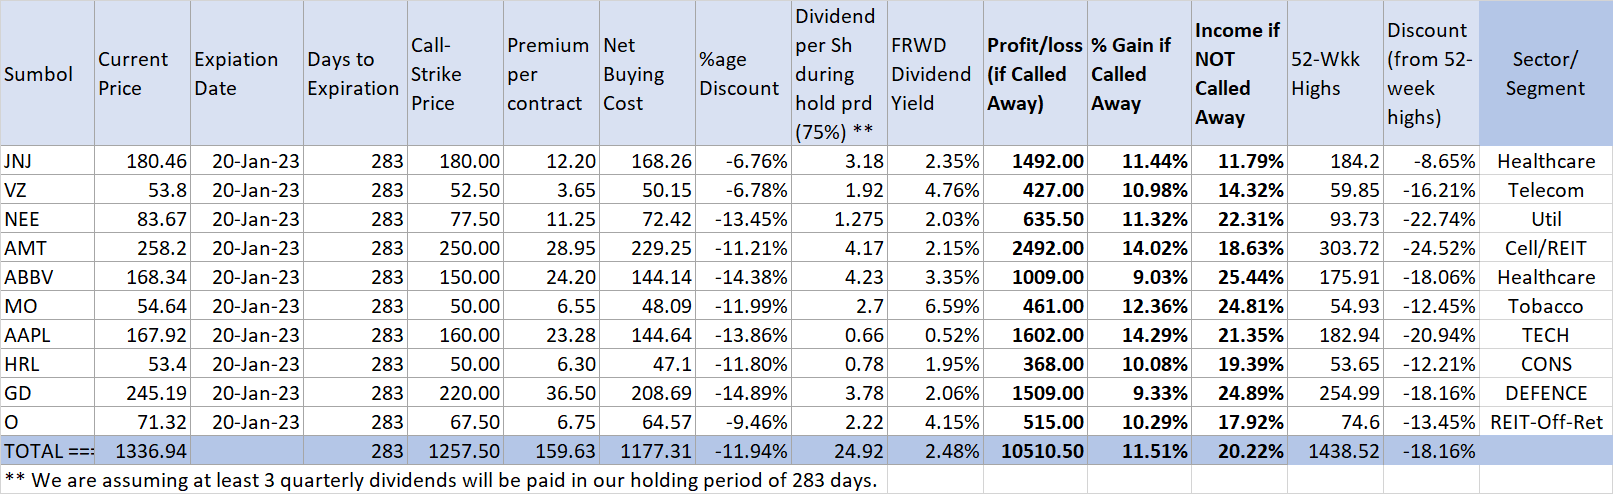
* Premium and prices are mid-day as of 04/12/2022.
If we were to write one contract on all ten trades (as above), we would need roughly $117,731 to buy these shares (buy-price minus premium earned back immediately). Let’s say we do nothing until the expiration date:
- If all the stocks/shares are called away at expiration, we will earn a decent 11.51% annualized (including dividends).
- If none of the shares are called away, we will earn an income of 20% during this time (including dividends).
- In reality, we will have many positions called away, probably more than half, as the strike prices are nearly 6% lower. For the rest, we can write new options. However, most likely, we will get plenty of opportunities to close most of these positions early and earn roughly 15% or more (annualized).
Note: Please note that you should only write/sell options on stocks at strike prices that you would not mind owning long-term. Otherwise, there could be significant risks involved with writing options.
Portfolio Construction For 2022
Let’s assume you have a portfolio of $1 million invested in broad indexes or in some mix of funds and individual stocks. The figure of $1 million is assumed for the sake of simplicity. It does not matter if you have half of that amount or double of that amount. The question is, what is the level of confidence that you have in your portfolio structure or holdings? If the markets were to start falling 30% or more tomorrow, would your level of confidence remain the same? These are important questions that you need to ask.
So, the question is, what should we do now to prepare for whether we are in a bull market or a bear market. Based on several options that we have presented above, here is one strategy that we think should work well for many do-it-yourself investors. Divide your capital into three parts or buckets as detailed below. If you are a retiree or otherwise a conservative investor, a small fourth bucket with cash-like investments could be desirable. We also call it an NPP (Near Perfect Portfolio) Strategy.
Table-5: Structure of an NPP Portfolio
Author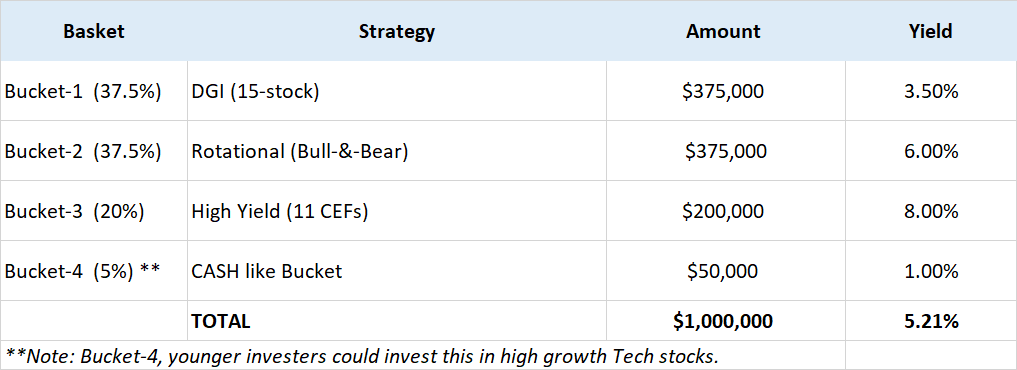
Concluding Thoughts
In the last three years, at least thrice, we had a serious market decline. First, during the fourth quarter of 2018, we had a near 20% correction and barely avoided the bear market. Then, in the year 2020, we experienced a 35% correction resulting from the coronavirus pandemic, even though it turned out to be one of the shortest bear markets and the market had a V-shape recovery. More recently, in March this year, we had a correction of roughly 13% for the S&P 500 briefly. Moreover, we are not in the clear yet. There are still too many uncertainties right now, like 40-year high inflation, rising energy prices, a hawkish Fed, rising interest rates, an inverted yield curve, and the ongoing war in eastern Europe. Obviously, the future is never certain.
We have presented five different types of portfolios, and investors can pick and choose at least three of them to make a multi-basket portfolio. We certainly recommend a certain allocation in the Rotational bucket to provide the necessary hedge, lower volatility, and smooth out the returns.
As long-term investors, we are fairly certain that whatever the market may do, whether it goes up, declines from here, or stays flat, our diversified multi-basket portfolio should perform reasonably well in good times and bad. Moreover, one can be assured of the constant and reasonably high-income stream that would not be impacted much by any recessionary times.
Be the first to comment