

Justin Sullivan
Investment Thesis
At USD 84 per share (14 Nov 2022), Meritage Homes Corporation (NYSE:MTH) is trading at a discount to its Asset Value of USD 100 per share (Sep 2022). But there is no margin of safety as we have yet to factor in the potential impairment.
There is a 0.72 correlation between MTH revenue and the US Housing Starts. The Housing Starts appear to be going into a downtrend. As the Housing Starts reduces, so will the performance of MTH.
During the last downtrend, MTH wrote off about 40% of its Total Assets. We cannot rule out impairment this round. One clue about the potential impairment is to compare its Asset Value with the Earnings Value. I estimated the Earnings Value to be USD 61 per share.
The positive point is that MTH is financially sound and would probably be able to withstand the impact of a downtrend.
The thrust of my analysis
For companies with significant amount of real assets, the Asset Value is a good estimate of the intrinsic value. Homebuilders fit this bill. But we cannot take the existing Asset Value as it is as there are potential impairments.
I consider the current Housing Starts cycle (peak to peak) to be from 2006 to 2022. During this period, there was a 0.72 correlation between MTH’s revenue and the Housing Starts. MTH performance over the past few years has benefited from the uptrend in Housing Starts. But the Housing Starts appears to have peaked and is now declining. I would expect MTH performance to follow suit.
We know the current problems besetting the housing sector. There are increasing interest rates and potential decline in house prices. Given the high inflation and the possible recession, this is not something that can be resolved even by 2023.
In other words, I do not expect the current drop in Housing Starts to be a temporary one. My view is that it is probably the start of the downtrend of the next cycle.
While I do not know how long the next cycle will last, we have to consider the following when looking at whether MTH is an investment opportunity.
- Does it have the financial resources to withstand a longer (more than 2 years) downtrend to reach the trough?
- Would MTH incur any impairment going into the downtrend?
- Can the Earnings Value provide insights about the Asset Value?
Financial Strengths
I would rate MTH as financially strong based on the following:
It has a Debt Equity ratio of 0.3 as of Sep 2022. This is about the sector average (Source: Damodaran 2022 dataset). This has declined significantly from its 2010 Debt Equity ratio of 1.2.
Over the 2006 to 2022 cycle, MTH generated an average Cash Flow from Operations of USD 30 million per year. During the same period, it generated USD 174 million in average PAT. The low Cash Flow from Operations was because it used about USD 237 million per year in net working capital. As the revenue declines, I would expect the net working capital requirements to reverse. This would result in more Cash Flow from Operations.
It has an EBITDA / EV of 0.42. The EBITDA is as of Sep 2022 while the EV is based on USD 84 per share. According to Damodaran, the sector average is 0.12. This metric measures the cash-generating capacity of the firm, relative to its value. The higher this number, the more the company can afford to borrow.
As you can see, the investing issue for MTH is not the financial risk.
No growth cyclical sector
In my earlier article on D.R Horton (DHI), I had shown that the US Homebuilding sector is a cyclical one with no long-term growth pattern.
To recap, Chart 1 below illustrates the difference in the patterns for a no-growth cycle (blue line) and a growth one (green line).
Chart 1: Cyclical Patterns (Author)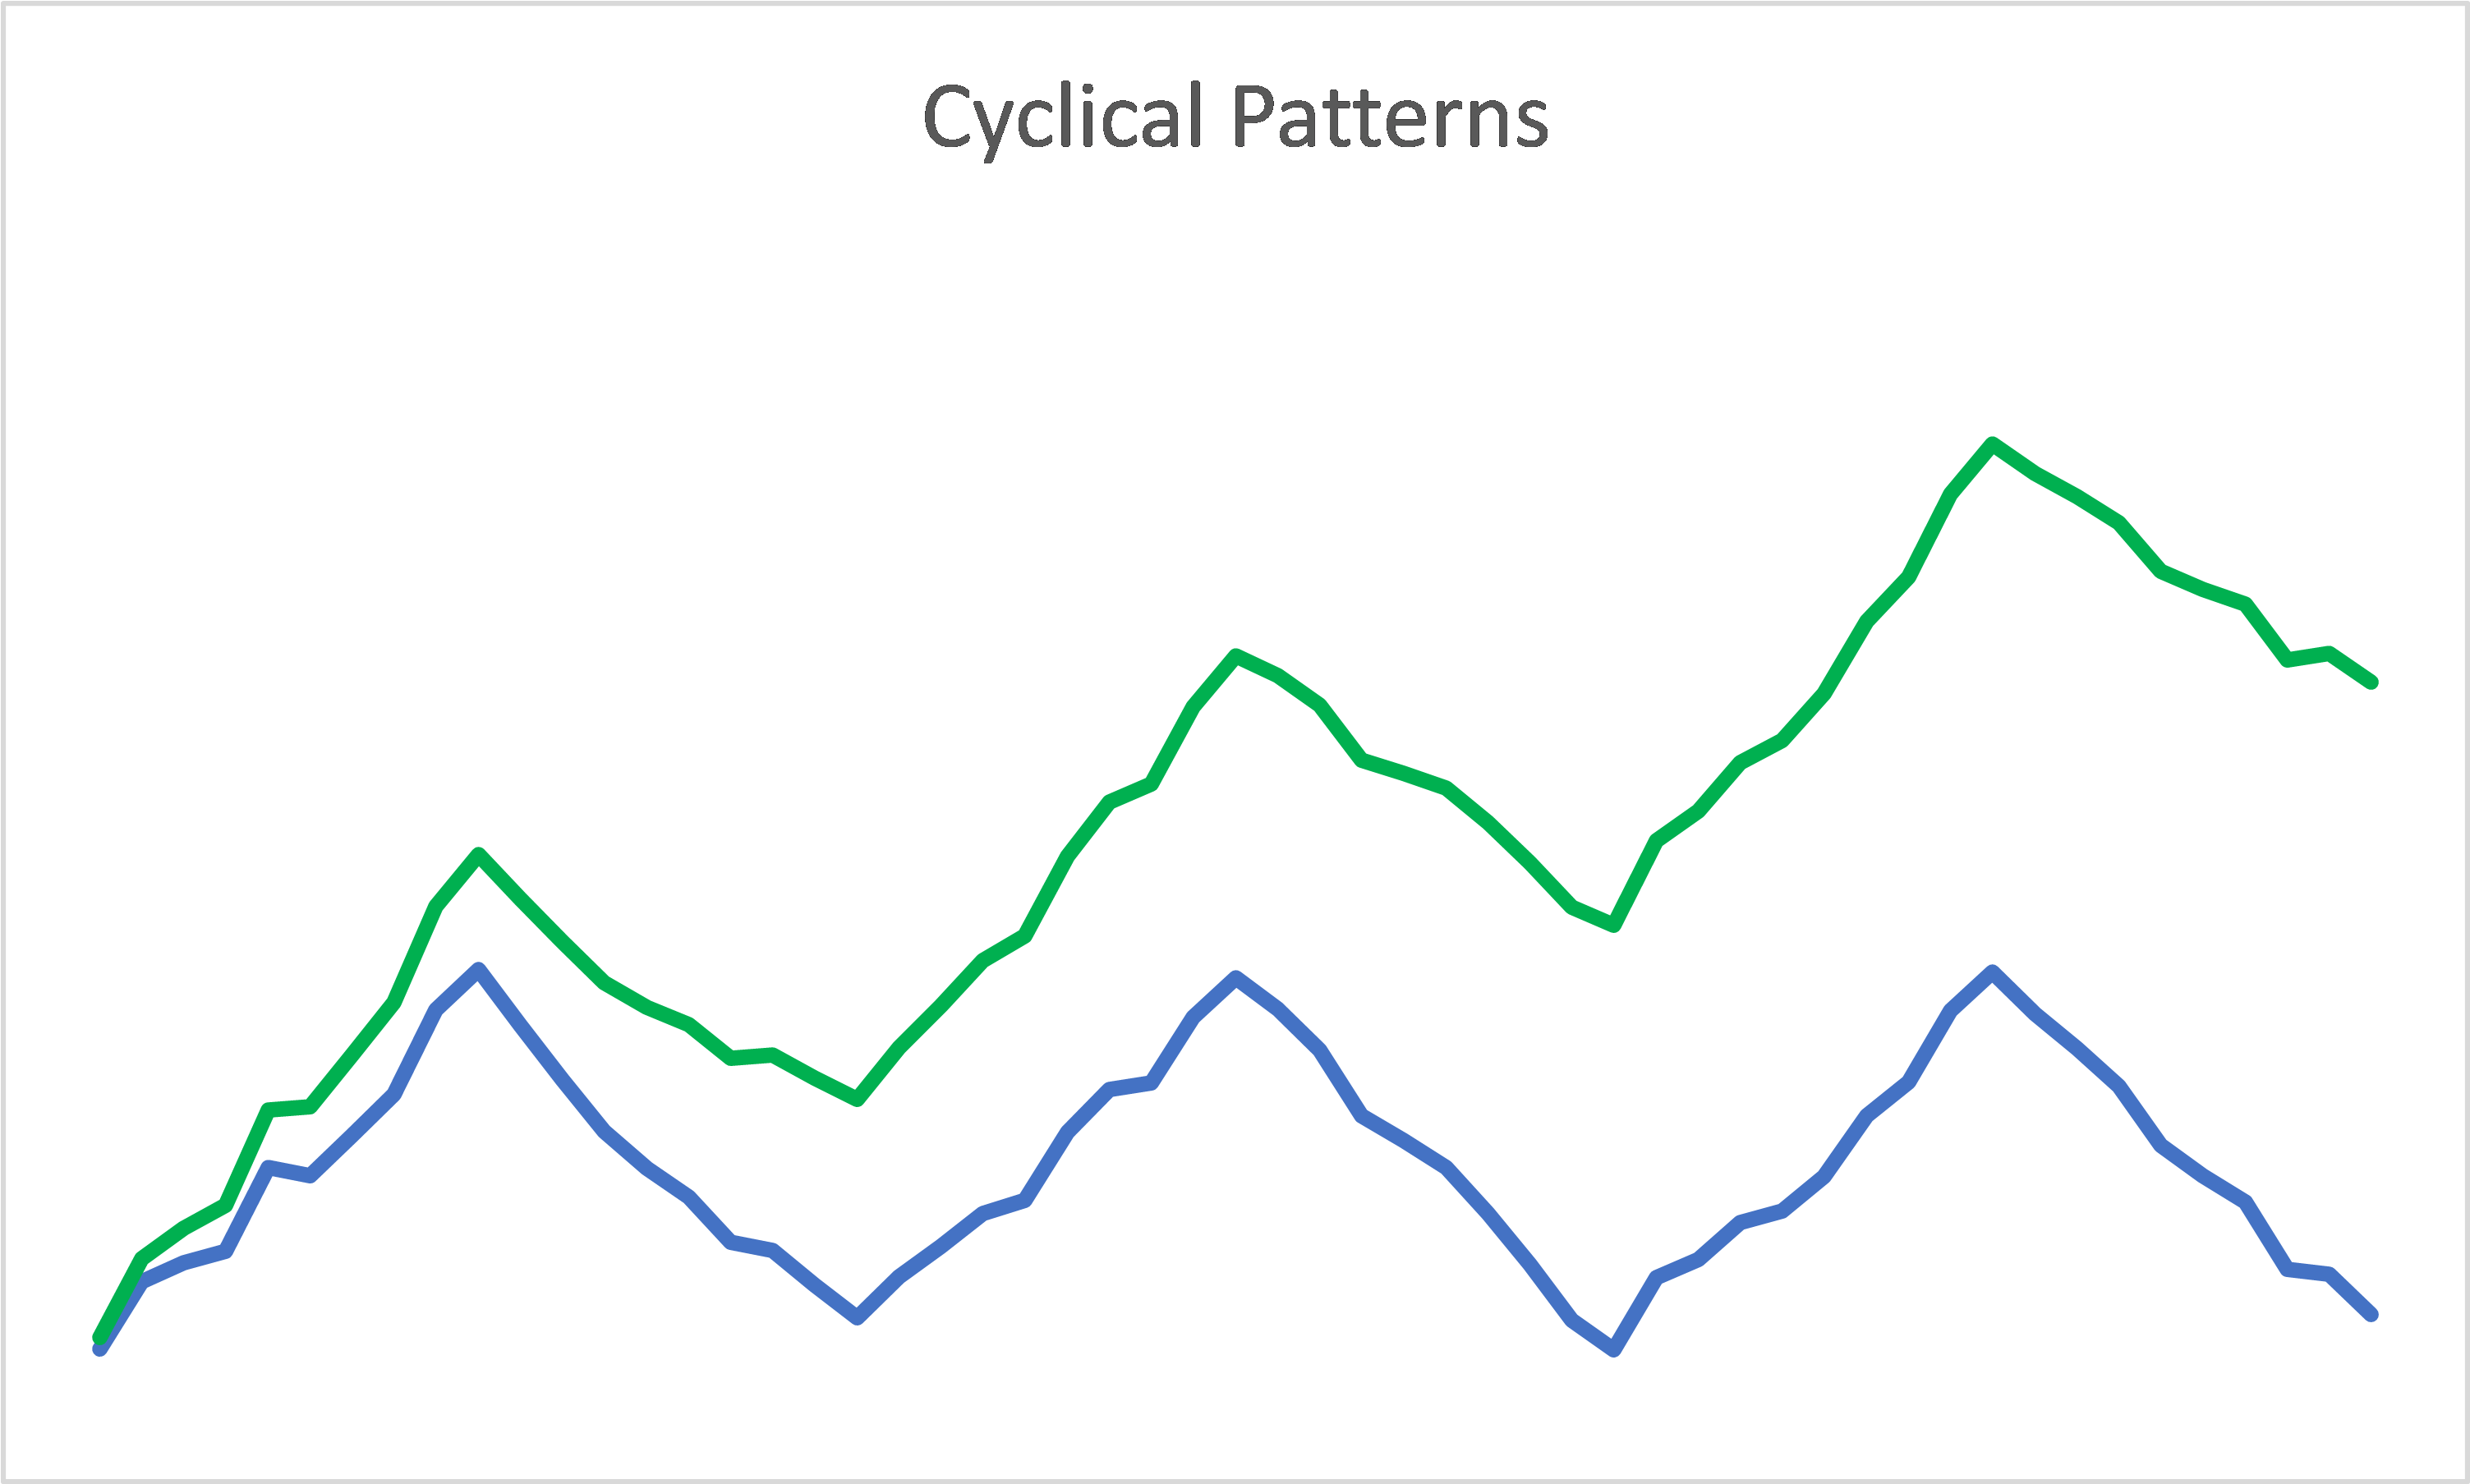
When you look at the past 70 years of US Housing Starts as per Chart 2, the conclusion is that this is more likely to be no growth cyclical sector. But the Housing Starts were based on physical units.
Chart 2: US Housing Starts (TradingEconomics.com)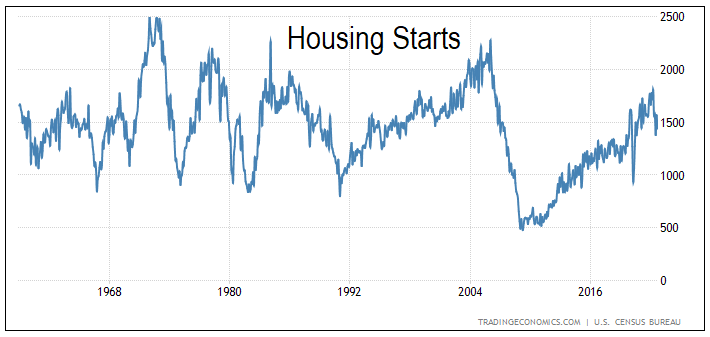
While there is no long-term growth in volume, there was still growth in prices. The House Price Index had increased at a 4.6 % CAGR from 1992 till Aug 2022. Refer to Chart 3. But this growth rate is not much different from the US long-term GDP growth rate.
Chart 3: US House Price Index (TradingEconomic.com)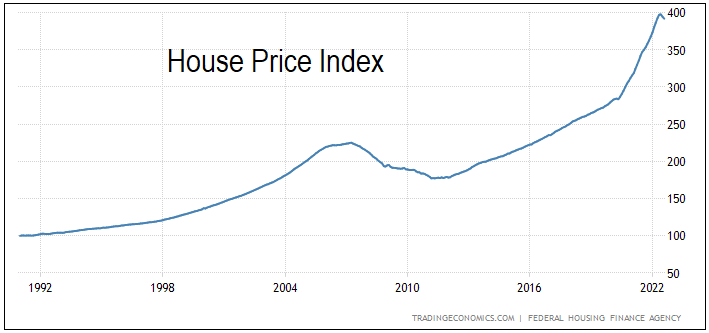
Because of the no-growth cyclical pattern, the long-term average annual Housing Starts is taken to be about 1.5 million. But this 1.5 million average is based on the various peaks and troughs being about the same above and below 1.5 million.
When you look at Chart 2, this seems reasonable pre-2006. But post-2006, the trough was at a new low of about 0.5 million units per year compared to the previous troughs of about 1.0 million units.
At the same time, the current peak at about 1.8 million units seemed to be much lower than the historical peaks. This then begs the question of whether there is some fundamental change to the Housing Starts pattern.
As a value investor worried about protecting the downside, I cannot rule this out. As such in analyzing and valuing MTH, I also considered this possibility.
Cyclical performance
“Cyclical and commodity companies…value is often more dependent on the movement of a macro variable (the commodity price or the growth in the underlying economy) than it is on firm-specific characteristics…the biggest problem we face in valuing companies tied to either is that the earnings and cash flows reported in the most recent year are a function of where we are in the cycle, and extrapolating those numbers into the future can result in serious misvaluations.” Damodaran
This begets the question of how you “normalize” the performance. Damodaran has suggested 3 ways:
- Absolute average over time. This means taking the average values over the cycle.
- Relative average over time. “In effect, we can average profit margins over time, instead of net profits, and apply the average profit margin to revenues in the most recent period to estimate normalized earnings.” Damodaran.
- Sector averages. Damodaran suggested this be used for companies with limited history or undergoing some operating changes.
In my valuation of MTH, I adopted the first two approaches.
Asset Value
As a homebuilder, a significant portion of MTH assets is real estate. This meant that the Asset Value is a good estimate of its intrinsic value.
As of the end Sep 2022, MTH had a Book Value of USD 100 per share. The Tangible Book Value is also about USD 100 per share. As such I would estimate its Asset Value as USD 100 per share.
The challenge for cyclical companies is that if the downtrend is prolonged, there would be underutilization of assets. At the same time, the value of inventory may fall below the market value. In such situations, there would be an impairment of assets.
During the last Housing Starts decline from 2005 to 2009, MTH revenue declined from USD 3 billion to about USD 1 billion. During this period, MTH wrote off USD 788 million of assets. This is almost 40% of the 2005 Total Assets.
This is probably due to the severity and pace of the decline. Within 4 years, MTH revenue reduced by about 2/3.
This impairment is not limited to MTH as other homebuilders suffered the same problem as shown in Table 1.
Table 1: Sample homebuilders impairments (Author)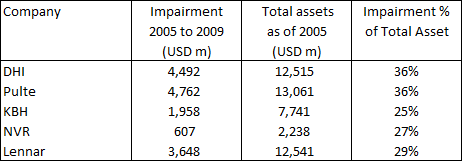
While I do not have a crystal ball, I would say that the current Housing Starts downtrend would probably last till 2024 at the earliest. This is because I do not see any interest rate decline until then. At the same time, the fear of a recession will impact the demand for houses.
From 2019 to 2022, MTH’s revenue grew at 58 %. Assuming the same pattern of decline as that for the revenue growth, I would project that its 2025 revenue to be about USD 3.7 billion i.e. about a 1/3 drop.
If 2/3 = 40 % impairment, dare we say that 1/3 = 20 %? If we accept this, then be prepared for USD 5.8 billion X 20% = USD 1.2 billion impairment.
If I factor this into the Book Value, we would have an Asset Value of USD 67 per share.
I am not suggesting that this is what will happen. My point is that you cannot look at the Asset Value of MTH without factoring in some impairment. The challenge is that there is not enough information at this stage to make a realistic guess.
Earnings Value
According to Bruce Greenwald, you can get strategic insights by comparing the Asset Value with the Earnings Value. In a competitive environment, you would expect the Earnings Value to be equal to the Asset Value.
To estimate the Earnings Value of MTH, I used a single-stage Free Cash Flow to the Firm (FCFF) model of Value = FCFF X (1+g) / (WACC – g)
Where:
FCFF = EBIT X (1 – tax) X (1 – Reinvestment rate).
EBIT = Revenue X (Gross Profit margin – SGA margin)
g = growth = Reinvestment rate X Return.
Given g, we can estimate the Reinvestment rate = g / Return.
Return = EBIT X (1 – tax) / Total Capital Employed or TCE.
I estimated the TCE by determining the TCE/Revenue ratio X Projected Revenue.
WACC = weighted average cost of capital obtained from the first page of a Google search for the term “Meritage Homes WACC”. Refer to Table 2.
Table 2: Estimating the WACC (Author)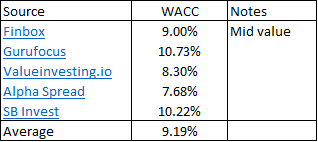
I looked at 2 scenarios to determine EBIT:
- Scenario 1. Based on the actual average 2006 to 2022 Revenue. Note that the 2022 values are the Sep LTM values.
- Scenario 2. Based on the revenue generated with 1.5 million long-term annual average Housing Starts. I obtained this by scaling the 2021 revenue with (1.595 / 1.5) where 1.595 was the 2021 Housing Starts.
The computation of the Earnings Value of MTH based on these 2 scenarios are summarized in Table 3. They are
- USD 25 per share under Scenario 1
- USD 61 per share under Scenario 2.
Contrast this with the Asset Value of USD 100 per share.
Table 3: Estimating the Earnings Value (Author)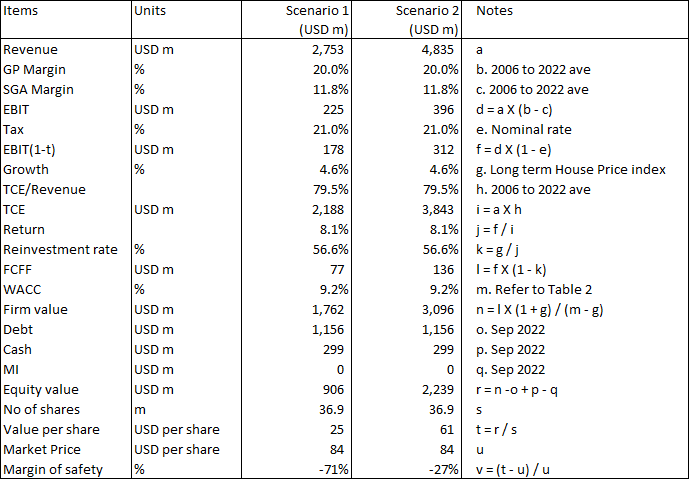
Sensitivity analysis
In estimating the Earnings Value, I have made assumptions about the cash flows, growth, and discount rate.
The cash flows are very conservative as I took the 2006 to 2022 averages. As can be seen from Chart 4, there have been improvements in the Gross Profit margins and a reduction in the SGA margins over the past few years. If I factor in these changes, we would have a higher Earnings Value.
I carried out sensitivity analysis based on 2010 to 2022 (the uptrend part of the cycle) will have a GP margin of 22.1 % and an SGA margin of 11.6 %. With these, the Earnings Value would be USD 96 per share under Scenario 2.
Chart 4: GP margin and SGA margin trends (Author)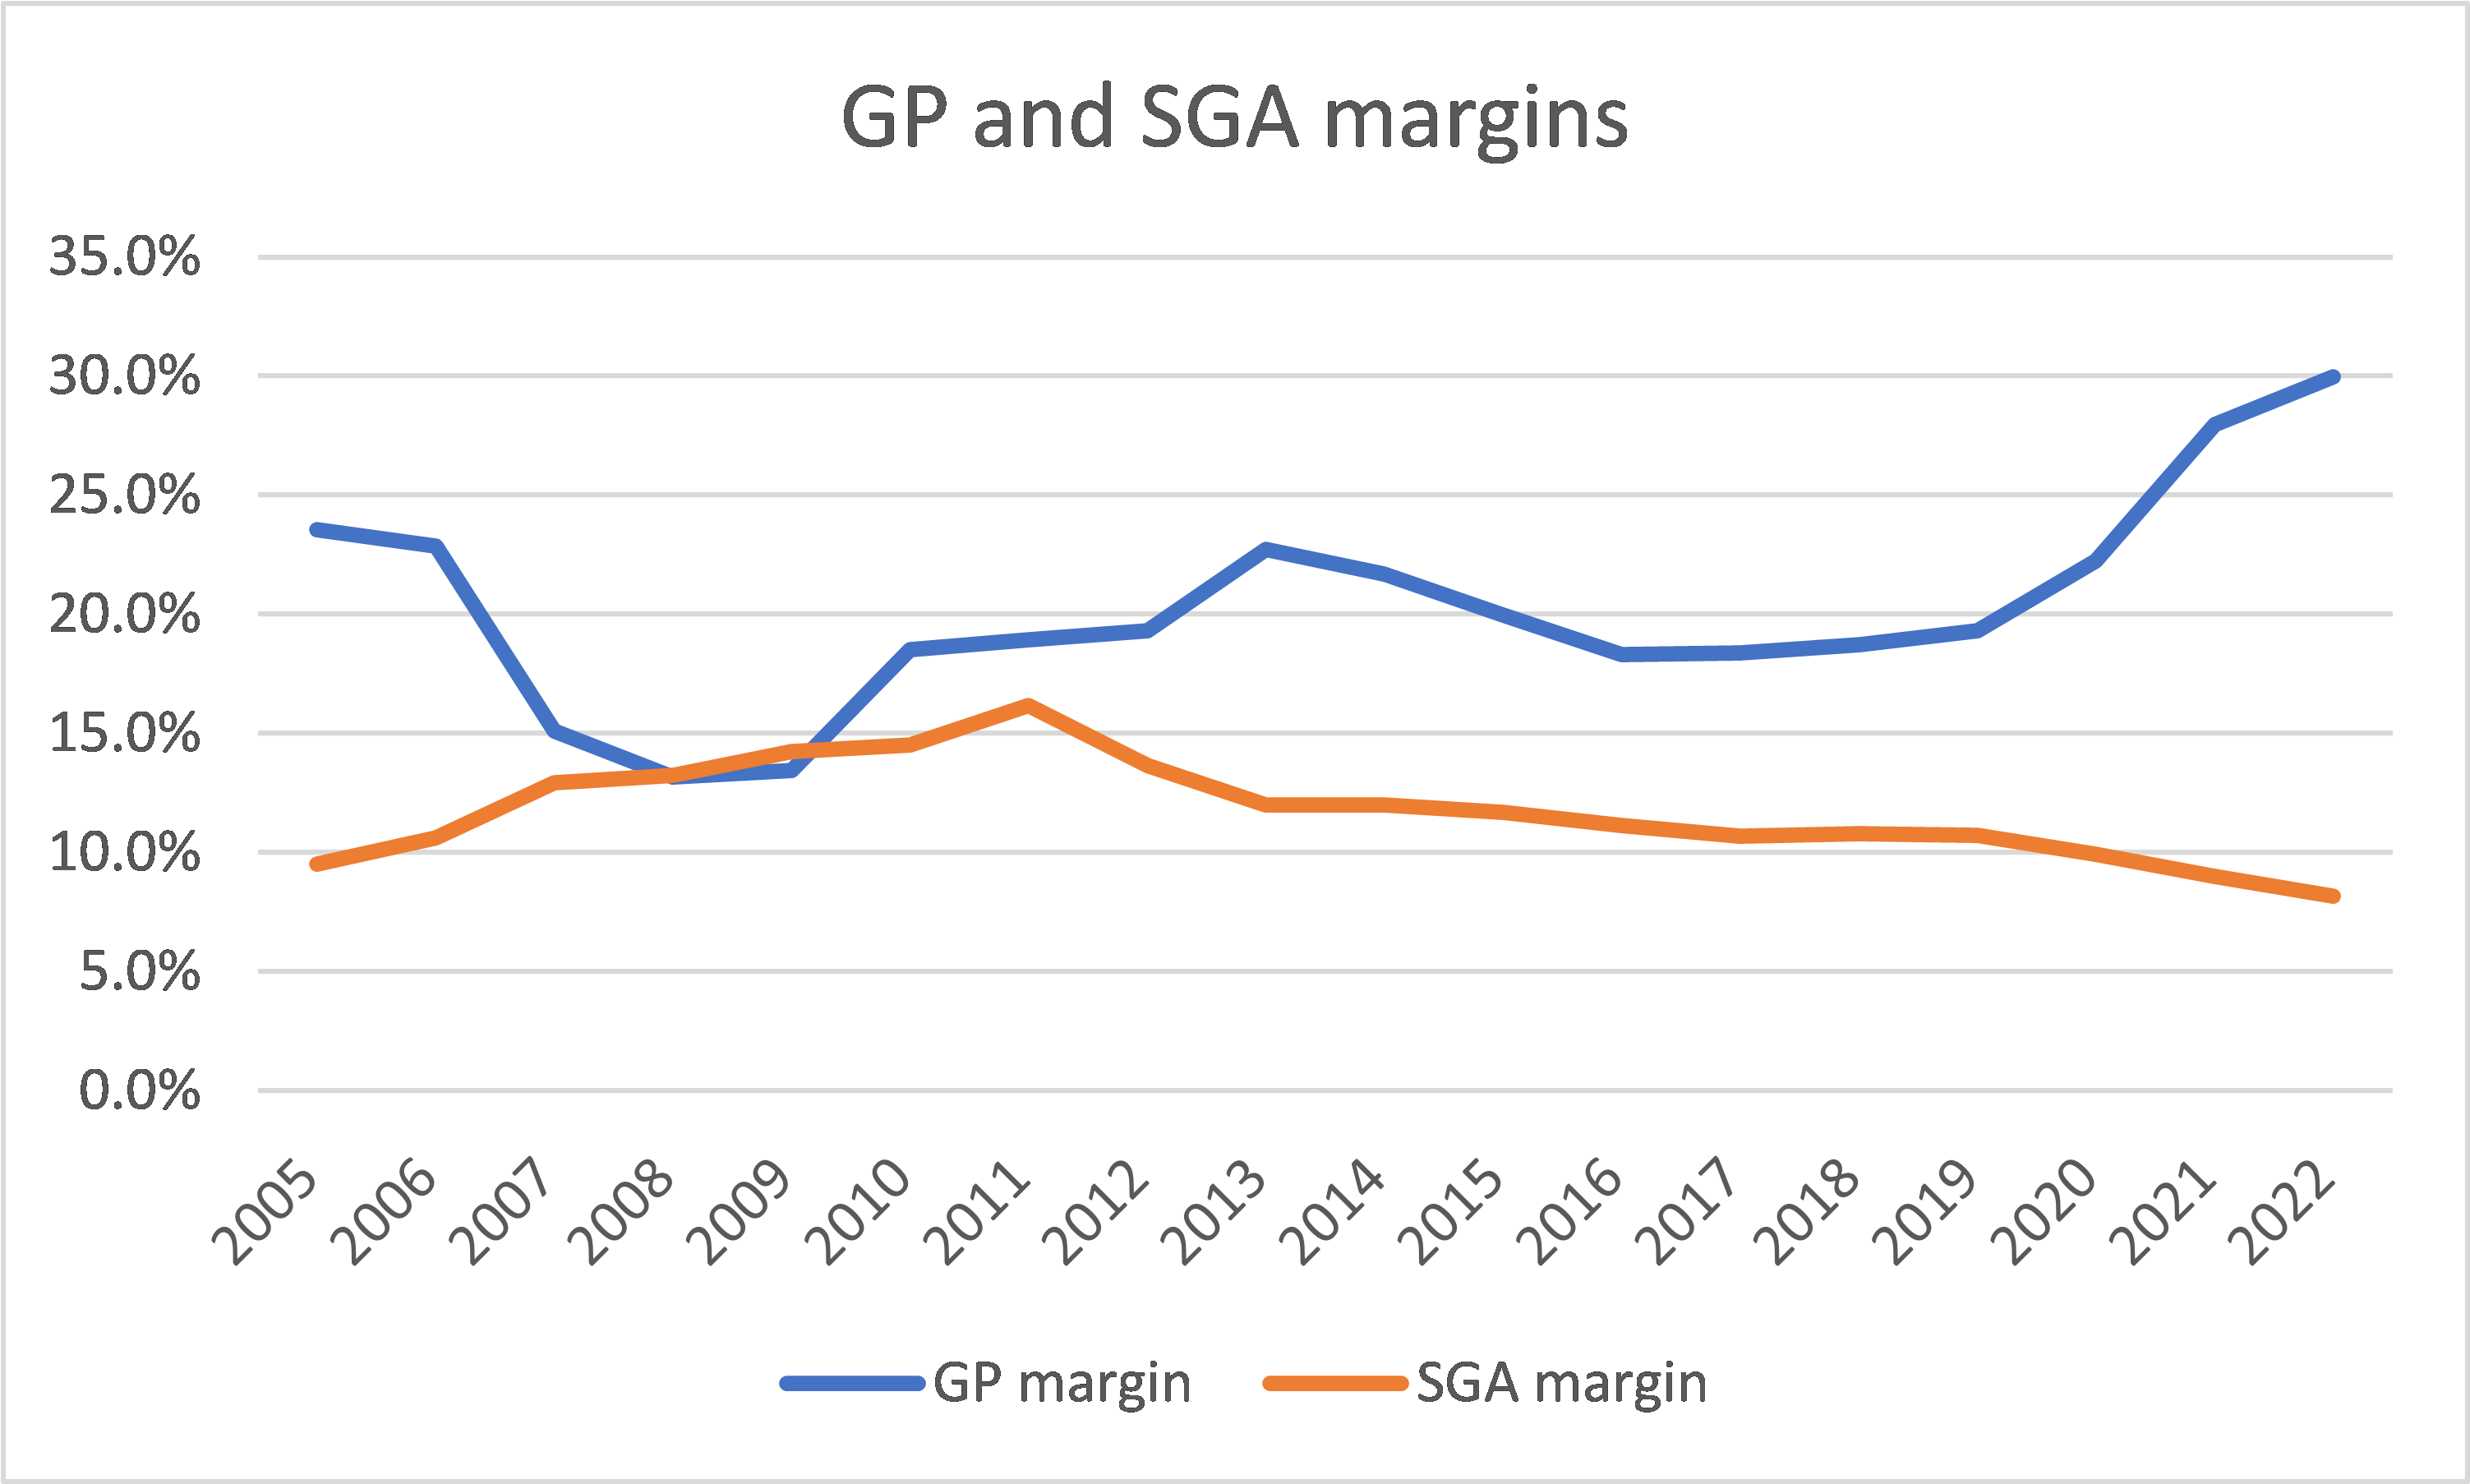
At the same time, the WACC was assumed to be 9.2 %. In deriving these, many of the sources used the current risk-free rate. For consistency, since l use the Free Cash Flows over the 2006 to 2022 period, I should also use the WACC over this period.
As can be seen from Chart 5, the average risk-free rate from 2006 to 2020 would be lower than the current rate. At the same time, instead of using the current risk premium, we should also use the risk premium over the cycle.
My point is that the WACC used is probably on the high side. If I factor this in, the Earnings Value would be higher.
If I assumed the 2010 to 2022 GP margins and SGA margins, 8.2 % WACC and USD 1.2 b impairments, the Earnings Value under Scenario 2 = USD 96 per share.
But this is number crunching as I do not have a strong basis for these assumptions.
Chart 5: 10 year Treasure rates (Macrotrends)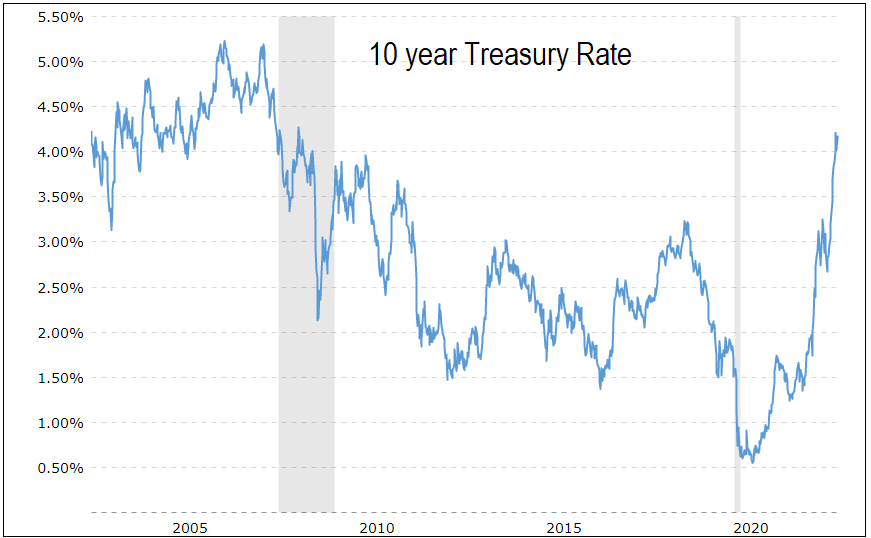
Conclusion
For companies with significant real assets such as homebuilders, the Asset Value = Tangible Book Value provides a good estimate of the intrinsic value. On this basis, you would think that the intrinsic value of MTH is USD 100 per share.
But MTH is in a cyclical sector with a history of impairments during the downtrend part of the cycle. We should adjust the Asset Value by the potential impairments.
But we do not have sufficient information at this stage to estimate the potential impairment. However, we can get clues about this by looking at the Earnings Value.
In the case of MTH, the Earnings Value would depend on your view of the performance over the cycle. I considered 2 Scenarios.
Scenario 1 is in line with Damodaran’s actual average approach. However, it meant that the cyclical performance is based on the 2006 to 2022 Housing Starts annual average of 1.16 million. On the other hand, Scenario 2 is based on the long-term annual average Housing Starts of 1.5 million.
At this stage, I am more inclined to follow 70 years of history rather than assume that there is some decline in the long-term annual average Housing Starts.
On this basis, the intrinsic value is USD 61 per share. But I have shown that this is a conservative estimate as I have not considered the improvements in the margins or a lower discount rate.
In my analyses, I have shown that we can have situations where the Earnings Value is about the same as the Asset Value of USD 100 per share. I have also shown that we can have situations where the Earnings Value is about the same as the impaired Asset Value of USD 67 per share.
The main unknown here is the impairments. Until there is more information to enable a more realistic estimate of this, I would recommend the following:
- Do not buy at the current market price of USD 84 per share as there is not enough margin of safety.
- If you had bought it under USD 60 per share, sell at the current price.
- If you had bought it between USD 60 per share to USD 70 per share, hold.
Be the first to comment