

South_agency/E+ via Getty Images
In my previous article on Medtronic (NYSE:MDT), I wrote the following:
Management revised FY 2022 revenue guidance to between $32.2B and $32.6B in the Q2 Earnings Presentation. This means revenue would have to average $8.183B over the next two quarters to meet the lower end of the guidance. For comparison, Medtronic had its best quarter ever in April 2021 with revenue of $8.188B. Given the COVID surge and the associated likely delay of elective procedures, even the low end of the latest guidance seems aggressive. In addition, the company never adjusted its EPS guidance when it lowered revenue. Fewer procedures also lower margins since overhead is spread across fewer delivered devices. Therefore, it seems likely that FY 2022 EPS will fall short of estimates as well.
As anticipated, FY 2022 revenue of $31.686 was below guidance and non-GAAP diluted EPS of $5.55 was below management’s estimated range of $5.65 to $5.75 due to supply chain issues and COVID. These problems persisted into FY Q1 2023. As a result, revenue over the past twelve months continued to decline.
Seeking Alpha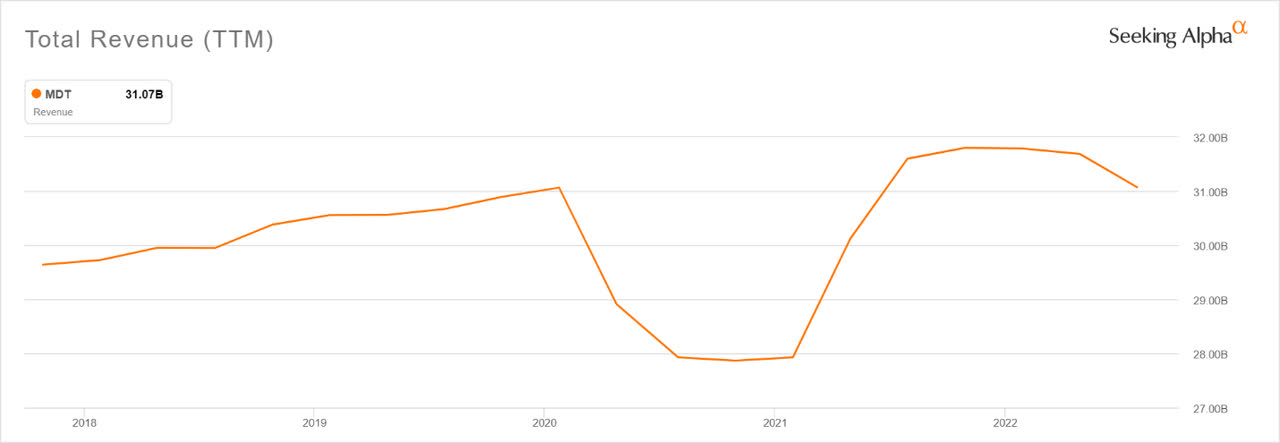
Operating income followed revenue and continues to be below pre-pandemic levels.
Seeking Alpha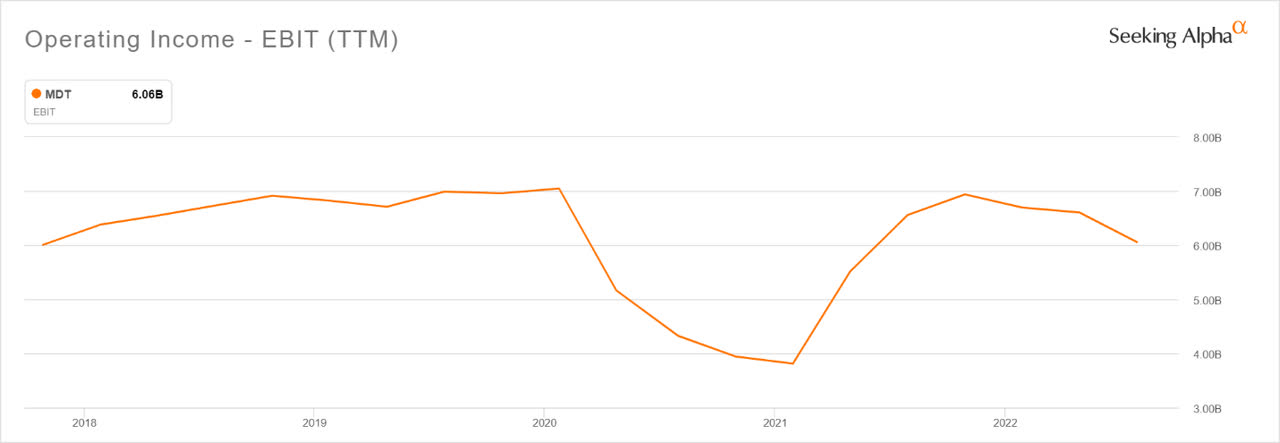
As results fell short of expectations and the overall market declined, price-to-earnings declined to near 5-year lows.
Seeking Alpha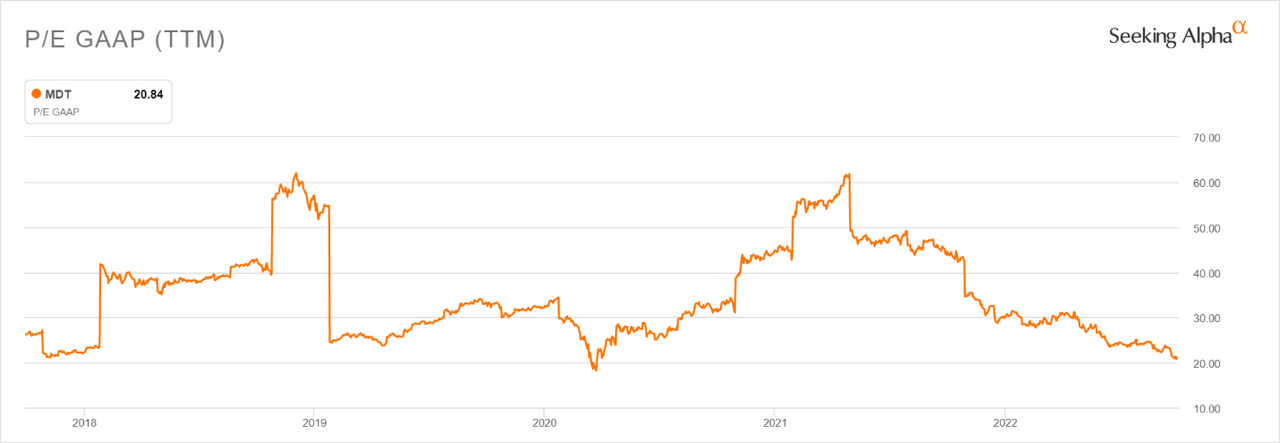
The combination of multiple contraction and subpar earnings drove enterprise value to be near 5-year lows as well.
Seeking Alpha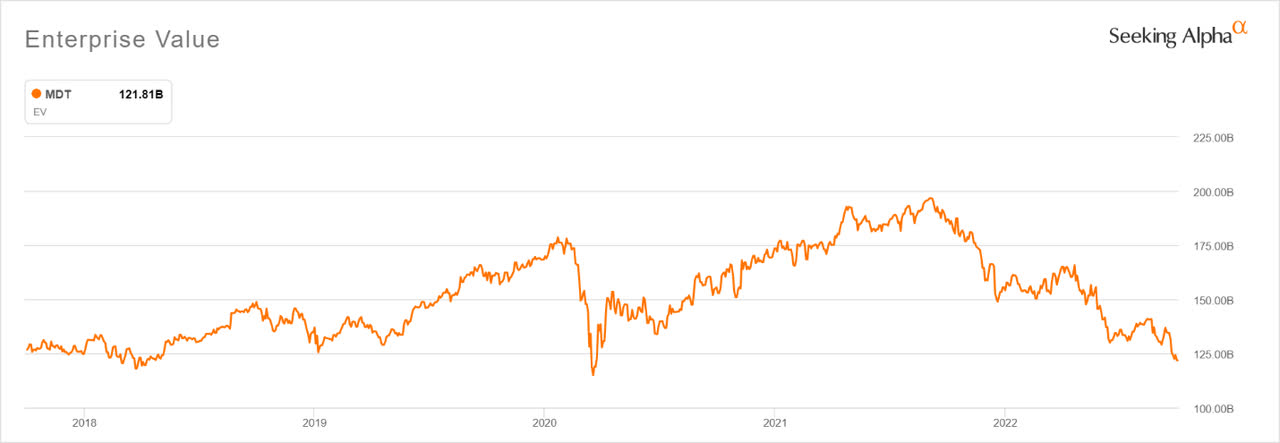
Latest Results
In the FY Q1 2023 earnings release, management guided FY2023 organic growth of 4-5% and a currency headwind of $1.4-1.5B. When combined, these result in zero revenue growth over 2022. Given that revenue declined 8% year-over-year in Q1, the company will have to return to growth soon to offset a difficult start to the fiscal year. According to the 2022 Wells Fargo Healthcare Conference presentation, the company is on track to resolve issues with resins, packaging, and China-based supply by the end of FY Q2 2023, so a second half recovery seems plausible.
Even with all of the headwinds, Medtronic returned $5.5B in cash to shareholders during FY 2022, or ~ 5% of the current market capitalization. Given management projects non-GAAP FY 2023 EPS to be about the same as last year, ~5% cash-on-cash return for this year seems likely.
Key Inputs
The inputs to the valuation are: operating earnings growth and multiple expansion. These parameters are estimated for five different scenarios: Minimum (0th percentile), Worst Case (10th percentile), Most Likely, Best Case (90th percentile), and Maximum (100th percentile). Historical data, current data, management estimates, and best guesses underlie the following assumptions:
Operating Earnings Growth: Base case matches midpoint of FY 2023 guidance, or 0% growth
- Minimum: Supply constraints, recession, and currency headwinds cause a decline of 15%, or approximately the peak-to-trough 2021-2022 decline
- Worst Case: Some combination of supply constraints, recession, and currency headwinds cause a decline of 10%
- Most Likely: Matches base case
- Best Case: Some combination of supply constraints, recession, and currency headwinds easing result in 10% increase
- Maximum: Matches previous 2021 high, or an 18% increase
Price-to-earnings: Base case matches current value of ~20
- Minimum: Drops to 15, or decline of 25%
- Worst Case: Drops to 17, or decline of 15%
- Most Likely: Matches base case
- Best Case: Increases to early June 2022 values of 25, or 25% increase
- Maximum: Matches November 2021 values of 35, or 75% increase
The base case annual total return is assumed to be the projected cash-on-cash return of 5%. For the other scenarios, the assumptions are combined to calculate the following estimates of total return.
Poppertech
Forecast
To create the forecast, the above scenarios are input into software that creates the graph below and associated statistics. The black values underneath the graph indicate the total return values as shown in the previous table of scenarios. The white percentage values overlaid on the graph correspond to the proportion of the total area under the curve within each colored region. This is the forecast probability of the total return falling within the associated range. For example, the light green region represents a 33% chance that total return is between 5% and 38% over the next year.
Poppertech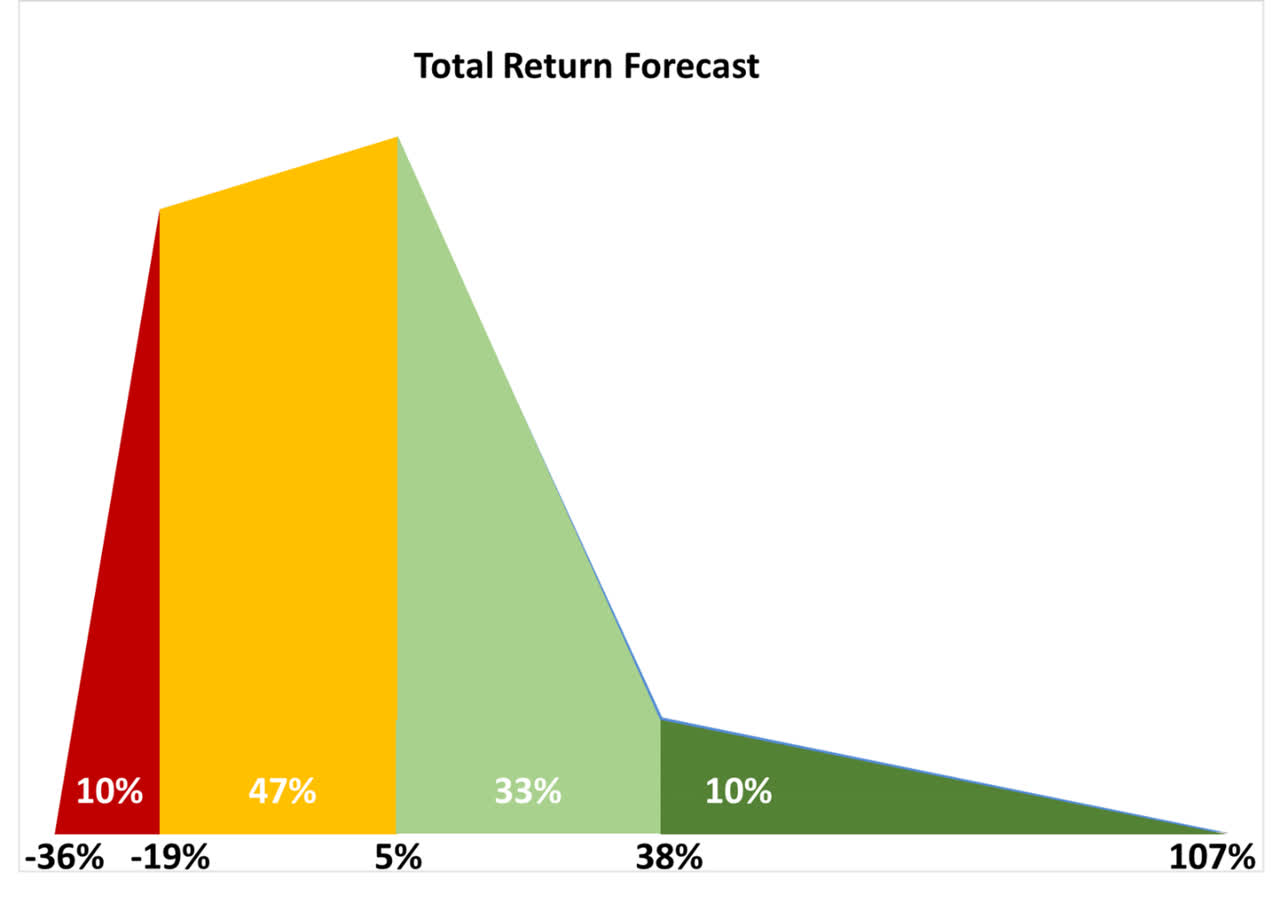
Based on the above forecast, the software performs a Monte Carlo analysis to calculate expected return and risk. The resulting statistics are shown below.
Poppertech
At an expected return of 5% and asymmetrically positive risk-return profile (positive skewness), Medtronic is a buy. Performance has been hampered by industry-specific execution issues. If these are resolved over the next year, Medtronic is likely to outperform the market by a wide margin.
Be the first to comment