

JHVEPhoto
Thesis
Leading medical technology and device maker Medtronic’s (NYSE:MDT) stock has been battered in 2022. The market astutely digested its massive surge from its March 2020 COVID bottom, as its revenue growth and operating leverage normalized.
The company also had to deal with several supply chain challenges that led to another steep sell-off after its FQ4 earnings. Despite the pessimism observed in MDT, we believe the stock has likely staged a long-term bottom.
For fundamentally-strong stocks like MDT, price action analysis adds tremendous insights, helping corroborate the robustness of the underlying fundamental thesis.
Accordingly, we present why we think MDT has likely bottomed on its long- and medium-term charts, offering investors a fantastic opportunity to add exposure.
MDT – Long-Term Bottom Is In Position
MDT price chart (monthly) (TradingView)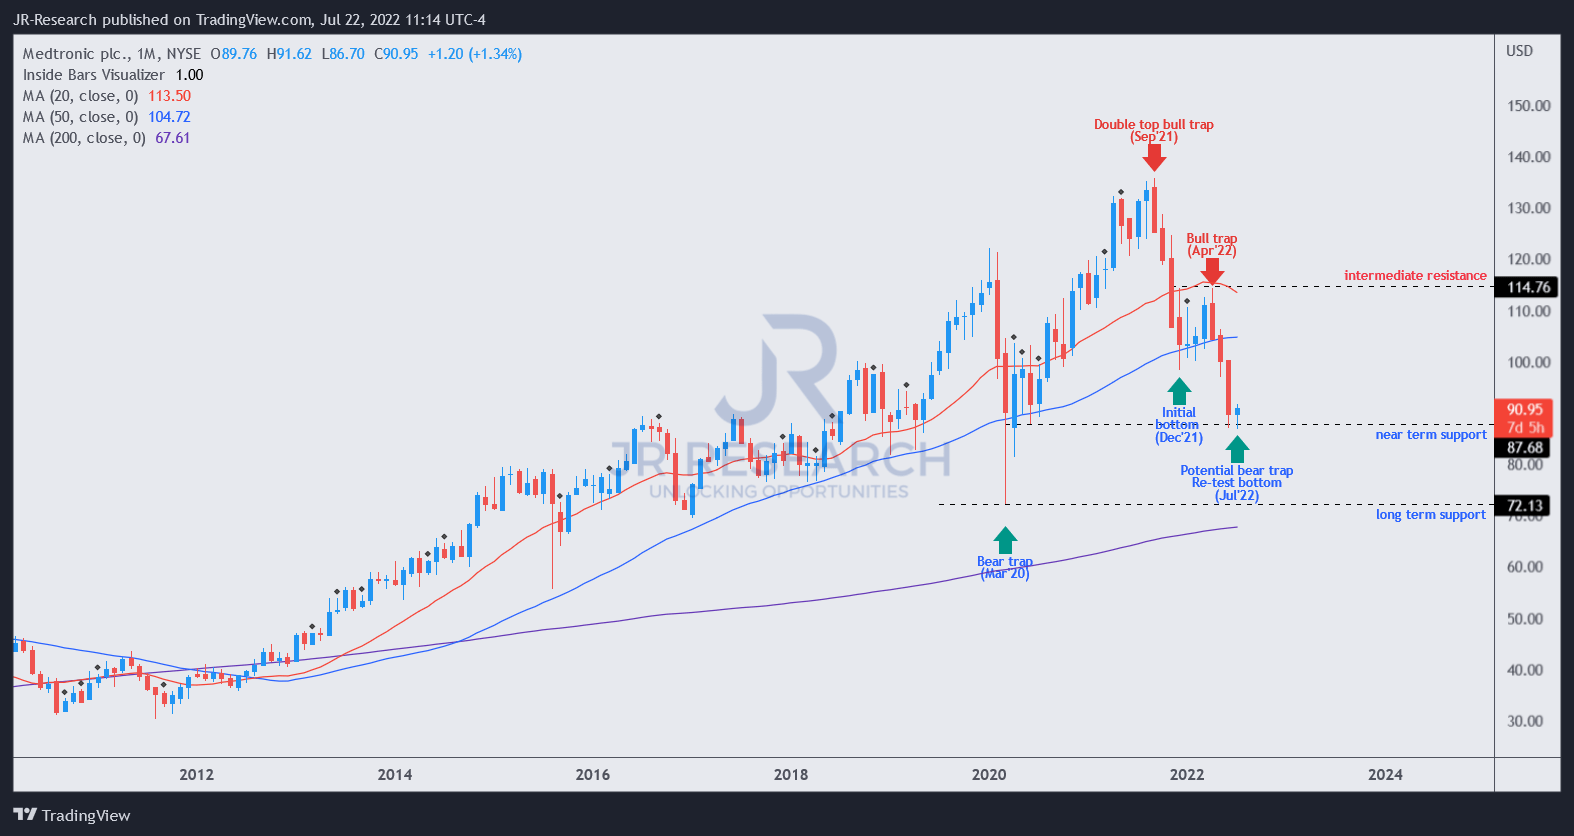
To better understand our charts, investors should first consider the two critical zones formed by its intermediate resistance ($115) and near-term support ($88). We believe the price action will likely occur between these two zones in the medium term.
Next, consider why the market thinks MDT is a fundamentally-strong stock. See the robust long-term uptrend over time. Significant dips in its long-term trends have proven to be incredible opportunities to add exposure over time.
Next, consider the double-top bull trap that formed in September 2021. Such potent bull traps represent the market’s intention to reject further buying upside decisively. Furthermore, it also represented the early warning signals for investors to cut exposure markedly and rotate into cash/or other beaten-down equities.
Notably, the market sent MDT into a steep sell-off after its September trap and formed an initial bottom in December 2021. However, investors should ignore bottoming signals right after double tops, as they are often unreliable.
Consequently, the market formed another bull trap in April 2022, which sent MDT tumbling further to its recent bottom in July. The ominous trap in April also preceded the company’s disappointing FQ4 card, indicating the market was expecting poor results in advance (always remember the market is a forward-discounting mechanism).
MDT price chart (weekly) (TradingView)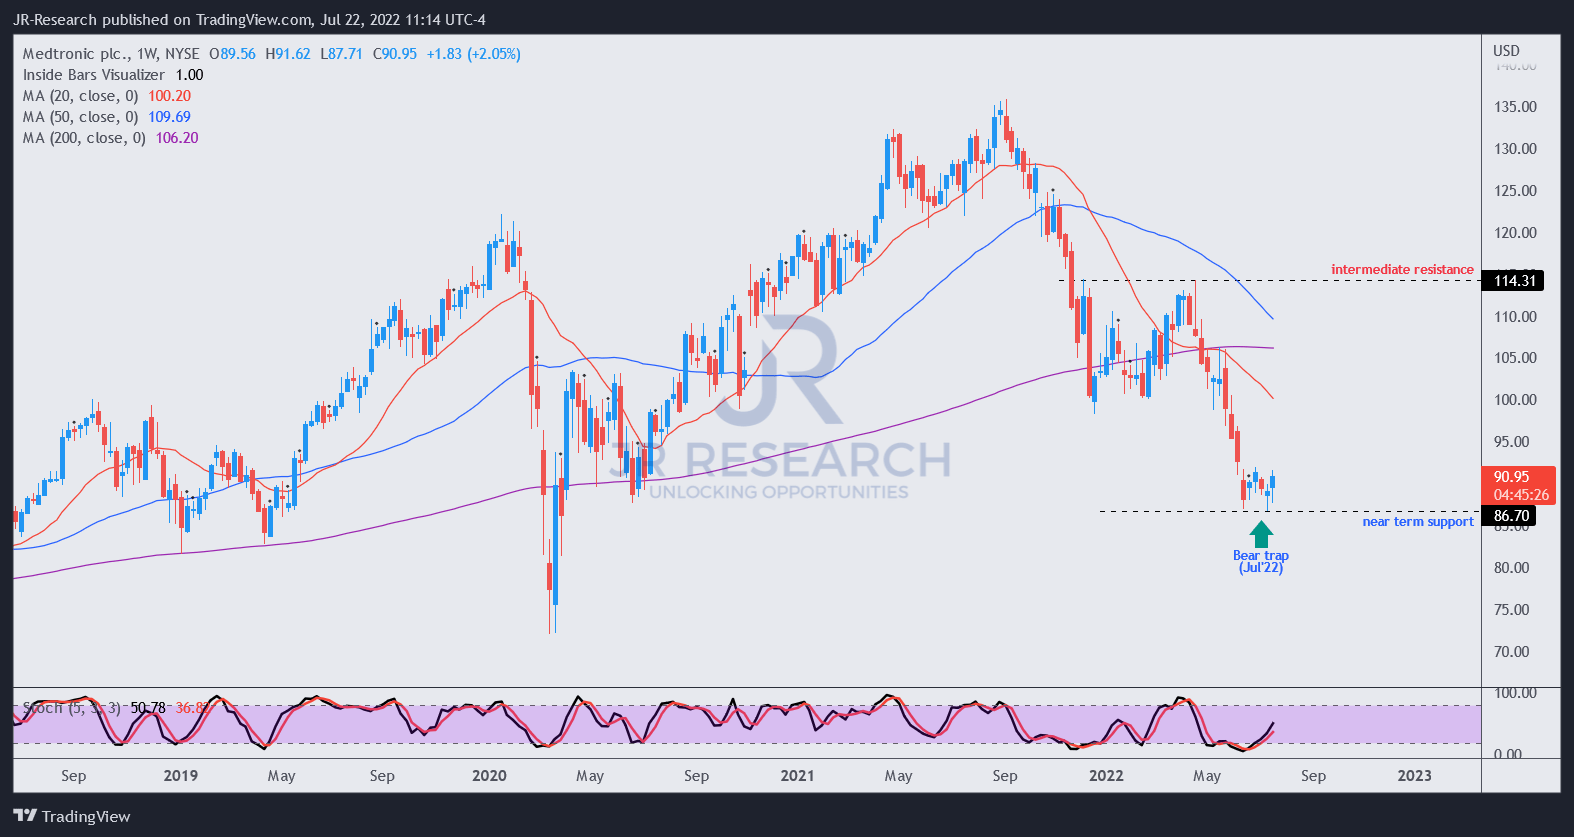
Poring over its medium-term chart, the price action is discernibly more volatile (typical when we move into shorter time frames).
Notwithstanding, MDT also has an upward bias over time on its medium-term chart. However, MDT is currently in a medium-term bearish bias and has moved into a medium-term downtrend since 2022. Therefore, investors should look for the market to demonstrate signals of what we term false breaks to the downside. Such false breaks are meant to ensnare pessimistic/bearish investors or traders into executing directionally-bearish set-ups, thinking the price levels could fall further.
We believe the false break or bear trap formed last week, as the market resolutely rejected further downside, as seen above.
Consequently, we have a validated bear trap on its medium-term trend and a potential bear trap (pending validation by the end of July) on its long-term trend. Therefore, we believe the market is flashing a robust buying signal.
Does It Corroborate Medtronic’s Underlying Metrics?
Medtronic revenue change % and adjusted EBIT change % consensus estimates (S&P Cap IQ)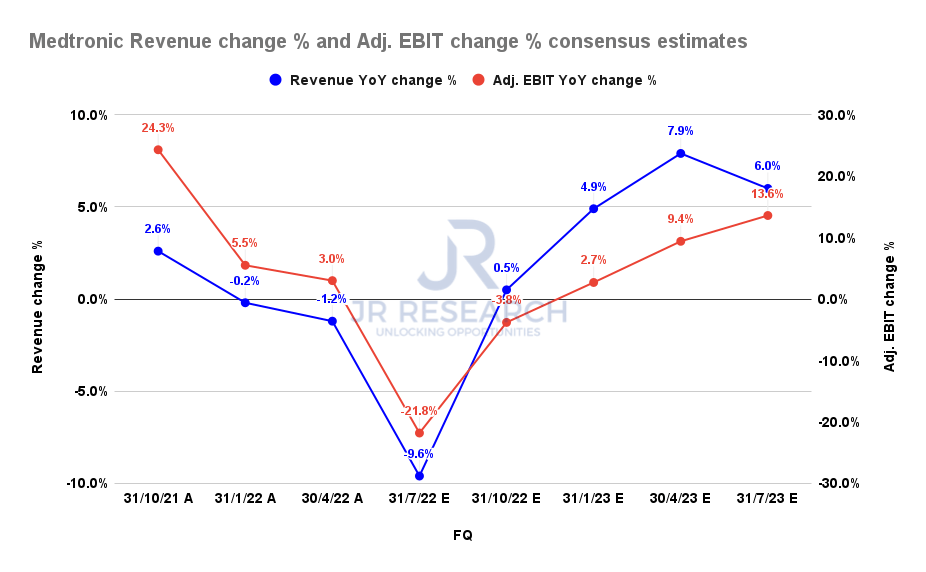
Is the hammering in MDT stock justified? Absolutely. Consider that the market set up the double top in September 2021, as it anticipated Medtronic’s revenue and adjusted EBIT growth to fall significantly through FQ1’23 (quarter ending July 2022).
However, the consensus estimates (bullish) suggest that Medtronic’s operating performance could hit its nadir in FQ1 before recovering through FY23. Hence, things should look better for Medtronic from here.
Medtronic FCF margins % consensus estimates (S&P Cap IQ)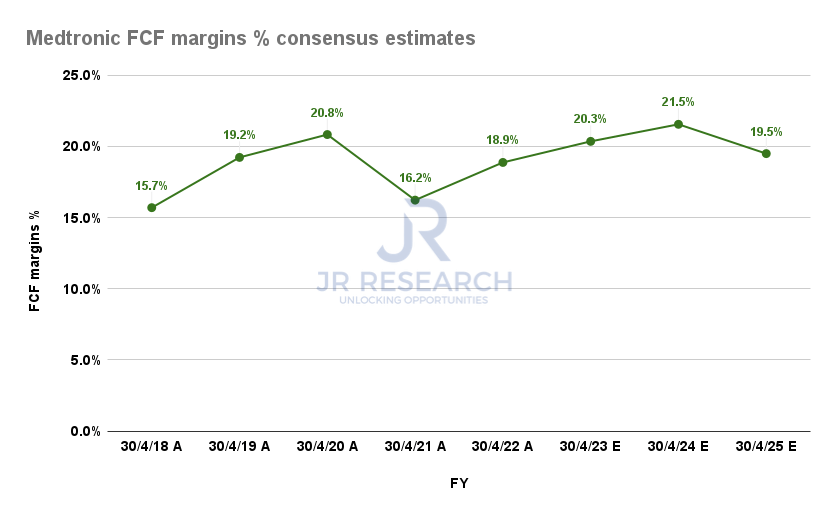
How about its free cash flow (FCF) profitability? The Street expects Medtronic to continue posting robust FCF margins through FY25, helping to underpin its valuation. Hence, we believe the MDT’s long-term uptrend justifies its fundamental metrics, which are expected to remain solid.
Is MDT Stock A Buy, Sell, Or Hold?
We rate MDT as a Buy.
When a fundamentally-strong stock like MDT flashes robust technical buy signals, underpinned by bear trap price action on its medium- and long-term charts, we believe a Buy decision is straightforward.
Coupled with its strong fundamentals, we believe MDT investors should leverage its long-term bottom to add exposure.
Be the first to comment