

coldsnowstorm
Political Calculations’ initial estimate of median household income in October 2022 is $78,813, an increase of $218 (or 0.28%) from the initial estimate of $78,595 in September 2022.
The latest update to Political Calculations’ chart tracking Median Household Income in the 21st Century reflects the results of that revision, showing the nominal (red) and inflation-adjusted (Blue) trends for median household income in the United States from January 2000 through October 2022. The inflation-adjusted figures are presented in terms of constant October 2022 U.S. dollars.
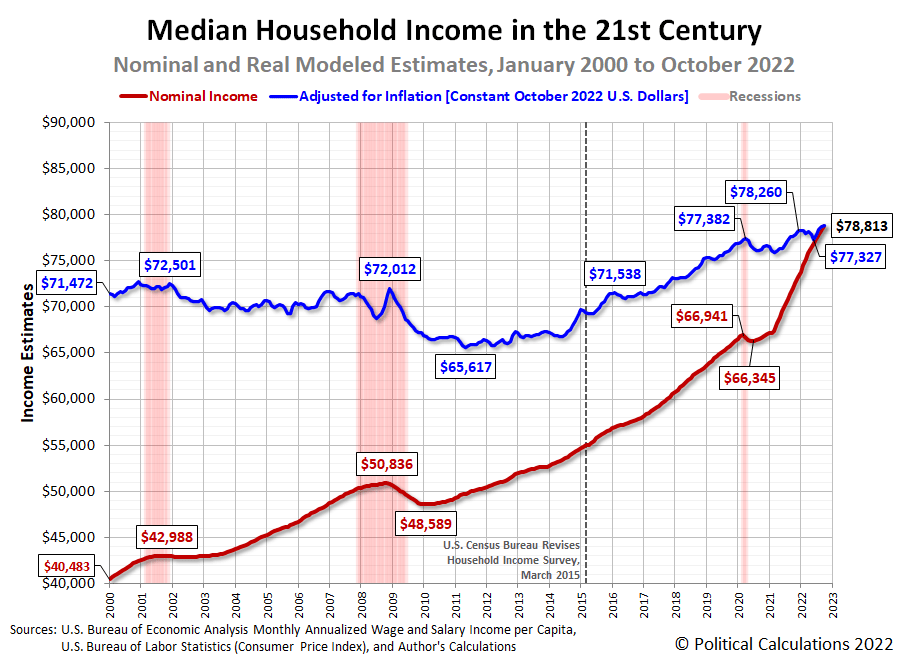
Adjusted for inflation, October 2022’s estimated median household income of $78,813 represents a new record peak for this demographic characteristic, exceeding the December 2021’s previous peak by $554. However, we also observe the real rate of growth of median household income noticeably slowed in October 2022, suggesting the U.S. economy is slowing after its third-quarter rebound.
Turning our attention next to average personal earned income, we find that this measure continues to show signs of a decelerating economy. Average personal wage and salary income is more sensitive than median household income to changing economic conditions, so its trends are of increasing interest with the rising probability of recession taking hold during the next twelve months. Here is the latest update to our chart tracking the average income earned by individual Americans during President Biden’s tenure in office.

Here, we confirm the average American’s earned income, after adjusting for inflation, is continuing to trend well below its December 2021 peak in terms of constant October 2022 U.S. dollars, and is nearly unchanged from September 2022’s revised level. Meanwhile, nominal income growth during 2022 has slowed substantially compared with how fast it grew during 2021. We see the gap between actual average income growth and a simple linear projection based upon 2021’s rate of income growth continues to widen.
Since this chart focuses on incomes earned by individual Americans, it is especially relevant to people who live alone. This particular demographic, which represents 29% of all U.S. households, bears the brunt of the erosion of buying power that has accompanied inflation during 2022.
Analyst’s Notes
The BEA made significant downward adjustments to its aggregate wage and salary data for the months of April through September 2022. Going month by month, April was revised down by 0.29%, May by 0.49%, June by 0.59%, July by 0.58%, August by 0.54%, and September 2022 by 0.50%.
References
U.S. Bureau of Economic Analysis. Table 2.6. Personal Income and Its Disposition, Monthly, Personal Income and Outlays, Not Seasonally Adjusted, Monthly, Middle of Month. Population. [Online Database (via Federal Reserve Economic Data)]. Last Updated: 1 December 2022. Accessed: 1 December 2022.
U.S. Bureau of Economic Analysis. Table 2.6. Personal Income and Its Disposition, Monthly, Personal Income and Outlays, Not Seasonally Adjusted, Monthly, Middle of Month. Compensation of Employees, Received: Wage and Salary Disbursements. [Online Database (via Federal Reserve Economic Data)]. Last Updated: 1 December 2022. Accessed: 1 December 2022.
U.S. Department of Labor Bureau of Labor Statistics. Consumer Price Index, All Urban Consumers – (CPI-U), U.S. City Average, All Items, 1982-84=100. [Online Database (via Federal Reserve Economic Data)]. Last Updated: 10 November 2022. Accessed: 10 November 2022.
Editor’s Note: The summary bullets for this article were chosen by Seeking Alpha editors.
Be the first to comment